Strategy vault / Trend following
Multi Indicator Trend Divergence Quantitative Trading Strategy
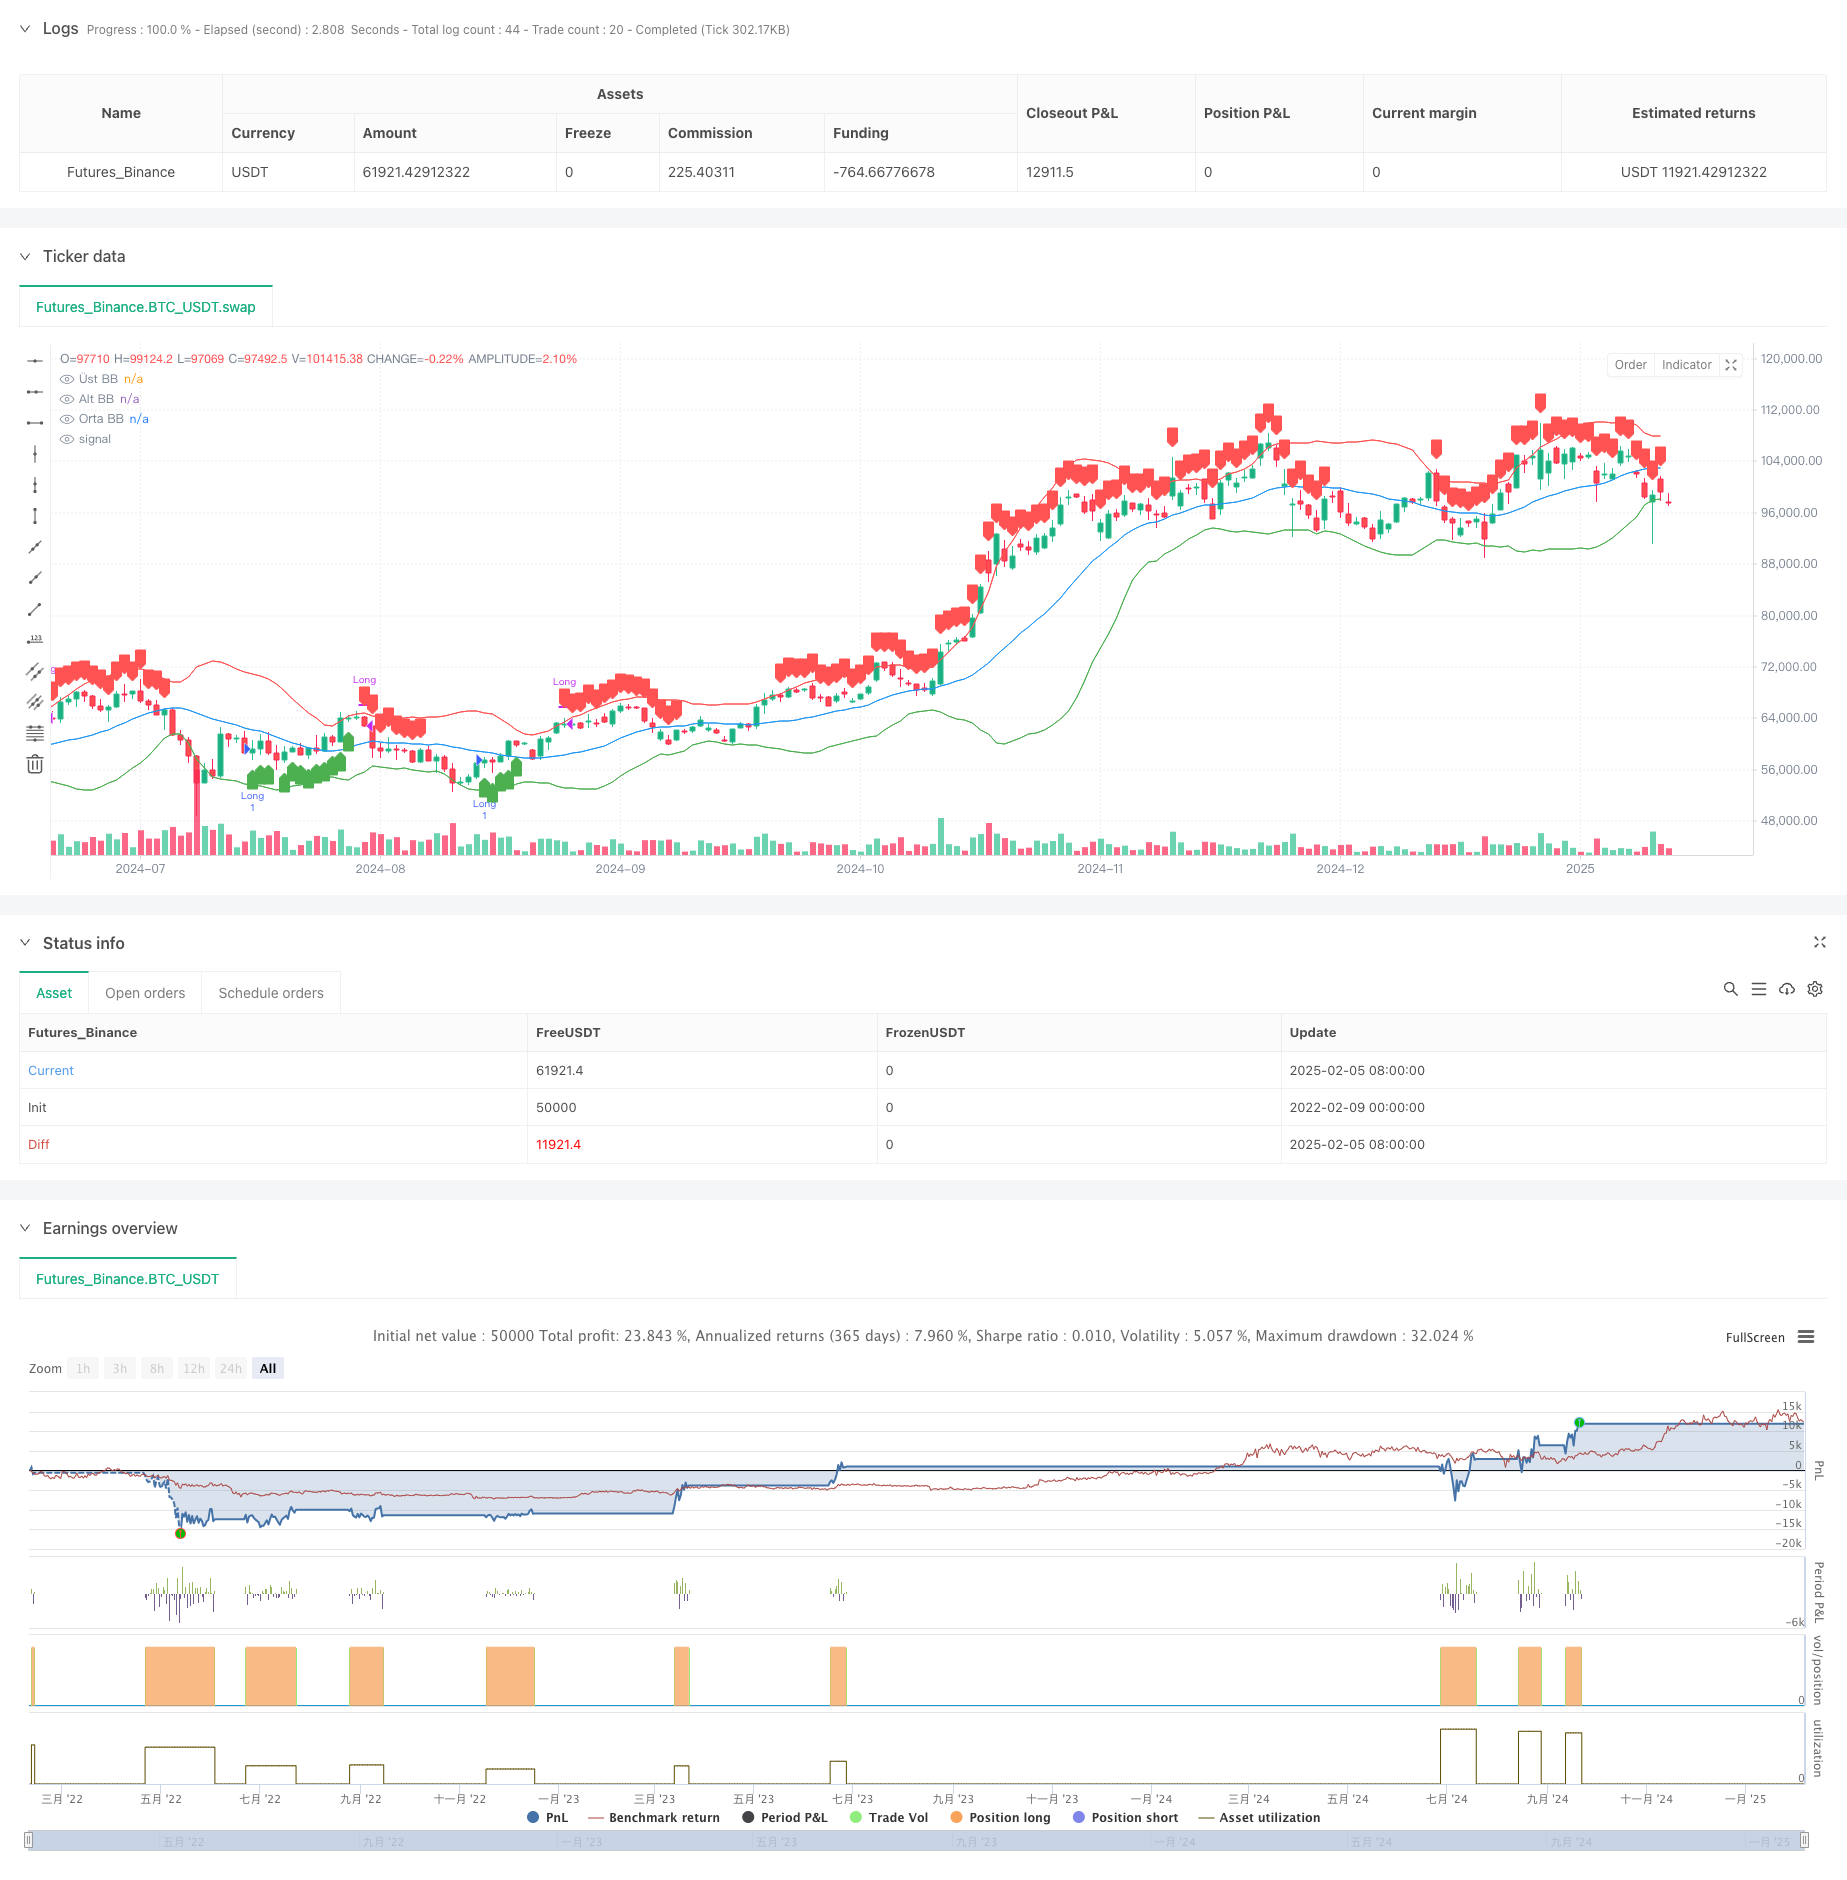
This is a trend following and divergence trading strategy based on multiple technical indicators. The strategy combines Bollinger Bands, Relative Strength Index (RSI), Stochastic Oscillator, and Money Flow Index…
Overview
This is a trend following and divergence trading strategy based on multiple technical indicators. The strategy combines Bollinger Bands, Relative Strength Index (RSI), Stochastic Oscillator, and Money Flow Index (MFI) to capture market overbought and oversold opportunities, enhancing signal reliability through multi-indicator cross-confirmation.
Strategy Principle
The strategy employs a multi-layer filtering mechanism to confirm trading signals:
- Uses Bollinger Bands(20,2) as a reference for price volatility range, with price breaking below the lower band triggering potential buy signals.
- RSI(3) is set with overbought/oversold zones (85,15), confirming oversold conditions when RSI breaks above 15.
- Stochastic(10,3) is set at (85,15), further confirming oversold conditions when K line breaks above 15.
- MFI's 10-period EMA trend confirms capital flow direction, with upward trends supporting buy signals. Buy conditions require simultaneous satisfaction of: price breaking below BB lower band, RSI breaking above oversold, Stochastic breaking above oversold, and MFI trend moving upward. Sell conditions are opposite: price breaking above BB upper band, RSI breaking below overbought, Stochastic breaking below overbought.
Strategy Advantages
- Multiple technical indicator cross-validation significantly reduces false signals.
- Combines trend and momentum indicators to capture trends and predict reversals.
- Uses fast RSI(3 periods) for improved entry timing.
- Confirms capital flow direction through MFI for increased reliability.
- Uses Bollinger Bands as volatility reference, adapting to different market conditions.
Strategy Risks
- Multiple indicators may lead to signal lag, missing optimal entry points.
- May generate frequent trades in ranging markets.
- Fast RSI might be sensitive to noise.
- Requires large sample size to verify strategy stability. Recommended risk control measures:
- Set stop-loss and take-profit levels
- Control position size
- Adjust parameters for different market conditions
- Implement additional market feature filters
Strategy Optimization
- Dynamic indicator parameter adjustment:
- Adapt Bollinger Bands parameters based on market volatility
- Adjust RSI and Stochastic periods based on market cycles
- Add market environment filters:
- Include trend strength indicators
- Consider volume changes
- Improve risk management:
- Implement dynamic stop-loss
- Add position holding time limits
- Signal optimization:
- Add trend confirmation conditions
- Optimize indicator weights
Summary
The strategy constructs a relatively complete trading system through multi-indicator collaboration. Its core advantage lies in improving signal reliability through cross-validation of different types of indicators, while considering multiple market characteristics including trend, momentum, and capital flow. Although there are some lag risks, the strategy shows good application potential through reasonable parameter optimization and risk management measures. Future improvements can focus on dynamic parameter adjustment and market environment filtering to further enhance strategy stability and profitability.
Source Pine Script
/*backtest
start: 2022-02-09 00:00:00
end: 2025-02-06 08:00:00
period: 1d
basePeriod: 1d
exchanges: [{"eid":"Futures_Binance","currency":"BTC_USDT"}]
*/

// This source code is subject to the terms of the Mozilla Public License 2.0 at https://mozilla.org/MPL/2.0/
// © ahmetkaratas4238

//@version=5
strategy("İzmir Stratejisi", overlay=true)

// **Bollinger Bantları Hesaplamaları**
bbLength = 20
bbMult = 2.0
basis = ta.sma(close, bbLength)
dev = bbMult * ta.stdev(close, bbLength)
upperBand = basis + dev
lowerBand = basis - dev

// **RSI (3,85,15) Hesaplaması**
rsiLength = 3
rsiUpper = 85
rsiLower = 15
rsi = ta.rsi(close, rsiLength)

// **Stochastic (10,3,85,15) Hesaplaması**
stochLength = 10
smoothK = 3
smoothD = 3
stochUpper = 85
stochLower = 15
k = ta.sma(ta.stoch(close, high, low, stochLength), smoothK)
d = ta.sma(k, smoothD)

// **Money Flow Index (MFI) Hesaplaması**
mfiLength = 14
mfi = ta.mfi(close, mfiLength)  // Hata düzeltildi: Artık yalnızca periyot alıyor
mfiTrendUp = ta.ema(mfi, 10) > ta.ema(mfi[1], 10)  // MFI yükseliş trendi
mfiTrendDown = ta.ema(mfi, 10) < ta.ema(mfi[1], 10) // MFI düşüş trendi

// **ALIM ŞARTLARI**
var bbBreakdown=false
var rsiBreakout=false
var stochBreakout=false
bbBreakdown := ta.crossunder(close,lowerBand)?true:bbBreakdown  // Fiyat BB altına sarktı mı?
rsiBreakout := ta.crossover(rsi, rsiLower)?true:rsiBreakout  // RSI 15 seviyesini yukarı kırdı mı?
stochBreakout := ta.crossover(k, stochLower)?true:stochBreakout  // Stochastic alt bandı yukarı kırdı mı?
buyCondition = bbBreakdown and rsiBreakout and stochBreakout and mfiTrendUp

// **SATIM ŞARTLARI**
var bbBreakup=false
var rsiBreakdown=false
var stochBreakdown=false
bbBreakup := ta.crossunder(close, upperBand)?true:bbBreakup  // Fiyat BB üst bandından aşağı kırdı mı?
rsiBreakdown := ta.crossunder(rsi, rsiUpper)?true:rsiBreakdown  // RSI 85 seviyesini aşağı kırdı mı?
stochBreakdown := ta.crossunder(k, stochUpper)?true:stochBreakdown  // Stochastic üst bandı aşağı kırdı mı?
sellCondition = bbBreakup and rsiBreakdown// and stochBreakdown and mfiTrendDown

if ta.crossunder(close,lowerBand)
    bbBreakup:=false
if ta.crossover(rsi, rsiLower)
    rsiBreakdown:=false
if ta.crossover(k, stochLower)
    stochBreakdown:=false

if ta.crossunder(close, upperBand)
    bbBreakdown:=false
if ta.crossunder(rsi, rsiUpper)
    rsiBreakout:=false
if ta.crossunder(k, stochUpper)
    stochBreakout:=false

// **Alım İşlemi Aç**
if buyCondition
    strategy.entry("Long", strategy.long)

// **Satım İşlemi Yap (Pozisyon Kapat)**
if sellCondition
    strategy.close("Long")

// **Bollinger Bantlarını Göster**
plot(upperBand, title="Üst BB", color=color.red)
plot(lowerBand, title="Alt BB", color=color.green)
plot(basis, title="Orta BB", color=color.blue)

// **Alım ve Satım Sinyallerini İşaretle**
plotshape(series=buyCondition, location=location.belowbar, color=color.green, style=shape.labelup, title="AL")
plotshape(series=sellCondition, location=location.abovebar, color=color.red, style=shape.labeldown, title="SAT")
Published by ChaoZhang on the FMZ strategy square · last modified 2025-02-08. Collected in the Quant Trading Vault. Unvalidated research: re-test with your own data and costs before trusting it.
Build this with AgenKit
A spec is not a trading system. Paste this into your coding agent and AgenKit runs a specialist team — architecture, test-first build, risk gates, review — with paper trading on by default.
/agenkit build a production-grade trading bot with a backtest engine, risk controls and paper trading by default from strategies/Multi-Indicator-Trend-Divergence-Quantitative-Trading-Strategy.md- npx agenkit install engineering-kit in your project
- Paste the command into your agent and approve each phase
- Get tests, backtest, risk controls and a paper-trading switch
Understand it first
Before you run this, read the lesson behind the idea and how to backtest it honestly. Specs like this one are the survivors of an unknown number of trials; deflate their results accordingly.
Related specs
- Multi Technical Indicator Moving Average Crossover Trend Following Quantitative Trading StrategyPine Script · Trend following · 1h
- Triple SuperTrend Quantitative Trading StrategyPine Script · Trend following · 1d
- Trend Following Strategy Based on Multiple IndicatorsPine Script · Trend following · 2h
- SuperTrend Trading Strategy with Multiple FiltersPine Script · Trend following · 1h
- Bollinger Bands and RSI Trend Following StrategyPine Script · Trend following · 1h
- EMA AROON ASHPine Script · Trend following · 3m