Multi Indicator Trend Following and Volatility Breakout Strategy
This is a comprehensive trading strategy that combines trend following and volatility breakout approaches using multiple technical indicators. The strategy integrates an EMA system, ADX for trend strength, ATR for…
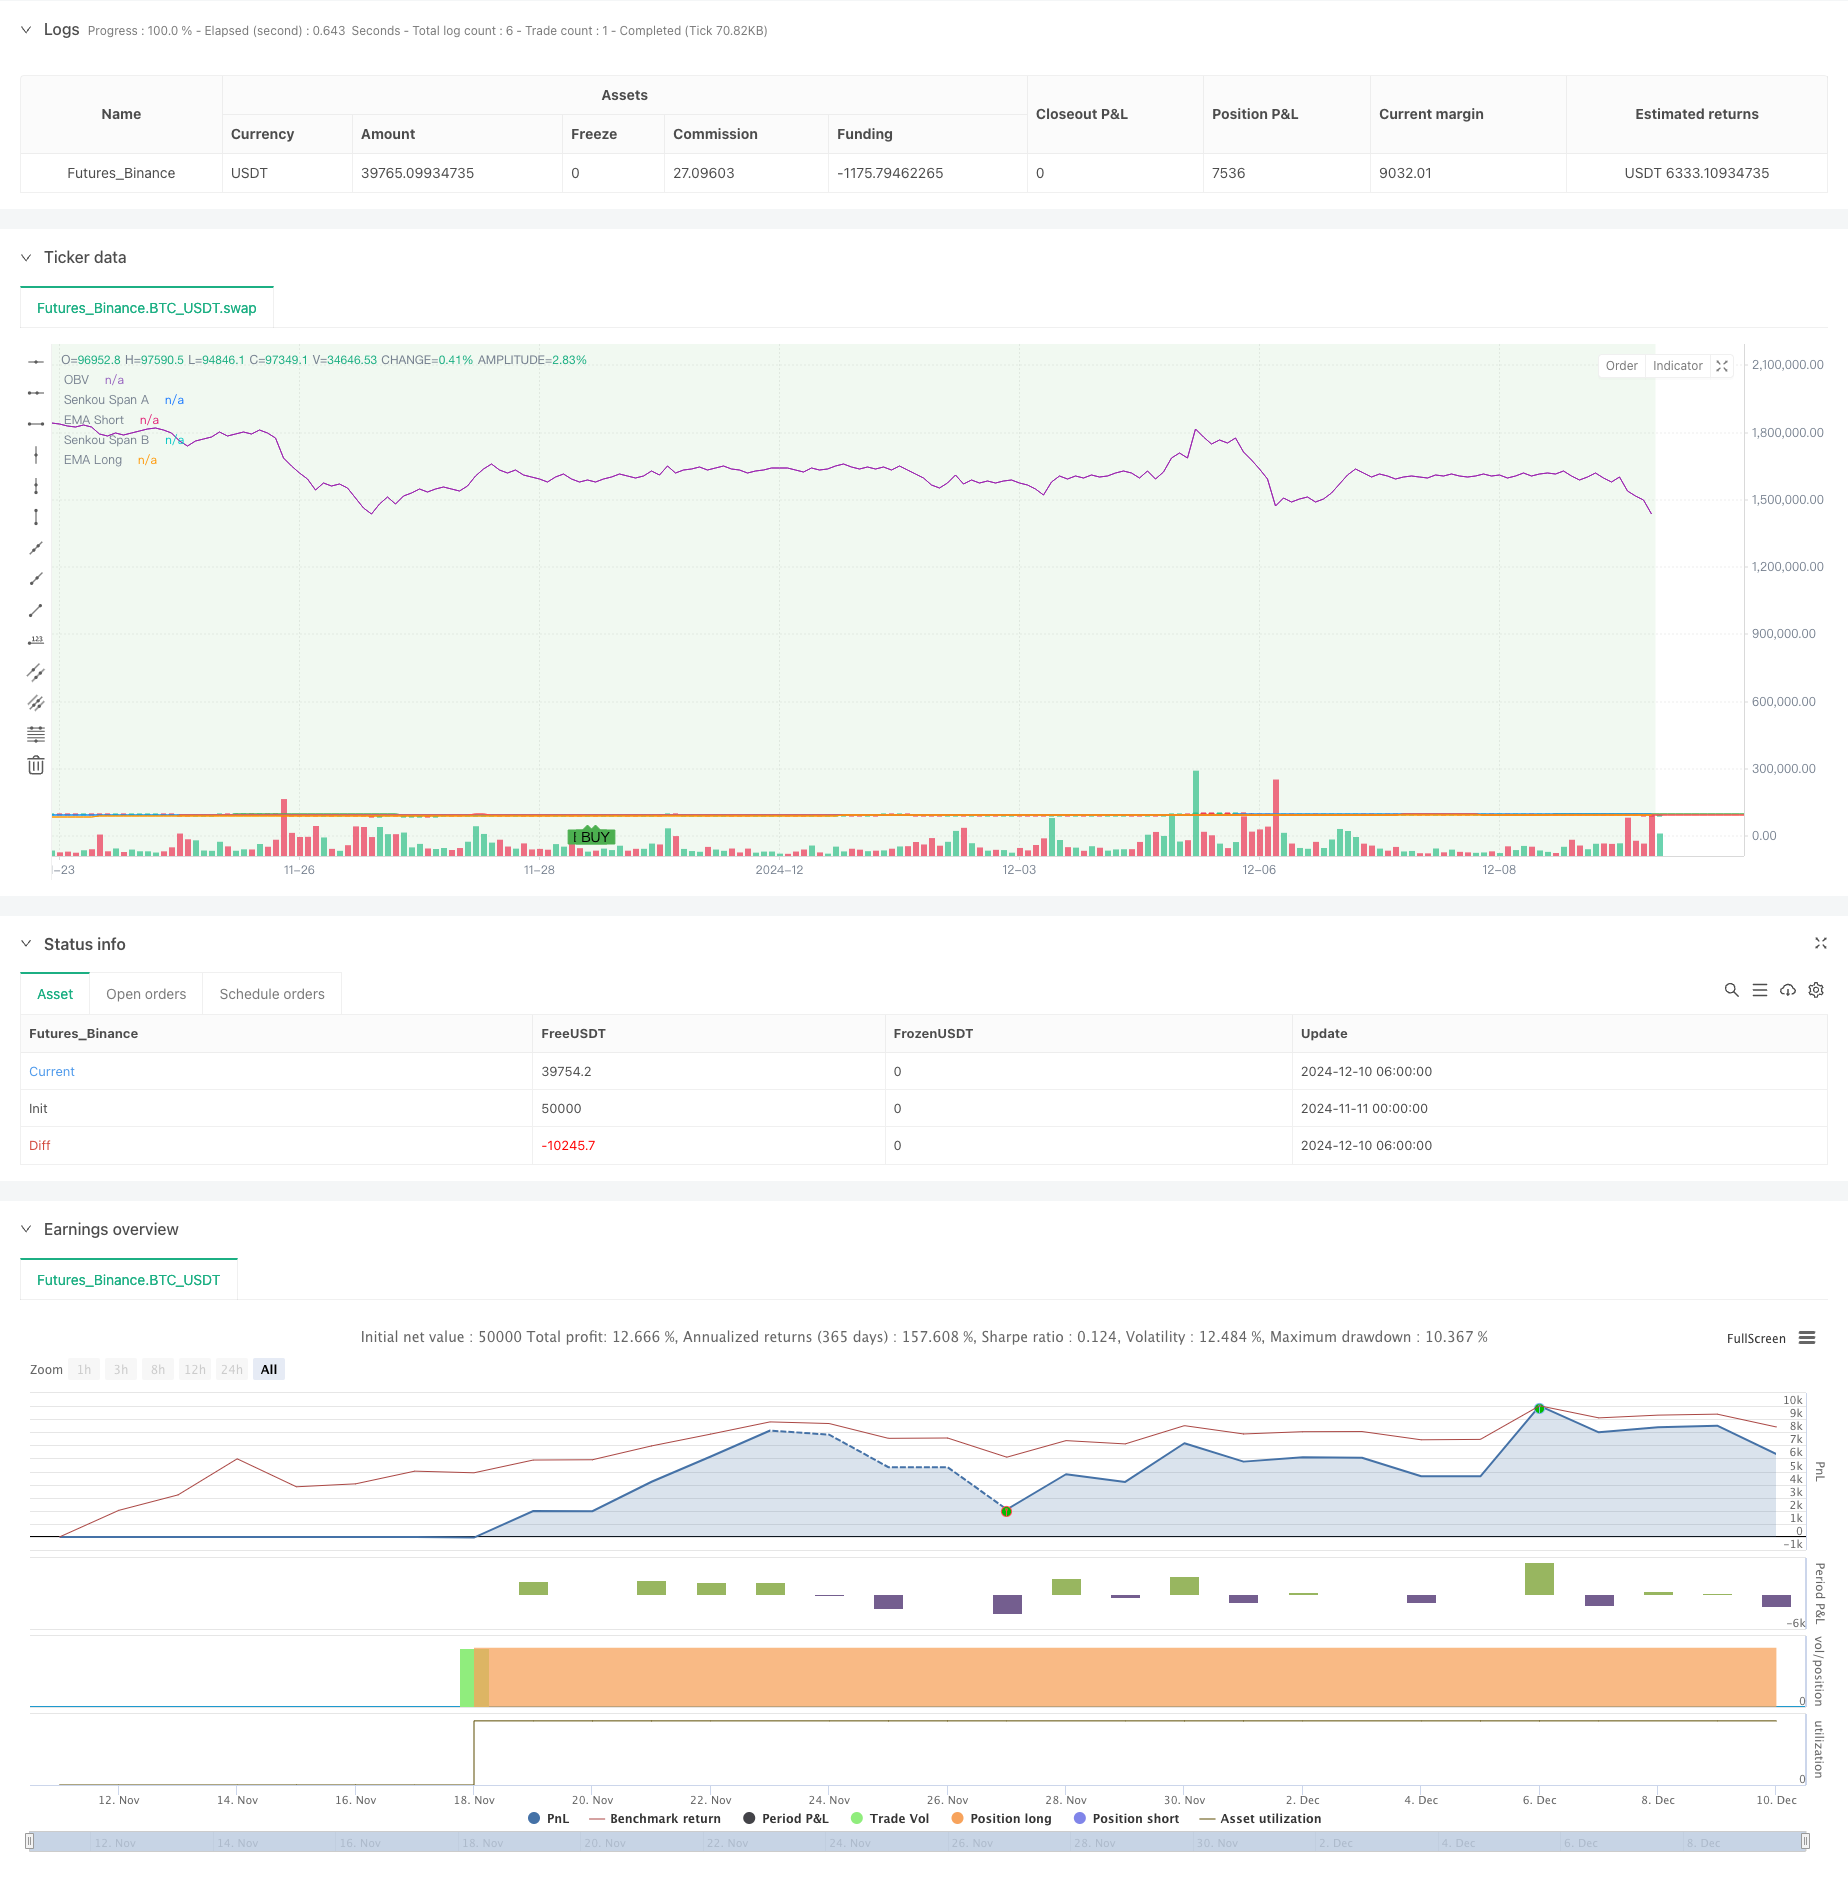
Overview
This is a comprehensive trading strategy that combines trend following and volatility breakout approaches using multiple technical indicators. The strategy integrates an EMA system, ADX for trend strength, ATR for volatility measurement, OBV for volume analysis, and supplementary indicators like Ichimoku Cloud and Stochastic oscillator to capture market trends and breakout opportunities. A time filter is implemented to optimize trading efficiency by operating only during specific trading hours.
Strategy Principle
The core logic is based on multi-layer technical analysis:
- Trend following system using 50 and 200 period EMAs
- Trend strength confirmation through ADX
- Additional trend validation using Ichimoku Cloud
- Overbought/oversold identification with Stochastic oscillator
- Dynamic stop-loss and profit targets using ATR
- Volume confirmation through OBV
Buy signals are generated when:
- Within allowed trading hours
- Price above short-term EMA
- Short-term EMA above long-term EMA
- ADX above threshold
- Price above Ichimoku Cloud
- Stochastic in oversold territory
Strategy Advantages
- Multiple indicator cross-validation improves signal reliability
- Combination of trend following and volatility breakout increases adaptability
- Time filter avoids inefficient trading periods
- Dynamic stop-loss and profit targets adapt to market volatility
- Integrated volume-price analysis provides comprehensive market view
- Systematic entry/exit rules reduce subjective judgment
Strategy Risks
- Multiple indicators may lead to lagging signals
- False signals in ranging markets
- Complex parameter optimization with overfitting risks
- Time restrictions may miss important market moves
- Wide stops may result in larger individual losses
Risk control suggestions:
- Regular parameter optimization review
- Consider adding volatility filters
- Implement stricter money management rules
- Add supplementary trend confirmation indicators
Strategy Optimization Directions
- Introduce adaptive parameter system for dynamic indicator adjustment
- Add market regime classification for different signal generation rules
- Optimize time filter based on historical data analysis
- Improve stop-loss strategy with trailing stops
- Incorporate market sentiment indicators for signal quality enhancement
Summary
The strategy constructs a complete trading system through the comprehensive application of multiple technical indicators. Its strengths lie in multi-layer indicator cross-validation and strict risk control, while facing challenges in parameter optimization and signal lag. Through continuous optimization and improvement, the strategy shows potential for stable performance across different market conditions.
Source Pine Script
/*backtest
start: 2024-11-11 00:00:00
end: 2024-12-10 08:00:00
period: 2h
basePeriod: 2h
exchanges: [{"eid":"Futures_Binance","currency":"BTC_USDT"}]
*/

//@version=5
strategy("Khaleq Strategy Pro - Fixed Version", overlay=true)

// === Input Settings ===
ema_short = input.int(50, "EMA Short", minval=1)
ema_long = input.int(200, "EMA Long", minval=1)
adx_threshold = input.int(25, "ADX Threshold", minval=1)
atr_multiplier = input.float(2.0, "ATR Multiplier", minval=0.1)
time_filter_start = input(timestamp("0000-01-01 09:00:00"), "Trading Start Time", group="Time Filter")
time_filter_end = input(timestamp("0000-01-01 17:00:00"), "Trading End Time", group="Time Filter")

// === Ichimoku Settings ===
tenkan_len = 9
kijun_len = 26
senkou_span_b_len = 52
displacement = 26

// === Calculations ===
// Ichimoku Components
tenkan_sen = (ta.highest(high, tenkan_len) + ta.lowest(low, tenkan_len)) / 2
kijun_sen = (ta.highest(high, kijun_len) + ta.lowest(low, kijun_len)) / 2
senkou_span_a = (tenkan_sen + kijun_sen) / 2
senkou_span_b = (ta.highest(high, senkou_span_b_len) + ta.lowest(low, senkou_span_b_len)) / 2

// EMA Calculations
ema_short_val = ta.ema(close, ema_short)
ema_long_val = ta.ema(close, ema_long)

// Manual ADX Calculation
length = 14
dm_plus = math.max(ta.change(high), 0)
dm_minus = math.max(-ta.change(low), 0)
tr = math.max(high - low, math.max(math.abs(high - close[1]), math.abs(low - close[1])))
tr14 = ta.sma(tr, length)
dm_plus14 = ta.sma(dm_plus, length)
dm_minus14 = ta.sma(dm_minus, length)
di_plus = (dm_plus14 / tr14) * 100
di_minus = (dm_minus14 / tr14) * 100
dx = math.abs(di_plus - di_minus) / (di_plus + di_minus) * 100
adx_val = ta.sma(dx, length)

// ATR Calculation
atr_val = ta.atr(14)

// Stochastic RSI Calculation
k = ta.stoch(close, high, low, 14)
d = ta.sma(k, 3)

// Time Filter
is_within_time = true

// Support and Resistance (High and Low Levels)
resistance_level = ta.highest(high, 20)
support_level = ta.lowest(low, 20)

// Volume Analysis (On-Balance Volume)
vol_change = ta.change(close)
obv = ta.cum(vol_change > 0 ? volume : vol_change < 0 ? -volume : 0)

// === Signal Conditions ===
buy_signal = is_within_time and
             (close > ema_short_val) and
             (ema_short_val > ema_long_val) and
             (adx_val > adx_threshold) and
             (close > senkou_span_a) and
             (k < 20)  // Stochastic oversold

sell_signal = is_within_time and
              (close < ema_short_val) and
              (ema_short_val < ema_long_val) and
              (adx_val > adx_threshold) and
              (close < senkou_span_b) and
              (k > 80)  // Stochastic overbought

// === Plotting ===
// Plot Buy and Sell Signals
plotshape(buy_signal, color=color.green, style=shape.labelup, title="Buy Signal", location=location.belowbar, text="BUY")
plotshape(sell_signal, color=color.red, style=shape.labeldown, title="Sell Signal", location=location.abovebar, text="SELL")

// Plot EMAs
plot(ema_short_val, color=color.blue, title="EMA Short")
plot(ema_long_val, color=color.orange, title="EMA Long")

// Plot Ichimoku Components
plot(senkou_span_a, color=color.green, title="Senkou Span A", offset=displacement)
plot(senkou_span_b, color=color.red, title="Senkou Span B", offset=displacement)

// // Plot Support and Resistance using lines
// var line resistance_line = na
// var line support_line = na
// if bar_index > 1
//     line.delete(resistance_line)
//     line.delete(support_line)
// resistance_line := line.new(x1=bar_index - 1, y1=resistance_level, x2=bar_index, y2=resistance_level, color=color.red, width=1, style=line.style_dotted)
// support_line := line.new(x1=bar_index - 1, y1=support_level, x2=bar_index, y2=support_level, color=color.green, width=1, style=line.style_dotted)

// Plot OBV
plot(obv, color=color.purple, title="OBV")

// Plot Background for Trend (Bullish/Bearish)
bgcolor(close > ema_long_val ? color.new(color.green, 90) : color.new(color.red, 90), title="Trend Background")

// === Alerts ===
alertcondition(buy_signal, title="Buy Alert", message="Buy Signal Triggered")
alertcondition(sell_signal, title="Sell Alert", message="Sell Signal Triggered")

// === Strategy Execution ===
if buy_signal
    strategy.entry("Buy", strategy.long)

if sell_signal
    strategy.close("Buy")
    strategy.exit("Sell", "Buy", stop=close - atr_multiplier * atr_val, limit=close + atr_multiplier * atr_val)
Published by ChaoZhang on the FMZ strategy square · last modified 2024-12-12. Collected in the Quant Trading Vault. Unvalidated research: re-test with your own data and costs before trusting it.
Build this with AgenKit
A spec is not a trading system. Paste this into your coding agent and AgenKit runs a specialist team — architecture, test-first build, risk gates, review — with paper trading on by default.
/agenkit build a production-grade trading bot with a backtest engine, risk controls and paper trading by default from strategies/Multi-Indicator-Trend-Following-and-Volatility-Breakout-Strategy.md- npx agenkit install engineering-kit in your project
- Paste the command into your agent and approve each phase
- Get tests, backtest, risk controls and a paper-trading switch
Understand it first
Before you run this, read the lesson behind the idea and how to backtest it honestly. Specs like this one are the survivors of an unknown number of trials; deflate their results accordingly.
Related specs
- Quantitative Trading Strategy Based on Ichimoku with Multiple SignalsPine Script · Breakout · 1h
- Multi Strategy Adaptive Trend Following and Breakout Trading SystemPine Script · Breakout · 1d
- Momentum Breakout Intraday Trading StrategyPine Script · Breakout · 5m
- Moving Average Crossover and Upper Rail Breakthrough Impulse StrategyPine Script · Breakout · 1m
- Multi Filter Trend Breakthrough Smart Moving Average Trading StrategyPine Script · Breakout · 1h
- Pivot Based Volume Weighted Breakout Reversal StrategyPine Script · Breakout · 1d