Multi Layer Dynamic Threshold RMA Trading Strategy Trend and Momentum Synergy Optimization
The Multi-Layer Dynamic Threshold RMA Trading Strategy is an advanced trading approach based on a three-layered Running Moving Average (RMA) system that precisely identifies market trend directions and…
Overview
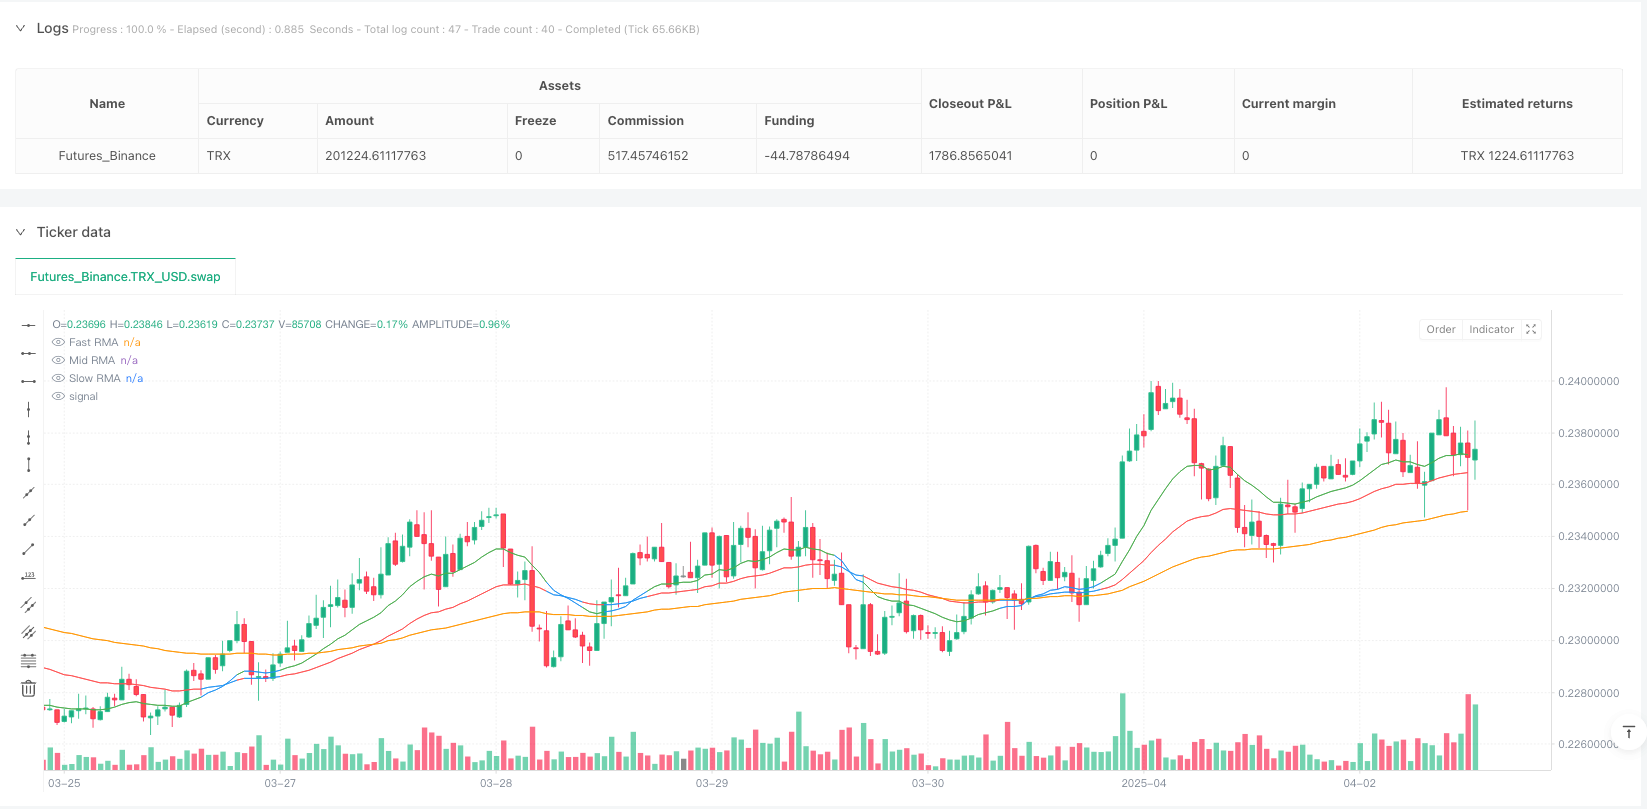
The Multi-Layer Dynamic Threshold RMA Trading Strategy is an advanced trading approach based on a three-layered Running Moving Average (RMA) system that precisely identifies market trend directions and high-probability trading opportunities by combining Relative Strength Index (RSI) and candle structure analysis. The strategy's core consists of three different period RMA lines: Fast RMA (capturing short-term momentum), Mid RMA (filtering market noise), and Slow RMA (representing overall market structure). The strategy forms a complete trading signal system by analyzing RMA stack direction, RSI momentum confirmation, candle breakouts, and price rejection patterns. Its uniqueness lies in dynamically adjusting trend thresholds according to different market types (Forex, Cryptocurrency, Gold), optimizing performance across various market environments.
Strategy Principles
The core principles of this strategy are built on multi-level trend identification and momentum confirmation:
RMA Stack Structure Analysis: The strategy calculates three RMAs with different periods (Fast 9, Mid 21, Slow 50) and analyzes their relative positions. When Fast RMA > Mid RMA > Slow RMA, it identifies a bullish structure; when Fast RMA < Mid RMA < Slow RMA, it identifies a bearish structure.
Dynamic Trend Strength Assessment: The strategy calculates the percentage distance between Fast RMA and Mid RMA, setting different thresholds for different market types (Forex 0.12%, Gold 0.15%, Crypto 0.25%) to determine if the market is in a strong trend.
RSI Momentum Filtering: Using an 8-period RSI indicator as a momentum confirmation tool, long signals require RSI>50, while short signals require RSI<50, avoiding counter-trend trading.
Price Structure Confirmation: By analyzing whether the current closing price breaks the previous candle's high (long) or low (short), increasing signal reliability.
Comprehensive Entry Condition Assessment:
- Long entry: Bullish RMA structure + Close crossing above Mid RMA + RSI>50 + Close breaking previous high
- Short entry: Bearish RMA structure + Close crossing below Mid RMA + RSI<50 + Close breaking previous low
Take Profit and Stop Loss Strategy: Using Slow RMA as the take profit target and setting stop loss prices based on user-defined points for risk control.
Strategy Advantages
Adaptive Market Environment: By setting specific trend threshold parameters for different asset classes (Forex, Gold, Cryptocurrency), the strategy can adapt to the volatility characteristics of different markets, enhancing adaptability.
Multi-Level Confirmation Mechanism: Combining confirmations from three dimensions-trend direction (RMA stacking), price momentum (RSI), and price structure (candle breakouts)-significantly increases signal reliability and reduces false signal risks.
Dynamic Trend Strength Identification: By calculating the percentage distance between RMA lines, the strategy can dynamically evaluate trend strength and visually reflect it through color changes (Fast RMA green, Mid RMA red during strong trends; both blue during weak trends), helping traders intuitively judge market conditions.
Precise Entry Points: The strategy relies not only on indicator crossovers but also on price structure confirmation, ensuring entry at the early stages of trend establishment, improving risk-reward ratios.
Structured Take Profit and Stop Loss: Using Slow RMA as a natural take profit position demonstrates respect for market structure, rather than arbitrarily set target prices.
Strategy Risks
Trend Reversal Point Risk: During sudden trend reversals, the strategy may fail to capture turning points promptly, leading to drawdowns. It is recommended to pause using this strategy during extreme market conditions (such as after major news releases) or enhance protection mechanisms by incorporating volatility filters.
Parameter Optimization Trap: Excessive optimization of RMA periods and RSI parameters may lead to curve-fitting, reducing strategy performance in future markets. Parameters should be regularly backtested for robustness across different timeframes and market conditions.
Fixed Stop Loss Risk: The current strategy uses fixed points as stop losses, which may not be flexible enough when volatility changes. It is recommended to redesign the stop loss as a dynamic stop based on ATR (Average True Range) to better adapt to changes in market volatility.
False Breakout Risk: Candle breakout conditions may produce false signals in consolidating markets. Consider adding volume confirmation or waiting for retest confirmation after the breakout to improve signal quality.
Market Type Misjudgment: Incorrectly selecting market type parameters (such as using cryptocurrency parameters for low-volatility forex pairs) may lead to overtrading. An automatic market type recognition mechanism is recommended, dynamically adjusting thresholds based on volatility.
Optimization Directions
Adaptive Parameter Optimization: Change fixed RMA period and RSI period parameters to adaptive parameters based on market volatility. For example, use longer parameters during low volatility periods to reduce noise and shorter parameters during high volatility periods to improve response speed. This can be implemented using an ATR-based automatic adjustment mechanism.
Integrate Volume Analysis: The current strategy relies solely on price data; volume indicators can be added as an additional confirmation dimension. Especially when confirming breakout signals, combining volume breakouts can significantly improve signal quality.
Multi-Timeframe Analysis: Introduce trend confirmation from higher timeframes to ensure trading direction aligns with the larger trend. For example, look for long opportunities on 4-hour charts during an uptrend on the daily chart, avoiding counter-trend trading.
Machine Learning Enhancement: Utilize machine learning algorithms to dynamically optimize trend thresholds under different market conditions, replacing the current manual market type selection method. This can be achieved by using classification algorithms to identify the current market state and then applying the optimal parameter combination.
Advanced Risk Management: Implement volatility-based position sizing and dynamic stop loss mechanisms, such as using closing price stops during breakout phases and trailing stops during trend phases. Additionally, maximum drawdown controls and daily risk limits can be added to improve capital management.
Summary
The Multi-Layer Dynamic Threshold RMA Trading Strategy integrates a three-layer RMA system, RSI momentum filtering, and price structure analysis to create a comprehensive framework for trend following and reversal identification. The strategy's core advantages lie in its adaptability and multi-level confirmation mechanisms, enabling it to operate effectively across different market environments. By dynamically adjusting trend thresholds for different asset classes, the strategy can adapt to the unique characteristics of various markets.
The strategy provides clear visual feedback and a structured trading decision process, particularly suitable for medium to long-term trend traders. While there are some risks, such as trend reversal point risk and parameter optimization traps, the suggested optimization directions-including adaptive parameters, multi-timeframe analysis, and machine learning enhancements-can further improve the strategy's robustness and profitability.
Most importantly, this strategy is not just a trading system but a market analysis method that helps traders understand market structure and dynamics. Through continuous improvement and personalized adjustments, it can become a powerful tool for various market participants, achieving long-term stable trading performance.
Source Pine Script
/*backtest
start: 2025-03-17 00:00:00
end: 2025-04-03 00:00:00
period: 1h
basePeriod: 1h
exchanges: [{"eid":"Futures_Binance","currency":"TRX_USD"}]
*/

//@version=5
strategy("RMA Strategy - Weekly Dynamic Thresholds", overlay=true, default_qty_type=strategy.percent_of_equity, default_qty_value=100)

// === User Inputs ===
fastLen = input.int(9, title="Fast RMA")
midLen = input.int(21, title="Mid RMA")
slowLen = input.int(50, title="Slow RMA")
rsiLen = input.int(8, title="RSI Length")
slPoints = input.float(10, title="Stop Loss (Points)")

// === Weekly Threshold Inputs ===
forexThreshold = input.float(0.12, title="Forex Weekly Avg RMA Distance (%)", step=0.01)
goldThreshold = input.float(0.15, title="Gold Weekly Avg RMA Distance (%)", step=0.01)
cryptoThreshold = input.float(0.25, title="Crypto Weekly Avg RMA Distance (%)", step=0.01)

// === Select Current Market Type ===
marketType = input.string("FOREX", title="Asset Class", options=["FOREX", "GOLD", "CRYPTO"])

// === Use appropriate threshold based on selected market
weeklyThreshold = marketType == "FOREX" ? forexThreshold :
                  marketType == "GOLD" ? goldThreshold :
                  cryptoThreshold  // Default to crypto if somehow not matched

// === RMA Calculations ===
fastRMA = ta.rma(close, fastLen)
midRMA = ta.rma(close, midLen)
slowRMA = ta.rma(close, slowLen)

// === RSI Calculation ===
rsi = ta.rsi(close, rsiLen)

// === Trend Structure ===
bullish = fastRMA > midRMA and midRMA > slowRMA
bearish = fastRMA < midRMA and midRMA < slowRMA

// === Candle Break Conditions ===
longCandleBreak = close > high[1]
shortCandleBreak = close < low[1]

// === Distance and Trend Strength Check ===
distance = math.abs(fastRMA - midRMA)
distancePct = distance / midRMA * 100
isTrending = distancePct >= weeklyThreshold

// === Entry Conditions ===
longSignal = bullish and ta.crossover(close, midRMA) and rsi > 50 and longCandleBreak
shortSignal = bearish and ta.crossunder(close, midRMA) and rsi < 50 and shortCandleBreak

// === TP and SL Setup ===
takeProfitPriceLong = slowRMA
stopLossPriceLong = close - slPoints * syminfo.mintick

takeProfitPriceShort = slowRMA
stopLossPriceShort = close + slPoints * syminfo.mintick

// === Trade Execution ===
if (longSignal)
    strategy.entry("Long", strategy.long)
    strategy.exit("TP/SL Long", from_entry="Long", limit=takeProfitPriceLong, stop=stopLossPriceLong)

if (shortSignal)
    strategy.entry("Short", strategy.short)
    strategy.exit("TP/SL Short", from_entry="Short", limit=takeProfitPriceShort, stop=stopLossPriceShort)

// === Highlight RMAs Based on Trending Strength ===
fastColor = isTrending ? color.green : color.blue
midColor = isTrending ? color.red : color.blue
slowColor = color.orange

// === Plot RMAs ===
plot(fastRMA, color=fastColor, title="Fast RMA")
plot(midRMA, color=midColor, title="Mid RMA")
plot(slowRMA, color=slowColor, title="Slow RMA")
Published by ianzeng123 on the FMZ strategy square · last modified 2025-04-17. Collected in the Quant Trading Vault. Unvalidated research: re-test with your own data and costs before trusting it.
Build this with AgenKit
A spec is not a trading system. Paste this into your coding agent and AgenKit runs a specialist team — architecture, test-first build, risk gates, review — with paper trading on by default.
/agenkit build a production-grade trading bot with a backtest engine, risk controls and paper trading by default from strategies/Multi-Layer-Dynamic-Threshold-RMA-Trading-Strategy-Trend-and-Momentum-Synergy-Optimization.md- npx agenkit install engineering-kit in your project
- Paste the command into your agent and approve each phase
- Get tests, backtest, risk controls and a paper-trading switch
Understand it first
Before you run this, read the lesson behind the idea and how to backtest it honestly. Specs like this one are the survivors of an unknown number of trials; deflate their results accordingly.
Related specs
- ADX Momentum Trend StrategyPine Script · Momentum · 10m
- Advanced Multi Indicator Trend Following and Momentum Quantitative Trading StrategyPine Script · Momentum · 1h
- Bollinger Bands Momentum Trend Following Quantitative StrategyPine Script · Momentum · 1d
- Cross Momentum Trend Following Strategy SMA RSI Cross Momentum SystemPine Script · Momentum · 1h
- Cross Period Momentum EMA Strategy with RSI and Dynamic ATR Stop LossPine Script · Momentum · 1d
- Dual EMA Crossover with RSI Momentum Enhanced Trading StrategyPine Script · Momentum · 1d