Strategy vault / Trend following
Multi Moving Average Crossover Trend Following Strategy with Volatility Filter
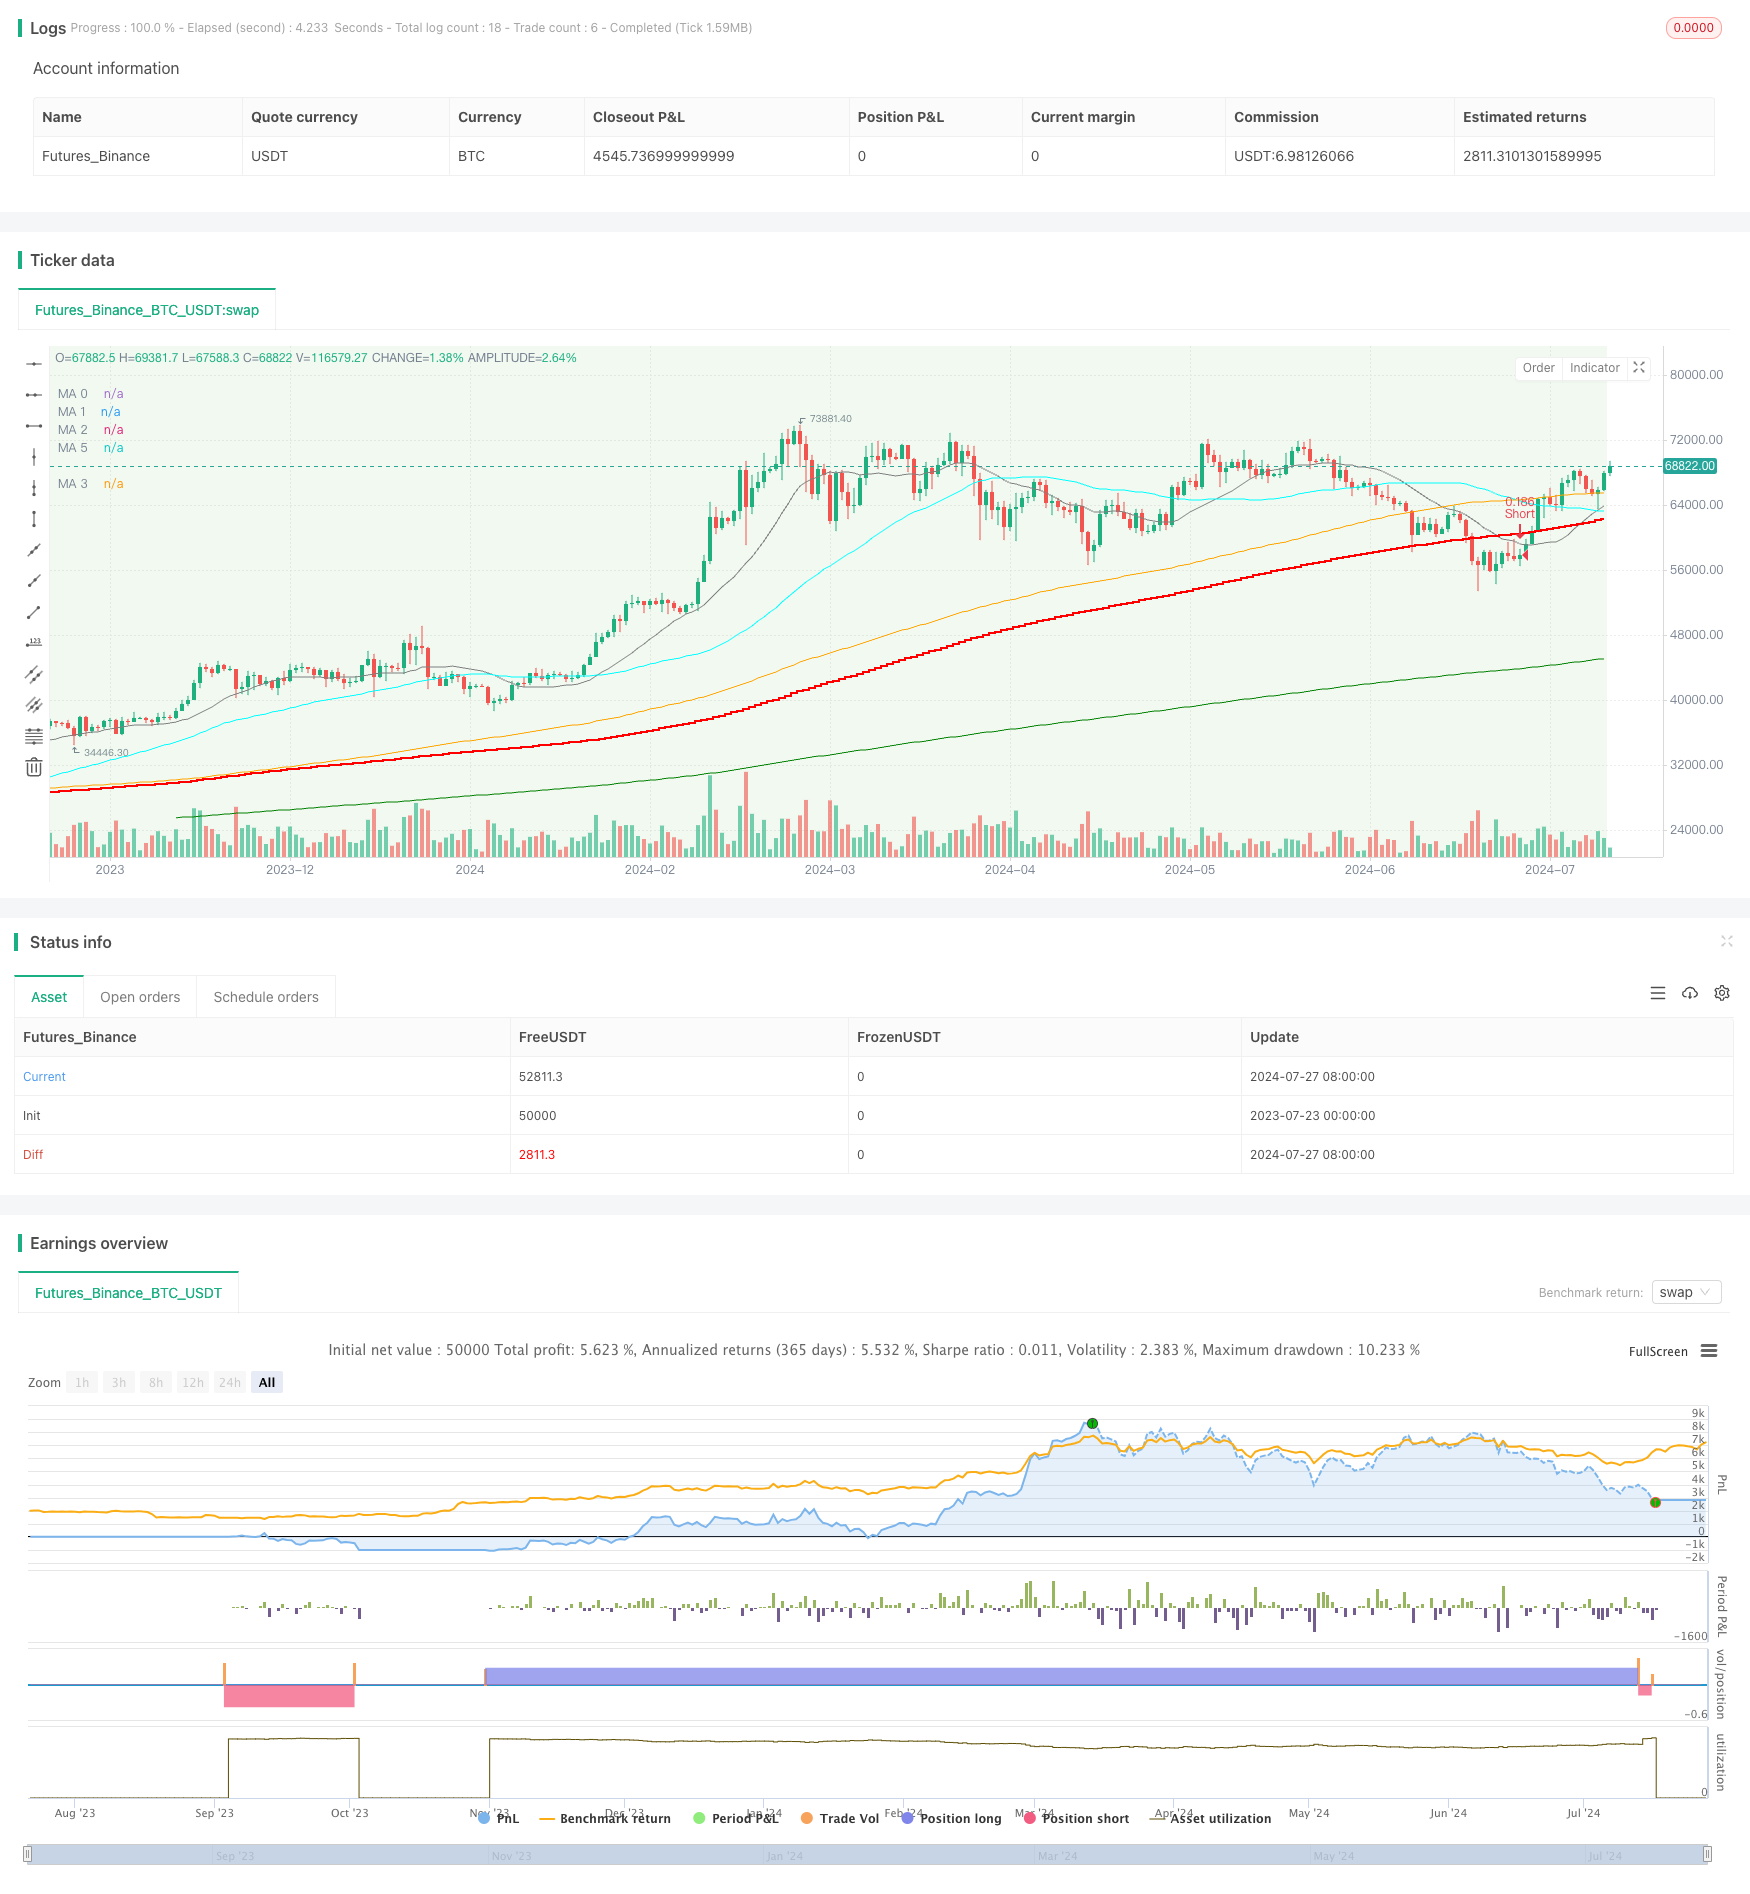
This strategy is a trend-following trading system based on multiple moving average crossovers and volatility filtering. It utilizes three moving averages of different periods to identify market trends and uses a…
Overview
This strategy is a trend-following trading system based on multiple moving average crossovers and volatility filtering. It utilizes three moving averages of different periods to identify market trends and uses a fourth moving average as a benchmark for bull/bear market determination. The strategy also incorporates a volatility indicator as a trading filter to avoid trading in low volatility environments. It supports both long and short positions and provides flexible position management and stop-loss mechanisms.
Strategy Principles
Moving Average Selection: The strategy uses three main moving averages (short-term, medium-term, and long-term) to determine trends. Users can choose from six predefined moving averages, each of which can be individually configured with parameters including calculation period, data source, and type (e.g., SMA, EMA).
Trend Determination:
- Bullish Trend: When the short-term MA is above the long-term MA, and the medium-term MA crosses above the long-term MA.
- Bearish Trend: When the short-term MA is below the long-term MA, and the medium-term MA crosses below the long-term MA.
Bull/Bear Market Determination: An optional fourth moving average can be used as a dividing line for bull and bear markets. Only long positions are allowed when the price is above this line, and only short positions when below.
Volatility Filter: A volatility indicator based on highest and lowest prices is used. The strategy only generates trading signals when volatility exceeds a user-defined threshold.
Entry Logic:
- Long Entry: Enter a long position when a bullish trend is confirmed, volatility conditions are met, and the price is above the long-term MA.
- Short Entry: Enter a short position when a bearish trend is confirmed, volatility conditions are met, and the price is below the long-term MA.
Exit Logic:
- Partial Exit: Close a certain percentage of the position when the trend reverses (medium-term MA crosses the long-term MA again).
- Full Exit: Close all positions in the opposite direction when the price crosses the bull/bear market dividing line.
Stop Loss: Uses a fixed percentage stop loss, which can be customized by the user.
Position Management: Uses a fixed percentage of account equity for each trade, which can be customized by the user.
Strategy Advantages
Multi-dimensional Trend Analysis: By using multiple moving averages, the strategy can capture market trends more comprehensively, reducing false signals.
Flexible Parameter Configuration: Users can adjust various parameters flexibly according to the characteristics of different markets and trading instruments, including MA type, period, and data source.
Volatility Filtering: By incorporating a volatility indicator, the strategy can avoid trading in low volatility environments, improving signal quality.
Bull/Bear Market Adaptation: The optional bull/bear market determination mechanism allows the strategy to better adapt to different market environments, reducing counter-trend trades.
Dynamic Position Management: The equity-based position management method automatically adjusts trading size as the account size changes.
Multi-layered Risk Control: Includes multiple risk control mechanisms such as volatility filtering, trend confirmation, partial position closure, and fixed stop loss.
Bi-directional Trading: Supports both long and short positions, allowing for trading opportunities in various market conditions.
Visual Aids: The strategy plots various moving averages and trade signal labels on the chart, facilitating intuitive analysis and backtesting.
Strategy Risks
Lagging Nature: Moving averages are inherently lagging indicators, which may lead to slightly delayed entry and exit timing, affecting profitability.
Poor Performance in Ranging Markets: In sideways, choppy markets, the strategy may generate frequent false signals, leading to overtrading and losses.
Parameter Sensitivity: The strategy's performance is highly dependent on parameter settings, and different markets and timeframes may require different parameter combinations.
Drawdown Risk: During trend reversals, the strategy may not exit positions entirely in a timely manner, potentially leading to significant drawdowns.
Over-reliance on Technical Indicators: The strategy is entirely based on technical indicators, ignoring fundamental factors, which may lead to poor performance during major news or events.
Money Management Risk: The fixed percentage position sizing method may result in excessive risk exposure during consecutive losses.
Stop Loss Setting: The fixed percentage stop loss may not be suitable for all market environments and could lead to premature exits during high volatility periods.
Strategy Optimization Directions
Adaptive Parameters: Introduce adaptive mechanisms to dynamically adjust moving average parameters and volatility thresholds based on market conditions.
Multi-timeframe Analysis: Incorporate information from longer and shorter timeframes to improve trend determination accuracy.
Volatility Indicator Optimization: Consider using more sophisticated volatility indicators such as ATR or Bollinger Bandwidth for more accurate market condition assessment.
Momentum Indicator Integration: Combine momentum indicators like RSI or MACD to optimize entry and exit timing.
Improved Stop Loss Mechanism: Implement trailing stops or ATR-based dynamic stop losses to better adapt to market volatility.
Market Sentiment Integration: Incorporate market sentiment indicators like VIX to optimize strategy performance in different market environments.
Position Management Optimization: Implement dynamic position sizing based on volatility or current profit/loss for better risk control.
Fundamental Filter Addition: Consider fundamental factors such as important economic data releases or company earnings reports to avoid trading during high-risk periods.
Machine Learning Optimization: Use machine learning algorithms to optimize parameter combinations and decision rules, improving strategy adaptability.
Backtesting and Forward Testing: Conduct more comprehensive backtesting and forward testing in different markets and time periods to verify strategy robustness.
Conclusion
The Multi-Moving Average Crossover Trend Following Strategy with Volatility Filter is a comprehensive and flexible trading system that combines multiple moving averages, volatility indicators, and trend-following principles. Through multi-dimensional trend analysis and strict risk control, the strategy has the potential to capture persistent trends in various market environments. However, users need to pay attention to parameter optimization and market adaptability issues, and consider introducing more advanced technical indicators and risk management techniques to further enhance strategy performance. Overall, this is a solid strategy framework that provides a good foundation for further research and optimization.
Source Pine Script
/*backtest
start: 2023-07-23 00:00:00
end: 2024-07-28 00:00:00
period: 1d
basePeriod: 1h
exchanges: [{"eid":"Futures_Binance","currency":"BTC_USDT"}]
*/

//@version=5
strategy(title="WODIsMA Strategy", shorttitle="WMA_Strategy", overlay=true, overlay=true, pyramiding=2, default_qty_value=6, default_qty_type=strategy.fixed, initial_capital=1000, currency=currency.USD)

// User input parameters
capital_pct = input.float(20, title="Percentage of funds used per order(%)", minval=0.1, maxval=100, group="Position") / 100
close_pct = input.float(20, title="Percentage used for each closing(%)", minval=0, maxval=100, group="Position") / 100
stop_loss_user = input.float(10, title="Stop Loss Percentage(%)", minval=0, maxval=100, group="Position") / 100
allow_long = input.bool(true, title="Whether to go long", group="Position")
allow_short = input.bool(true, title="Whether to short", group="Position")

// User-selected moving average
short_term_ma = input.string("MA 0", title="Short-term trend moving average", options=["MA 0", "MA 1", "MA 2", "MA 3", "MA 4", "MA 5"], group="TrendIdentify")
mid_term_ma = input.string("MA 1", title="Medium-term trend moving average", options=["MA 0", "MA 1", "MA 2", "MA 3", "MA 4", "MA 5"], group="TrendIdentify")
long_term_ma = input.string("MA 2", title="Long-term trend moving average", options=["MA 0", "MA 1", "MA 2", "MA 3", "MA 4", "MA 5"], group="TrendIdentify")
bull_bear_ma = input.string("MA 3", title="Bull-bear trend moving average", options=["MA 0", "MA 1", "MA 2", "MA 3", "MA 4", "MA 5"], group="TrendIdentify")
enable_bull_bear = input.bool(false, title="Whether to enable bull-bear trendline", group="TrendIdentify")
// Volatility indicator parameters
volatility_k = input.int(60, title="Volatility valueKNumber of Lines" , group="volatility")
volatility_threshold = input.float(1, minval=0, title="Volatility value 0Do not use(%)", group="volatility")

// Define different types of moving average functions
ma(source, length, type) =>
    switch type
        "SMA" => ta.sma(source, length)
        "EMA" => ta.ema(source, length)
        "SMMA (RMA)" => ta.rma(source, length)
        "WMA" => ta.wma(source, length)
        "VWMA" => ta.vwma(source, length)

// Define the input parameters and color of each moving average
length0 = input.int(16, minval=1, title="Length 0", group="MA 0")
source0 = input.source(hl2, title="Source 0", group="MA 0")
type0 = input.string("SMA", title="Type 0", options=["SMA", "EMA", "SMMA (RMA)", "WMA", "VWMA"], group="MA 0")
timeframe0 = input.timeframe("", title="Timeframe 0", group="MA 0")
color0 = input.color(color.gray, title="Color 0", group="MA 0")
show0 = input.bool(true, title="Show MA 0", group="MA 0")

length1 = input.int(48, minval=1, title="Length 1", group="MA 1")
source1 = input.source(hl2, title="Source 1", group="MA 1")
type1 = input.string("SMA", title="Type 1", options=["SMA", "EMA", "SMMA (RMA)", "WMA", "VWMA"], group="MA 1")
timeframe1 = input.timeframe("", title="Timeframe 1", group="MA 1")
color1 = input.color(color.aqua, title="Color 1", group="MA 1")
show1 = input.bool(true, title="Show MA 1", group="MA 1")

length2 = input.int(144, minval=1, title="Length 2", group="MA 2")
source2 = input.source(hl2, title="Source 2", group="MA 2")
type2 = input.string("SMA", title="Type 2", options=["SMA", "EMA", "SMMA (RMA)", "WMA", "VWMA"], group="MA 2")
timeframe2 = input.timeframe("", title="Timeframe 2", group="MA 2")
color2 = input.color(color.orange, title="Color 2", group="MA 2")
show2 = input.bool(true, title="Show MA 2", group="MA 2")

length3 = input.int(432, minval=1, title="Length 3", group="MA 3")
source3 = input.source(hl2, title="Source 3", group="MA 3")
type3 = input.string("SMA", title="Type 3", options=["SMA", "EMA", "SMMA (RMA)", "WMA", "VWMA"], group="MA 3")
timeframe3 = input.timeframe("", title="Timeframe 3", group="MA 3")
color3 = input.color(color.green, title="Color 3", group="MA 3")
show3 = input.bool(true, title="Show MA 3", group="MA 3")

length4 = input.int(91, minval=1, title="Length 4", group="MA 4")
source4 = input.source(hl2, title="Source 4", group="MA 4")
type4 = input.string("SMA", title="Type 4", options=["SMA", "EMA", "SMMA (RMA)", "WMA", "VWMA"], group="MA 4")
timeframe4 = input.timeframe("D", title="Timeframe 4", group="MA 4")
color4 = input.color(color.rgb(159, 110, 208), title="Color 4", group="MA 4") // light purple
style4 = input.string("step", title="Style 4", options=["line", "step"], group="MA 4")
show4 = input.bool(false, title="Show MA 4", group="MA 4")

length5 = input.int(182, minval=1, title="Length 5", group="MA 5")
source5 = input.source(hl2, title="Source 5", group="MA 5")
type5 = input.string("SMA", title="Type 5", options=["SMA", "EMA", "SMMA (RMA)", "WMA", "VWMA"], group="MA 5")
timeframe5 = input.timeframe("D", title="Timeframe 5", group="MA 5")
color5 = input.color(color.red, title="Color 5", group="MA 5")
style5 = input.string("step", title="Style 5", options=["line", "step"], group="MA 5")
show5 = input.bool(true, title="Show MA 5", group="MA 5")

// Calculate the value of each moving average
value0 = request.security(syminfo.tickerid, timeframe0, ma(source0, length0, type0))
value1 = request.security(syminfo.tickerid, timeframe1, ma(source1, length1, type1))
value2 = request.security(syminfo.tickerid, timeframe2, ma(source2, length2, type2))
value3 = request.security(syminfo.tickerid, timeframe3, ma(source3, length3, type3))
value4 = request.security(syminfo.tickerid, timeframe4, ma(source4, length4, type4))
value5 = request.security(syminfo.tickerid, timeframe5, ma(source5, length5, type5))

// Draw each moving average
plot(show0 ? value0 : na, title="MA 0", color=color0)
plot(show1 ? value1 : na, title="MA 1", color=color1)
plot(show2 ? value2 : na, title="MA 2", color=color2)
plot(show3 ? value3 : na, title="MA 3", color=color3)
plot(show4 ? value4 : na, title="MA 4", color=color4, style=style4 == "step" ? plot.style_stepline : plot.style_line, linewidth=2)
plot(show5 ? value5 : na, title="MA 5", color=color5, style=style5 == "step" ? plot.style_stepline : plot.style_line, linewidth=2)

// Add strategy section

// Select moving average value
get_ma_value(ma_name) =>
    if (ma_name == "MA 0")
        value0
    else if (ma_name == "MA 1")
        value1
    else if (ma_name == "MA 2")
        value2
    else if (ma_name == "MA 3")
        value3
    else if (ma_name == "MA 4")
        value4
    else
        value5

short_ma_value = get_ma_value(short_term_ma)
mid_ma_value = get_ma_value(mid_term_ma)
long_ma_value = get_ma_value(long_term_ma)
bull_bear_ma_value = get_ma_value(bull_bear_ma)

// Calculate volatility
high_close = ta.highest(high, volatility_k)
low_close = ta.lowest(low, volatility_k)
volatility = 100 * (high_close - low_close) / low_close

// Volatility condition background color
volatilityCondition = (volatility > volatility_threshold)
volatilityConditionBG = (volatility > volatility_threshold) and volatility_threshold != 0

bgcolor(volatilityConditionBG ? color.new(color.green, 90) : na, title="Volatility Background")

// Strategy signals
long_condition = (short_ma_value > long_ma_value and ta.crossover(mid_ma_value, long_ma_value))
short_condition = (short_ma_value < long_ma_value and ta.crossunder(mid_ma_value, long_ma_value))

var float stop_level_long = na
var float stop_level_short = na

// Execution Strategy
if (volatilityCondition and allow_long and (not enable_bull_bear or close > bull_bear_ma_value))
    if (long_condition and close > long_ma_value)  // Determine whether to trigger stop loss immediately
        strategy.entry("Long", strategy.long, qty=capital_pct * strategy.equity / close)
        label.new(bar_index, low*0.996, text="BUY", color=color.green, textcolor=color.white, style=label.style_label_up, size=size.small)

if (volatilityCondition and allow_short and (not enable_bull_bear or close < bull_bear_ma_value))
    if (short_condition and close < long_ma_value)  // Determine whether to trigger stop loss immediately
        strategy.entry("Short", strategy.short, qty=capital_pct * strategy.equity / close)
        label.new(bar_index, high*1.004, text="SELL", color=color.red, textcolor=color.white, style=label.style_label_down, size=size.small)

// Partial closing logic
if (enable_bull_bear)
    // When the current price is below the bull-bear trend moving average
    if (close < bull_bear_ma_value)
        // Close all long positions
        if (strategy.position_size > 0)
            strategy.close("Long", comment="Close all long positions")
            label.new(bar_index, low*0.996, text="CLOSE", color=color.gray, textcolor=color.white, style=label.style_label_up, size=size.small)
        // When the short-term moving average is above the long-term moving average, and the medium-term moving average crosses the long-term moving average upwards, close the short position
        if (short_ma_value > long_ma_value and ta.crossover(mid_ma_value, long_ma_value) and volatilityCondition)
            if (strategy.position_size < 0)
                strategy.close("Short", qty=close_pct * strategy.position_size, comment="Partially close short")
                label.new(bar_index, high*1.004, text="CLOSE", color=color.gray, textcolor=color.white, style=label.style_label_down, size=size.small)

    // When the current price is above the bull-bear trend moving average
    if (close > bull_bear_ma_value)
        // Close all short positions
        if (strategy.position_size < 0)
            strategy.close("Short", comment="Close all short positions")
            label.new(bar_index, high*1.004, text="CLOSE", color=color.gray, textcolor=color.white, style=label.style_label_up, size=size.small)
        // When the short-term moving average is below the long-term moving average, and the medium-term moving average crosses the long-term moving average downwards, close the long position
        if (short_ma_value < long_ma_value and ta.crossunder(mid_ma_value, long_ma_value) and volatilityCondition)
            if (strategy.position_size > 0)
                strategy.close("Long", qty=close_pct * strategy.position_size, comment="Partially close long")
                label.new(bar_index, low*0.996, text="CLOSE", color=color.gray, textcolor=color.white, style=label.style_label_down, size=size.small)
else if (not enable_bull_bear and not (allow_long and allow_short))
    // When the short-term moving average is above the long-term moving average, and the medium-term moving average crosses the long-term moving average upwards, close the short position
    if (short_ma_value > long_ma_value and ta.crossover(mid_ma_value, long_ma_value) and volatilityCondition)
        if (strategy.position_size < 0)
            strategy.close("Short", qty=close_pct * strategy.position_size, comment="Partially close short")
            label.new(bar_index, low*0.996, text="CLOSE", color=color.gray, textcolor=color.white, style=label.style_label_up, size=size.small)

    // When the short-term moving average is below the long-term moving average, and the medium-term moving average crosses the long-term moving average downwards, close the long position
    if (short_ma_value < long_ma_value and ta.crossunder(mid_ma_value, long_ma_value) and volatilityCondition)
        if (strategy.position_size > 0)
            strategy.close("Long", qty=close_pct * strategy.position_size, comment="Partially close long")
            label.new(bar_index, high*1.004, text="CLOSE", color=color.gray, textcolor=color.white, style=label.style_label_down, size=size.small)

// Stop-loss handling
if (strategy.position_size > 0)
    stop_level_long_user = strategy.position_avg_price * (1 - stop_loss_user)
    strategy.exit("Stop Loss", from_entry="Long", stop=stop_level_long_user)
else if (strategy.position_size < 0)
    stop_level_short_user = strategy.position_avg_price * (1 + stop_loss_user)
strategy.exit("Stop Loss", from_entry="Short", stop=stop_level_short_user)Published by ChaoZhang on the FMZ strategy square · last modified 2024-07-29. Collected in the Quant Trading Vault. Unvalidated research: re-test with your own data and costs before trusting it.
Build this with AgenKit
A spec is not a trading system. Paste this into your coding agent and AgenKit runs a specialist team — architecture, test-first build, risk gates, review — with paper trading on by default.
/agenkit build a production-grade trading bot with a backtest engine, risk controls and paper trading by default from strategies/Multi-Moving-Average-Crossover-Trend-Following-Strategy-with-Volatility-Filter.md- npx agenkit install engineering-kit in your project
- Paste the command into your agent and approve each phase
- Get tests, backtest, risk controls and a paper-trading switch
Understand it first
Before you run this, read the lesson behind the idea and how to backtest it honestly. Specs like this one are the survivors of an unknown number of trials; deflate their results accordingly.
Related specs
- ADX MA and EMA Long Only Trend Tracking StrategyPine Script · Trend following · 1d
- ATR and Moving Average Crossover Hybrid StrategyPine Script · Trend following · 1h
- Bollinger Band Moving Average Crossover StrategyPine Script · Trend following · 1h
- Bollinger Bands and EMA Trend Following StrategyPine Script · Trend following · 1h
- Bollinger Bands and RSI Trend Following StrategyPine Script · Trend following · 1h
- Candlestick Pattern Trend Filter StrategyPine Script · Trend following · 1d