Multi Period RSI Divergence with Support Resistance Quantitative Trading Strategy
This strategy is a quantitative trading system that combines RSI technical indicator, price divergence, and support/resistance levels. The strategy identifies trading signals through RSI-price divergence…
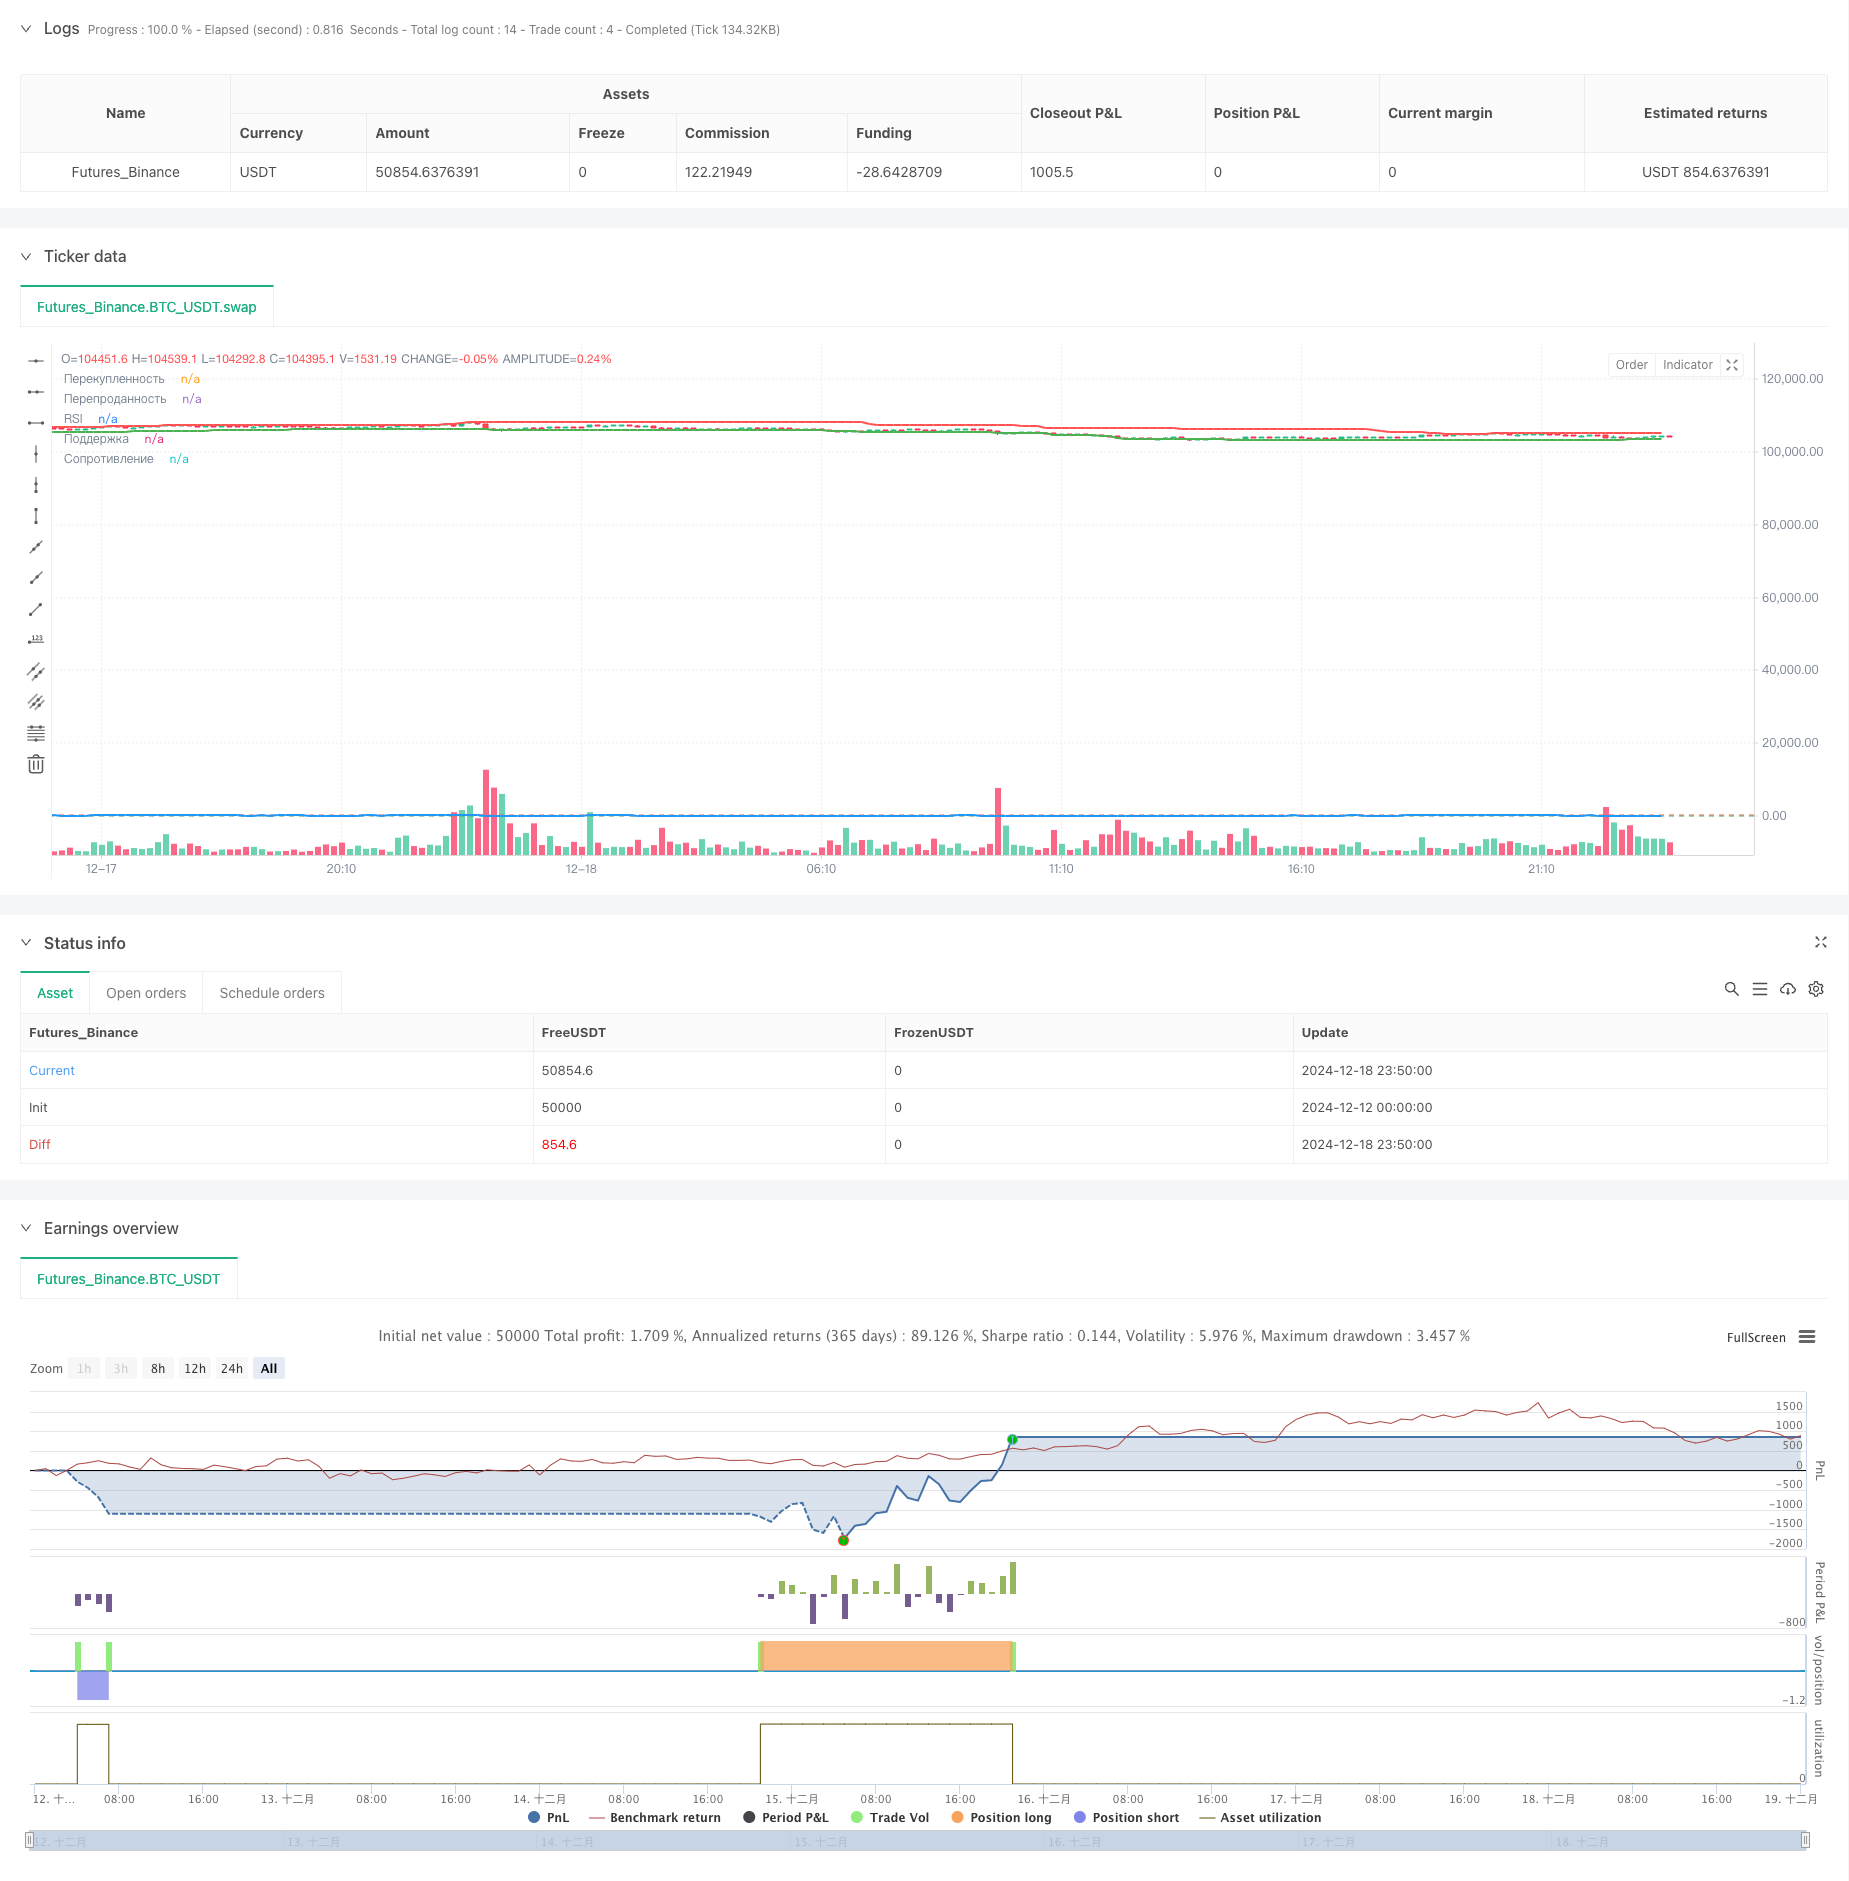
Overview
This strategy is a quantitative trading system that combines RSI technical indicator, price divergence, and support/resistance levels. The strategy identifies trading signals through RSI-price divergence relationships and support/resistance breakouts, while incorporating stop-loss and take-profit mechanisms for risk control.
Strategy Principles
The strategy is based on several core components:
- RSI Calculation: Uses a 14-period Relative Strength Index (RSI) to measure price momentum
- Support/Resistance Identification: Determines key price levels using 50-period highs and lows
- Divergence Detection:
- Bullish Divergence: When price makes new low but RSI doesn't, and price is above support
- Bearish Divergence: When price makes new high but RSI doesn't, and price is below resistance
- Risk Management:
- 1% stop-loss after entry
- 2% take-profit target
Strategy Advantages
- Multiple Confirmation Mechanism: Combines momentum indicator (RSI), price pattern (divergence), and market structure (support/resistance) for more reliable signals
- Comprehensive Risk Control: Preset stop-loss and take-profit mechanisms effectively control risk per trade
- High Adaptability: Strategy parameters can be adjusted for different market conditions
- Clear Signals: Trading conditions are well-defined for easy implementation and backtesting
Strategy Risks
- False Breakout Risk: Frequent false signals may occur in ranging markets
- Parameter Sensitivity: Choice of RSI period and support/resistance period significantly impacts strategy performance
- Slippage Impact: Actual execution prices may deviate from signal prices in fast markets
- Market Environment Dependency: Performs better in trending markets, may generate false signals in ranging markets
Optimization Directions
- Timeframe Optimization: Add multiple timeframe confirmation mechanism to improve signal reliability
- Stop-Loss Enhancement: Introduce dynamic stop-loss mechanisms, such as trailing stops
- Filter Implementation: Add volume and volatility filters to reduce false signals
- Parameter Adaptation: Develop adaptive parameter mechanisms for automatic adjustment based on market conditions
Summary
The strategy constructs a relatively complete trading system by combining multiple important concepts in technical analysis. Its strengths lie in multiple confirmation mechanisms and comprehensive risk control, while facing challenges in parameter selection and market environment dependency. Through the suggested optimization directions, the strategy's stability and adaptability can be further improved. In practical application, it is recommended to determine the most suitable strategy configuration through thorough historical data backtesting and parameter optimization.
Source Pine Script
/*backtest
start: 2024-12-12 00:00:00
end: 2024-12-19 00:00:00
period: 10m
basePeriod: 10m
exchanges: [{"eid":"Futures_Binance","currency":"BTC_USDT"}]
*/

//@version=6
strategy("Агрессивная стратегия с дивергенциями по RSI и уровнями поддержки/сопротивления", overlay=true)

// Параметры для RSI
rsiLength = input.int(14, title="Период для RSI", minval=1)   // Период для расчета RSI
rsiOverbought = input.int(70, title="Уровень перекупленности", minval=1, maxval=100)
rsiOversold = input.int(30, title="Уровень перепроданности", minval=1, maxval=100)

// Параметры для стоп-лосса и тейк-профита
stopLossPercent = input.float(1, title="Стоп-лосс (%)", minval=0.1) / 100
takeProfitPercent = input.float(2, title="Тейк-профит (%)", minval=0.1) / 100

// Период для уровней поддержки и сопротивления
supportResistanceLength = input.int(50, title="Период для уровней поддержки и сопротивления", minval=1)

// Рассчитываем RSI
rsi = ta.rsi(close, rsiLength)

// Рассчитываем уровни поддержки и сопротивления
support = ta.lowest(close, supportResistanceLength)  // Находим минимумы за период для поддержки
resistance = ta.highest(close, supportResistanceLength)  // Находим максимумы за период для сопротивления

// Определяем дивергенцию RSI с ценой
priceHigh = ta.highest(close, rsiLength)
priceLow = ta.lowest(close, rsiLength)
rsiHigh = ta.highest(rsi, rsiLength)
rsiLow = ta.lowest(rsi, rsiLength)

// Дивергенция на покупку (бычья): цена делает новый минимум, а RSI этого не делает
bullishDivergence = priceLow < priceLow[1] and rsiLow > rsiLow[1] and close > support

// Дивергенция на продажу (медвежья): цена делает новый максимум, а RSI этого не делает
bearishDivergence = priceHigh > priceHigh[1] and rsiHigh < rsiHigh[1] and close < resistance

// Отображаем уровни поддержки и сопротивления
plot(support, title="Поддержка", color=color.green, linewidth=2, style=plot.style_line)
plot(resistance, title="Сопротивление", color=color.red, linewidth=2, style=plot.style_line)

// Условия для покупки по бычьей дивергенции
if (bullishDivergence)
    strategy.entry("Long", strategy.long)
    stopLoss = close * (1 - stopLossPercent)   // Стоп-лосс
    takeProfit = close * (1 + takeProfitPercent) // Тейк-профит
    strategy.exit("Exit Long", from_entry="Long", stop=stopLoss, limit=takeProfit)

// Условия для продажи по медвежьей дивергенции
if (bearishDivergence)
    strategy.entry("Short", strategy.short)
    stopLoss = close * (1 + stopLossPercent)   // Стоп-лосс для шорта
    takeProfit = close * (1 - takeProfitPercent) // Тейк-профит для шорта
    strategy.exit("Exit Short", from_entry="Short", stop=stopLoss, limit=takeProfit)

// Отображаем RSI на отдельном графике
plot(rsi, title="RSI", color=color.blue, linewidth=2)
hline(rsiOverbought, "Перекупленность", color=color.red)
hline(rsiOversold, "Перепроданность", color=color.green)
Published by ChaoZhang on the FMZ strategy square · last modified 2024-12-20. Collected in the Quant Trading Vault. Unvalidated research: re-test with your own data and costs before trusting it.
Build this with AgenKit
A spec is not a trading system. Paste this into your coding agent and AgenKit runs a specialist team — architecture, test-first build, risk gates, review — with paper trading on by default.
/agenkit build a production-grade trading bot with a backtest engine, risk controls and paper trading by default from strategies/Multi-Period-RSI-Divergence-with-Support-Resistance-Quantitative-Trading-Strategy.md- npx agenkit install engineering-kit in your project
- Paste the command into your agent and approve each phase
- Get tests, backtest, risk controls and a paper-trading switch
Understand it first
Before you run this, read the lesson behind the idea and how to backtest it honestly. Specs like this one are the survivors of an unknown number of trials; deflate their results accordingly.
Related specs
- Bollinger Bands Dynamic Breakout StrategyPine Script · Breakout · 1h
- Cross period Value Area Breakout StrategyPine Script · Breakout · 1d
- Exponential Moving Average Candle Stop Trading StrategyPine Script · Breakout · 1d
- Momentum Breakout Moving Average StrategyPine Script · Breakout · 1d
- Moving Average Crossover and Upper Rail Breakthrough Impulse StrategyPine Script · Breakout · 1m
- Multi factor Intelligent Trading StrategyPine Script · Breakout · 1d