Strategy vault / Trend following
Multi Period SAR Trend Following Strategy with Adaptive Stop Loss Optimization
This strategy is a deep optimization of the traditional Parabolic SAR (Stop and Reverse) indicator, combining multi-period trend judgment and adaptive stop-loss mechanisms. The strategy employs a dynamic Acceleration…
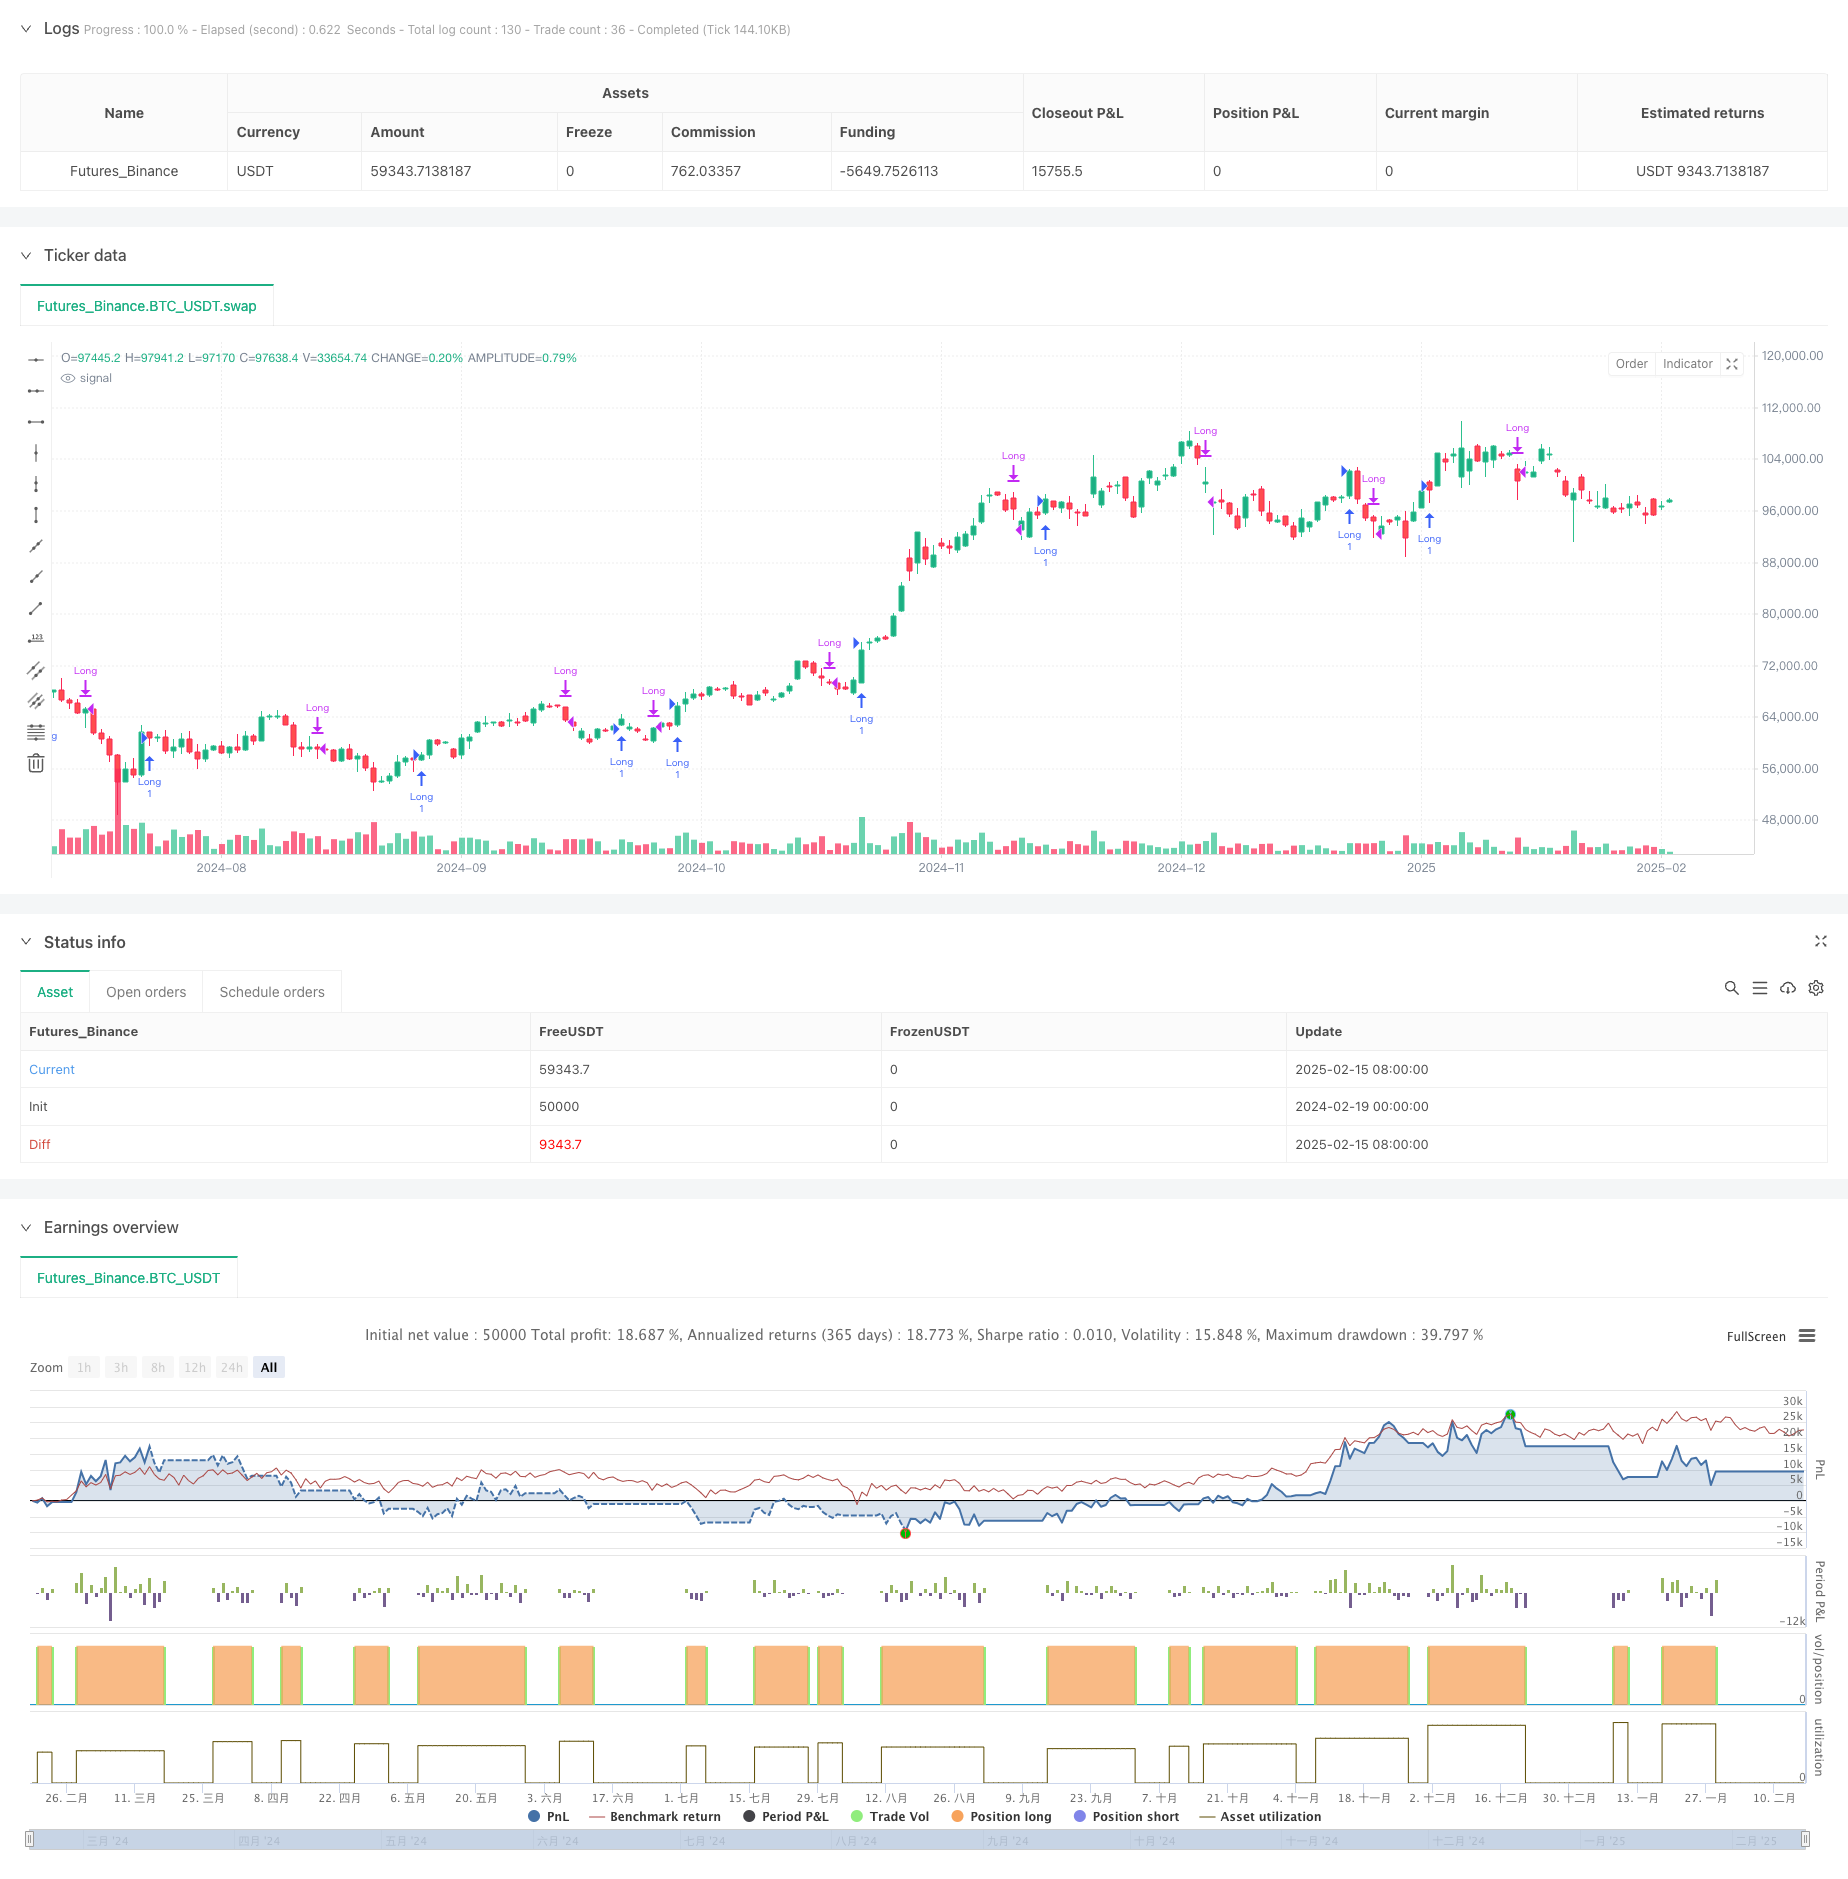
Overview
This strategy is a deep optimization of the traditional Parabolic SAR (Stop and Reverse) indicator, combining multi-period trend judgment and adaptive stop-loss mechanisms. The strategy employs a dynamic Acceleration Factor (AF) adjustment method, tracking market trends through continuous updates of Extreme Points (EP) to achieve precise capture of upward trends and risk control.
Strategy Principles
The core logic of the strategy is based on the following key elements:
- Dynamic SAR Calculation: Uses three parameters - initial AF, increment value, and maximum value - to dynamically adjust SAR values based on trend strength.
- Trend Determination Mechanism: Judges trend direction by comparing SAR values with price positions, triggering trend reversal signals when SAR crosses price.
- Entry Logic: Places entry orders using next period's predicted SAR value as stop-loss when uptrend is confirmed and no position is held.
- Stop-Loss Optimization: Uses extremes from the previous 1-2 candles as SAR adjustment benchmark, improving stop-loss accuracy and timeliness.
Strategy Advantages
- Strong Adaptability: Parameters automatically adjust to market volatility through dynamic AF adjustment.
- Comprehensive Risk Control: Uses predictive SAR values for stop-loss, ensuring forward-looking and effective risk management.
- Accurate Trend Capture: Multiple trend confirmation mechanisms reduce risks from false breakouts.
- Rigorous Calculation Logic: Employs variable state maintenance mechanism, ensuring strategy stability in historical backtesting.
Strategy Risks
- Sideways Market Risk: Frequent false signals may trigger consecutive stop-losses in ranging markets. Solution: Introduce volatility filters to reduce trading frequency in low volatility environments.
- Slippage Impact: Predictive SAR stops may face slippage risks in highly volatile markets. Solution: Set reasonable slippage tolerance and adjust parameters based on instrument characteristics.
- Trend Reversal Delay: Stop-loss may lag in sharp reversal situations. Solution: Incorporate short-period momentum indicators to improve stop-loss sensitivity.
Strategy Optimization Directions
- Multi-Period Synergy: Add trend confirmation mechanisms across multiple timeframes to improve signal reliability.
- Dynamic Parameter Optimization: Dynamically adjust AF parameters based on market volatility.
- Stop-Loss Mechanism Enhancement: Introduce ATR-based dynamic stop-loss bands for improved flexibility.
- Position Management Optimization: Add volatility-based dynamic position management mechanism.
Summary
The strategy effectively combines trend following and risk control through deep optimization of the classic PSAR indicator. Its adaptive features and comprehensive stop-loss mechanism provide strong practical application value. Through the suggested optimization directions, the strategy's stability and profitability can be further enhanced.
Source Pine Script
/*backtest
start: 2024-02-19 00:00:00
end: 2025-02-16 08:00:00
period: 1d
basePeriod: 1d
exchanges: [{"eid":"Futures_Binance","currency":"BTC_USDT"}]
*/

//@version=6
strategy("AStock parabolic strategy (long only) – completely remove SAR plotting", overlay=true)

// Parameter Settings
start     = input.float(0.02, "Starting acceleration factor")
increment = input.float(0.02, "Acceleration factor increment")
maximum   = input.float(0.2,  "Maximum acceleration factor")

// Define Variables(varEnsure variables maintain state throughout the historical data)
var bool   uptrend    = true    // default initialized to an uptrend
var float  EP         = na      // Extremum points: the highest price in an uptrend, the lowest price in a downtrend
var float  SAR        = na      // CurrentKLine'sSAR
var float  AF         = start   // Current acceleration factor
var float  nextBarSAR = na      // next barKLine PredictionSAR

//[1]Initialization: for the first candleKLine(bar_index==0)
if bar_index == 0
    // Use First BarKInitialize line closing price
    SAR        := close
    nextBarSAR := close
    EP         := close
    uptrend    := true

//[2]From Second BarKline start(bar_index>=1)CalculationSAR
if bar_index >= 1
    // First take the previous oneKCalculated by line nextBarSAR Assign to CurrentSAR
    SAR := nz(nextBarSAR, SAR)

    // No.2RootKLine(bar_index==1)initialize, using the previous oneKLine(bar_index==0)High and Low Price
    if bar_index == 1
        if close > close[1]
            uptrend := true
            EP      := high
            SAR     := low[1]
        else
            uptrend := false
            EP      := low
            SAR     := high[1]
        AF := start
        nextBarSAR := SAR + AF * (EP - SAR)
    else
        // Record whether it is the first bar of a trend reversalKline to facilitate subsequent judgment
        var bool firstTrendBar = false
        firstTrendBar := false

        // Detect trend reversal:
        // In an uptrend, if the currentSARIf it exceeds the lowest price, it is considered a reversal
        if uptrend
            if SAR > low
                firstTrendBar := true
                uptrend     := false
                // on reversal,SARTake the greater of the previous extreme value and the current highest price, and change the extreme value to the current lowest price
                SAR         := math.max(EP, high)
                EP          := low
                AF          := start
            // Note: the original code also has a judgment in an uptrend SAR < high but usually the reversal criterion only needs to checkSARAs long as it crosses the low point
        else
            // In a downtrend, if the currentSARIf below the highest price, it is considered a reversal to an upward trend
            if SAR < high
                firstTrendBar := true
                uptrend     := true
                SAR         := math.min(EP, low)
                EP          := high
                AF          := start

        // If not a reversal, update the extreme value and acceleration factor
        if not firstTrendBar
            if uptrend
                if high > EP
                    EP := high
                    AF := math.min(AF + increment, maximum)
            else
                if low < EP
                    EP := low
                    AF := math.min(AF + increment, maximum)

        // AdjustmentSAR,Make sure it is no older than the most recent1-2RootKThe lowest price (uptrend) or highest price (downtrend) of the line)
        if uptrend
            SAR := math.min(SAR, low[1])
            if bar_index > 1
                SAR := math.min(SAR, low[2])
        else
            SAR := math.max(SAR, high[1])
            if bar_index > 1
                SAR := math.max(SAR, high[2])

        // Calculate the next oneKLine PredictionSAR
        nextBarSAR := SAR + AF * (EP - SAR)

        //[3]Trading logic (only long)
        if barstate.isconfirmed
            // Enter a long position when there is an uptrend and there are currently no long positions (using the predicted next).KLineSARStop-loss trigger price)
            if uptrend and strategy.position_size <= 0
                strategy.entry("Long", strategy.long, stop=nextBarSAR, comment="Long Entry")
            // Close the position when the trend turns downward and holding long positions
            if not uptrend and strategy.position_size > 0
                strategy.close("Long", comment="Long Exit")

// The plotting part is completely removed, no longer drawing anything related toSARRelated graphicsPublished by ChaoZhang on the FMZ strategy square · last modified 2025-02-18. Collected in the Quant Trading Vault. Unvalidated research: re-test with your own data and costs before trusting it.
Build this with AgenKit
A spec is not a trading system. Paste this into your coding agent and AgenKit runs a specialist team — architecture, test-first build, risk gates, review — with paper trading on by default.
/agenkit build a production-grade trading bot with a backtest engine, risk controls and paper trading by default from strategies/Multi-Period-SAR-Trend-Following-Strategy-with-Adaptive-Stop-Loss-Optimization.md- npx agenkit install engineering-kit in your project
- Paste the command into your agent and approve each phase
- Get tests, backtest, risk controls and a paper-trading switch
Understand it first
Before you run this, read the lesson behind the idea and how to backtest it honestly. Specs like this one are the survivors of an unknown number of trials; deflate their results accordingly.
Related specs
- Dual ATR Channel Trend Following StrategyPine Script · Trend following · 15m
- An Optimization of Dual Moving Average Trend Following Strategy Based on Indicators CombinationPine Script · Trend following · 4h
- Enhanced Moving Average Crossover Sakkoulas Trading StrategyPine Script · Trend following · 1h
- Multi Indicator Trend Following Trading Strategy with Parabolic SAR and SuperTrend CloudPine Script · Trend following
- Adaptive Trend Following with Dynamic Risk Control StrategyPine Script · Trend following · 1h
- Parabolic SAR Trailing Stop Strategy Based on ATR IndicatorPine Script · Trend following · 1h