Multi Timeframe Fibonacci Retracement with Trend Breakout Trading Strategy
This strategy is a trend trading system based on Fibonacci retracement levels and candlestick patterns. It operates across multiple timeframes, combining technical analysis and risk management principles. The…
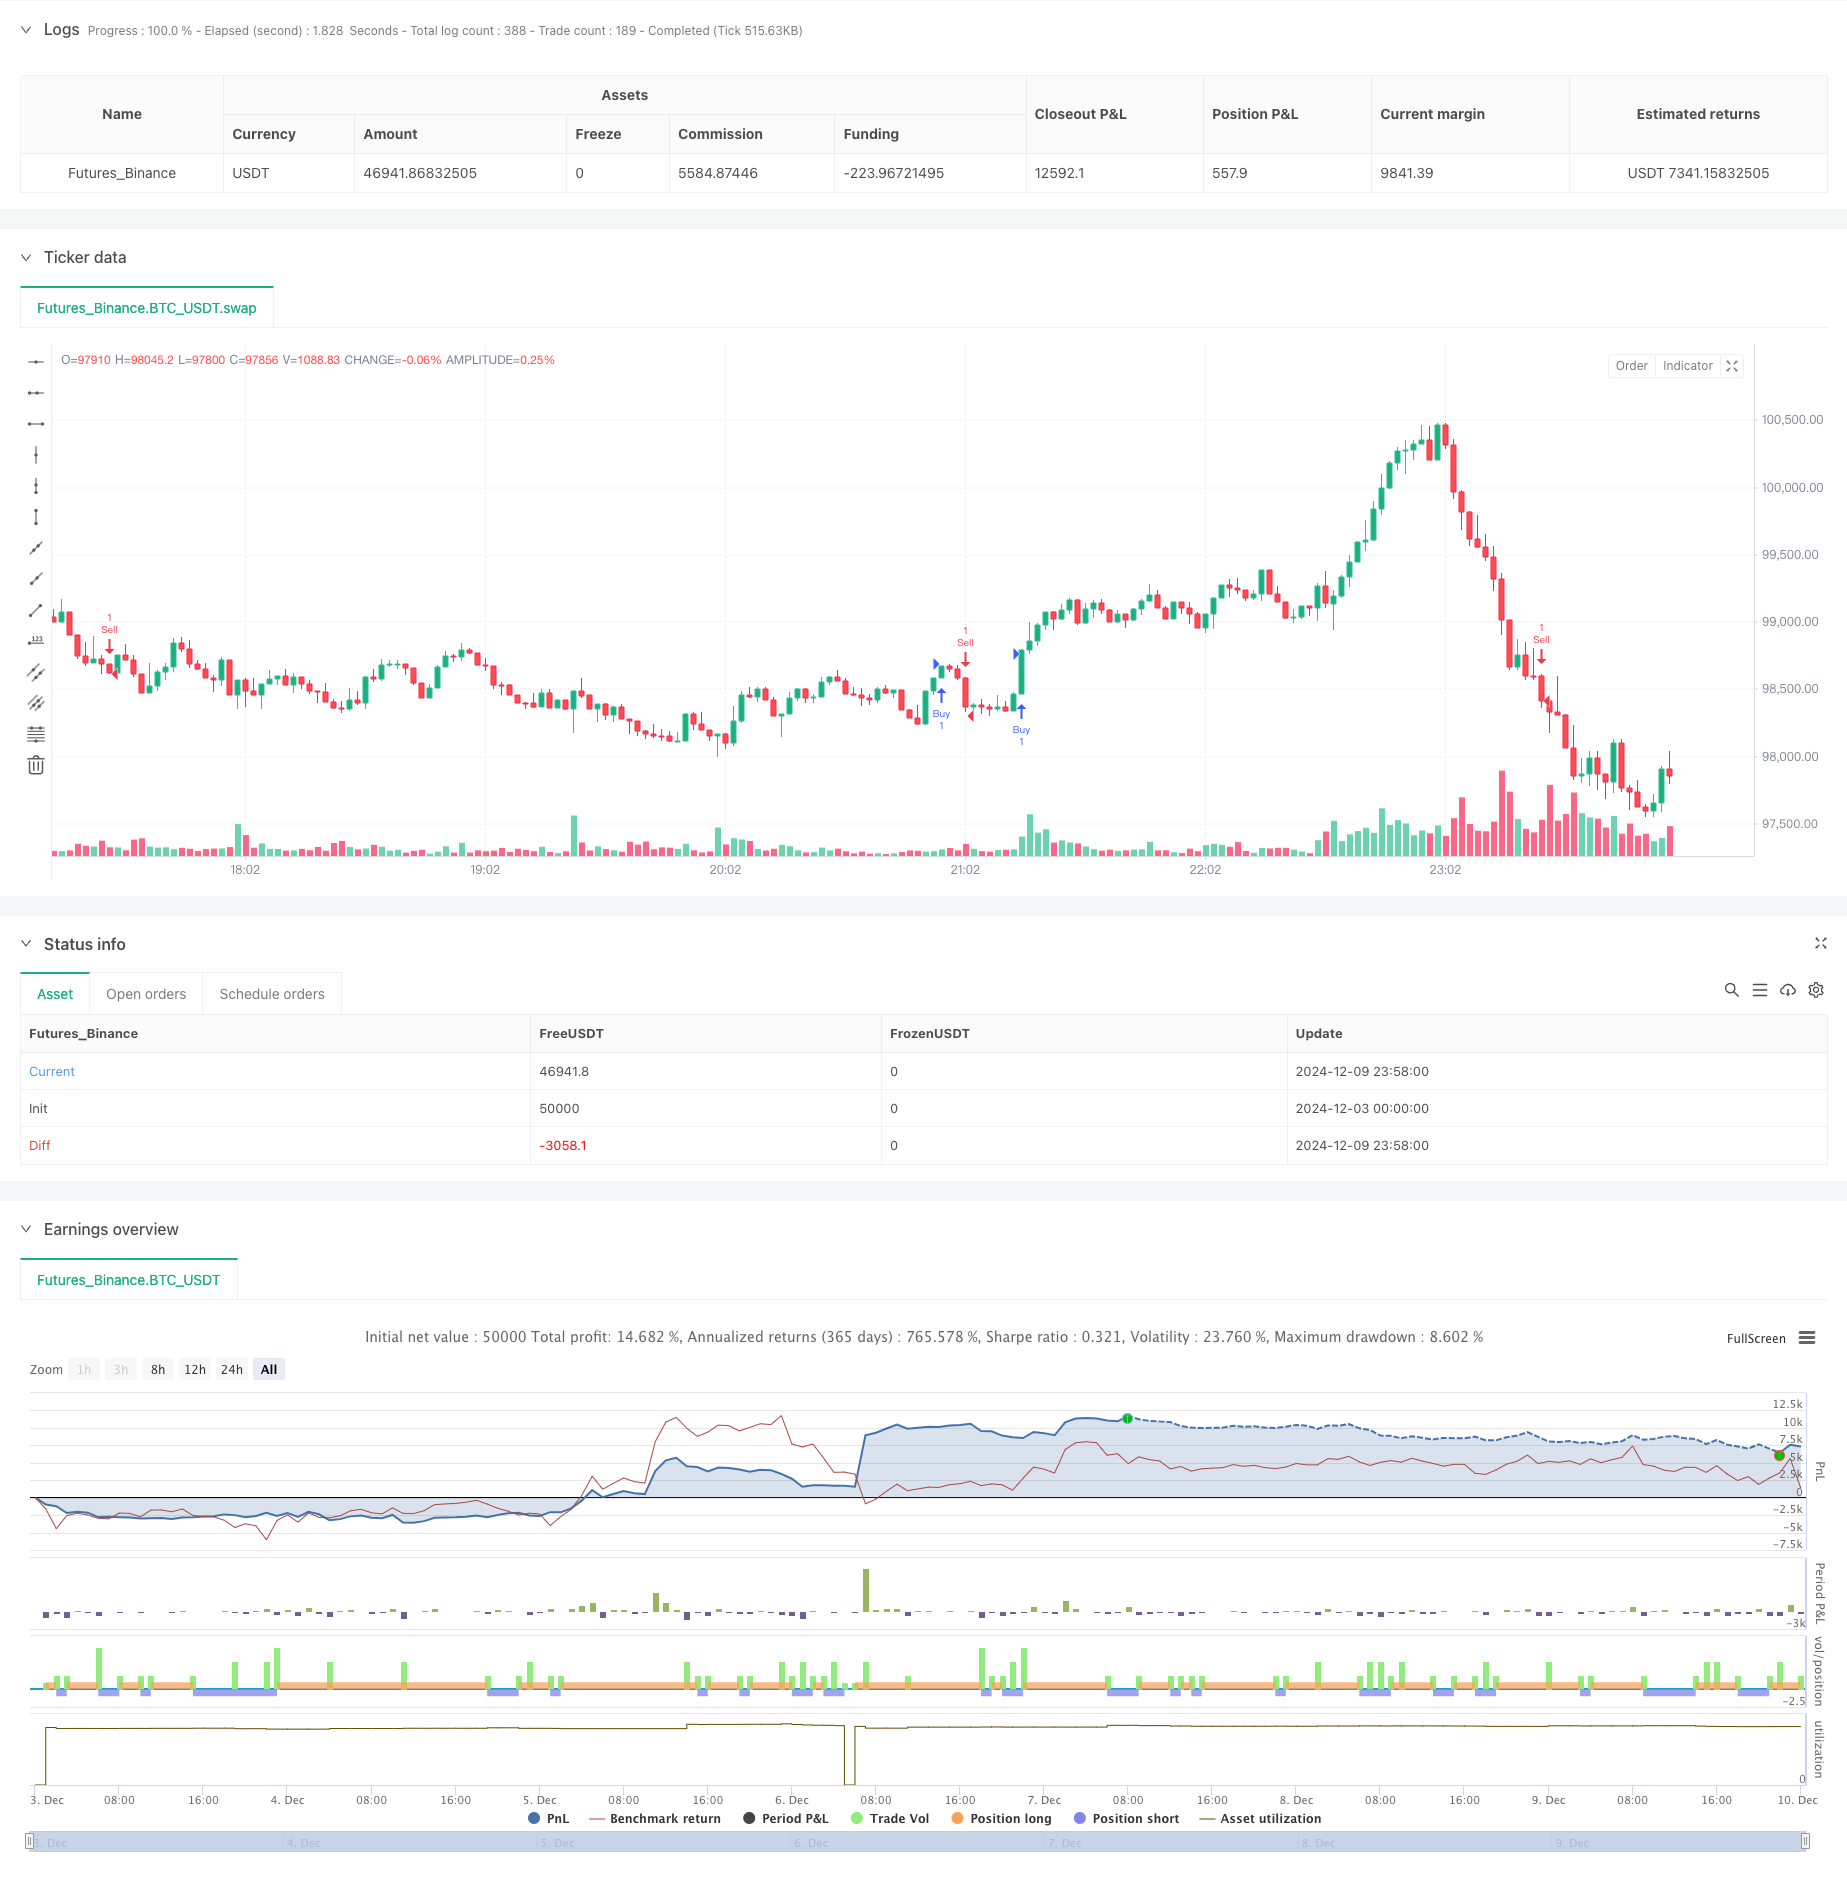
Overview
This strategy is a trend trading system based on Fibonacci retracement levels and candlestick patterns. It operates across multiple timeframes, combining technical analysis and risk management principles. The strategy primarily seeks trading opportunities by identifying key Fibonacci retracement levels (0.618 and 0.786) while utilizing stop-loss and profit targets for risk management.
Strategy Principles
The core logic of the strategy is based on several key elements:
- Timeframe Selection: The strategy can operate on multiple timeframes including 4-hour, daily, weekly, and monthly to accommodate different trading styles.
- Fibonacci Level Calculation: Uses 50-period high and low prices to calculate two key retracement levels at 0.618 and 0.786.
- Entry Signal Generation: The system generates long or short signals when the closing price breaks through Fibonacci levels under specific conditions. Long signals require the closing price to be above the opening price and above the 0.618 level; short signals require the closing price to be below the opening price and below the 0.786 level.
- Risk Management: The strategy employs fixed percentage stop-losses and determines profit targets through preset risk-reward ratios.
Strategy Advantages
- Multi-timeframe Adaptability: By operating across different timeframes, the strategy can adapt to various market environments and trading styles.
- Systematic Risk Management: Clear risk control through preset stop-loss and profit targets for each trade.
- Technical Indicator Integration: Combines Fibonacci retracement with candlestick pattern analysis for more reliable trading signals.
- High Customizability: Key parameters such as Fibonacci levels, risk-reward ratio, and stop-loss percentage can be adjusted according to personal preferences.
Strategy Risks
- Market Volatility Risk: During high volatility periods, prices may quickly break through stop-loss levels causing losses.
- False Breakout Risk: The market may generate false breakout signals at Fibonacci levels.
- Parameter Optimization Risk: Over-optimization of parameters may lead to poor strategy performance in live trading.
- Liquidity Risk: May face insufficient liquidity under certain timeframes or market conditions.
Strategy Optimization Directions
- Add Market Trend Filter: Can add moving averages or other trend indicators to filter counter-trend signals.
- Optimize Entry Timing: Consider adding volume confirmation or momentum indicators to improve entry accuracy.
- Dynamic Stop-Loss Management: Implement volatility-based dynamic stop-losses to adapt to different market conditions.
- Add Time Filtering: Incorporate trading time window restrictions to avoid unfavorable market periods.
- Multi-dimensional Signal Confirmation: Integrate other technical indicators for additional signal confirmation.
Summary
This is a well-structured trend-following strategy that provides traders with a systematic trading approach by combining Fibonacci retracement, candlestick patterns, and risk management principles. While certain risks exist, the strategy's stability and reliability can be further enhanced through the suggested optimization directions. The strategy's multi-timeframe nature and customizable parameters make it suitable for different types of traders.
Source Pine Script
/*backtest
start: 2024-12-03 00:00:00
end: 2024-12-10 00:00:00
period: 2m
basePeriod: 2m
exchanges: [{"eid":"Futures_Binance","currency":"BTC_USDT"}]
*/

// This Pine Script™ code is subject to the terms of the Mozilla Public License 2.0 at https://mozilla.org/MPL/2.0/
// © jontucklogic7467

//@version=5
strategy("Fibonacci Swing Trading Bot", overlay=true)

// Input parameters
fiboLevel1 = input.float(0.618, title="Fibonacci Retracement Level 1")
fiboLevel2 = input.float(0.786, title="Fibonacci Retracement Level 2")
riskRewardRatio = input.float(2.0, title="Risk/Reward Ratio")
stopLossPerc = input.float(1.0, title="Stop Loss Percentage") / 100

// Timeframe selection
useTimeframe = input.timeframe("240", title="Timeframe for Analysis", options=["240", "D", "W", "M"])

// Request data from selected timeframe
highTF = request.security(syminfo.tickerid, useTimeframe, high)
lowTF = request.security(syminfo.tickerid, useTimeframe, low)

// Swing high and low calculation over the last 50 bars in the selected timeframe
highestHigh = ta.highest(highTF, 50)
lowestLow = ta.lowest(lowTF, 50)

// Fibonacci retracement levels
fib618 = highestHigh - (highestHigh - lowestLow) * fiboLevel1
fib786 = highestHigh - (highestHigh - lowestLow) * fiboLevel2

// Plot Fibonacci levels
// line.new(bar_index[1], fib618, bar_index, fib618, color=color.red, width=2, style=line.style_dashed)
// line.new(bar_index[1], fib786, bar_index, fib786, color=color.orange, width=2, style=line.style_dashed)

// Entry signals based on candlestick patterns and Fibonacci levels
bullishCandle = close > open and close > fib618 and close < highestHigh
bearishCandle = close < open and close < fib786 and close > lowestLow

// Stop loss and take profit calculation
stopLoss = bullishCandle ? close * (1 - stopLossPerc) : close * (1 + stopLossPerc)
takeProfit = bullishCandle ? close + (close - stopLoss) * riskRewardRatio : close - (stopLoss - close) * riskRewardRatio

// Plot buy and sell signals
if bullishCandle
    strategy.entry("Buy", strategy.long)
    strategy.exit("Take Profit", "Buy", limit=takeProfit, stop=stopLoss)

if bearishCandle
    strategy.entry("Sell", strategy.short)
    strategy.exit("Take Profit", "Sell", limit=takeProfit, stop=stopLoss)
Published by ChaoZhang on the FMZ strategy square · last modified 2024-12-11. Collected in the Quant Trading Vault. Unvalidated research: re-test with your own data and costs before trusting it.
Build this with AgenKit
A spec is not a trading system. Paste this into your coding agent and AgenKit runs a specialist team — architecture, test-first build, risk gates, review — with paper trading on by default.
/agenkit build a production-grade trading bot with a backtest engine, risk controls and paper trading by default from strategies/Multi-Timeframe-Fibonacci-Retracement-with-Trend-Breakout-Trading-Strategy.md- npx agenkit install engineering-kit in your project
- Paste the command into your agent and approve each phase
- Get tests, backtest, risk controls and a paper-trading switch
Understand it first
Before you run this, read the lesson behind the idea and how to backtest it honestly. Specs like this one are the survivors of an unknown number of trials; deflate their results accordingly.
Related specs
- Multi factor Intelligent Trading StrategyPine Script · Breakout · 1d
- Advanced Fibonacci Retracement and Volume Weighted Price Action Trading StrategyPine Script · Breakout · 1h
- Multi Timeframe Momentum Breakout StrategyPine Script · Breakout · 1d
- Adaptive Multi Period Trading Strategy Based on Wave Trend Momentum BreakoutPine Script · Breakout · 2h
- Advanced Multi Pattern Breakout Trading StrategyPine Script · Breakout · 1d
- Breakthrough of Daily High low Price Based on Fibonacci LevelsPine Script · Breakout · 10m