Strategy vault / Multi-timeframe
Multi Timeframe Moving Average Strategy
This strategy uses moving averages and exponential moving averages of different timeframes as trading signals to chase rises and kill drops. It judges the market trend and inflection points according to the location…
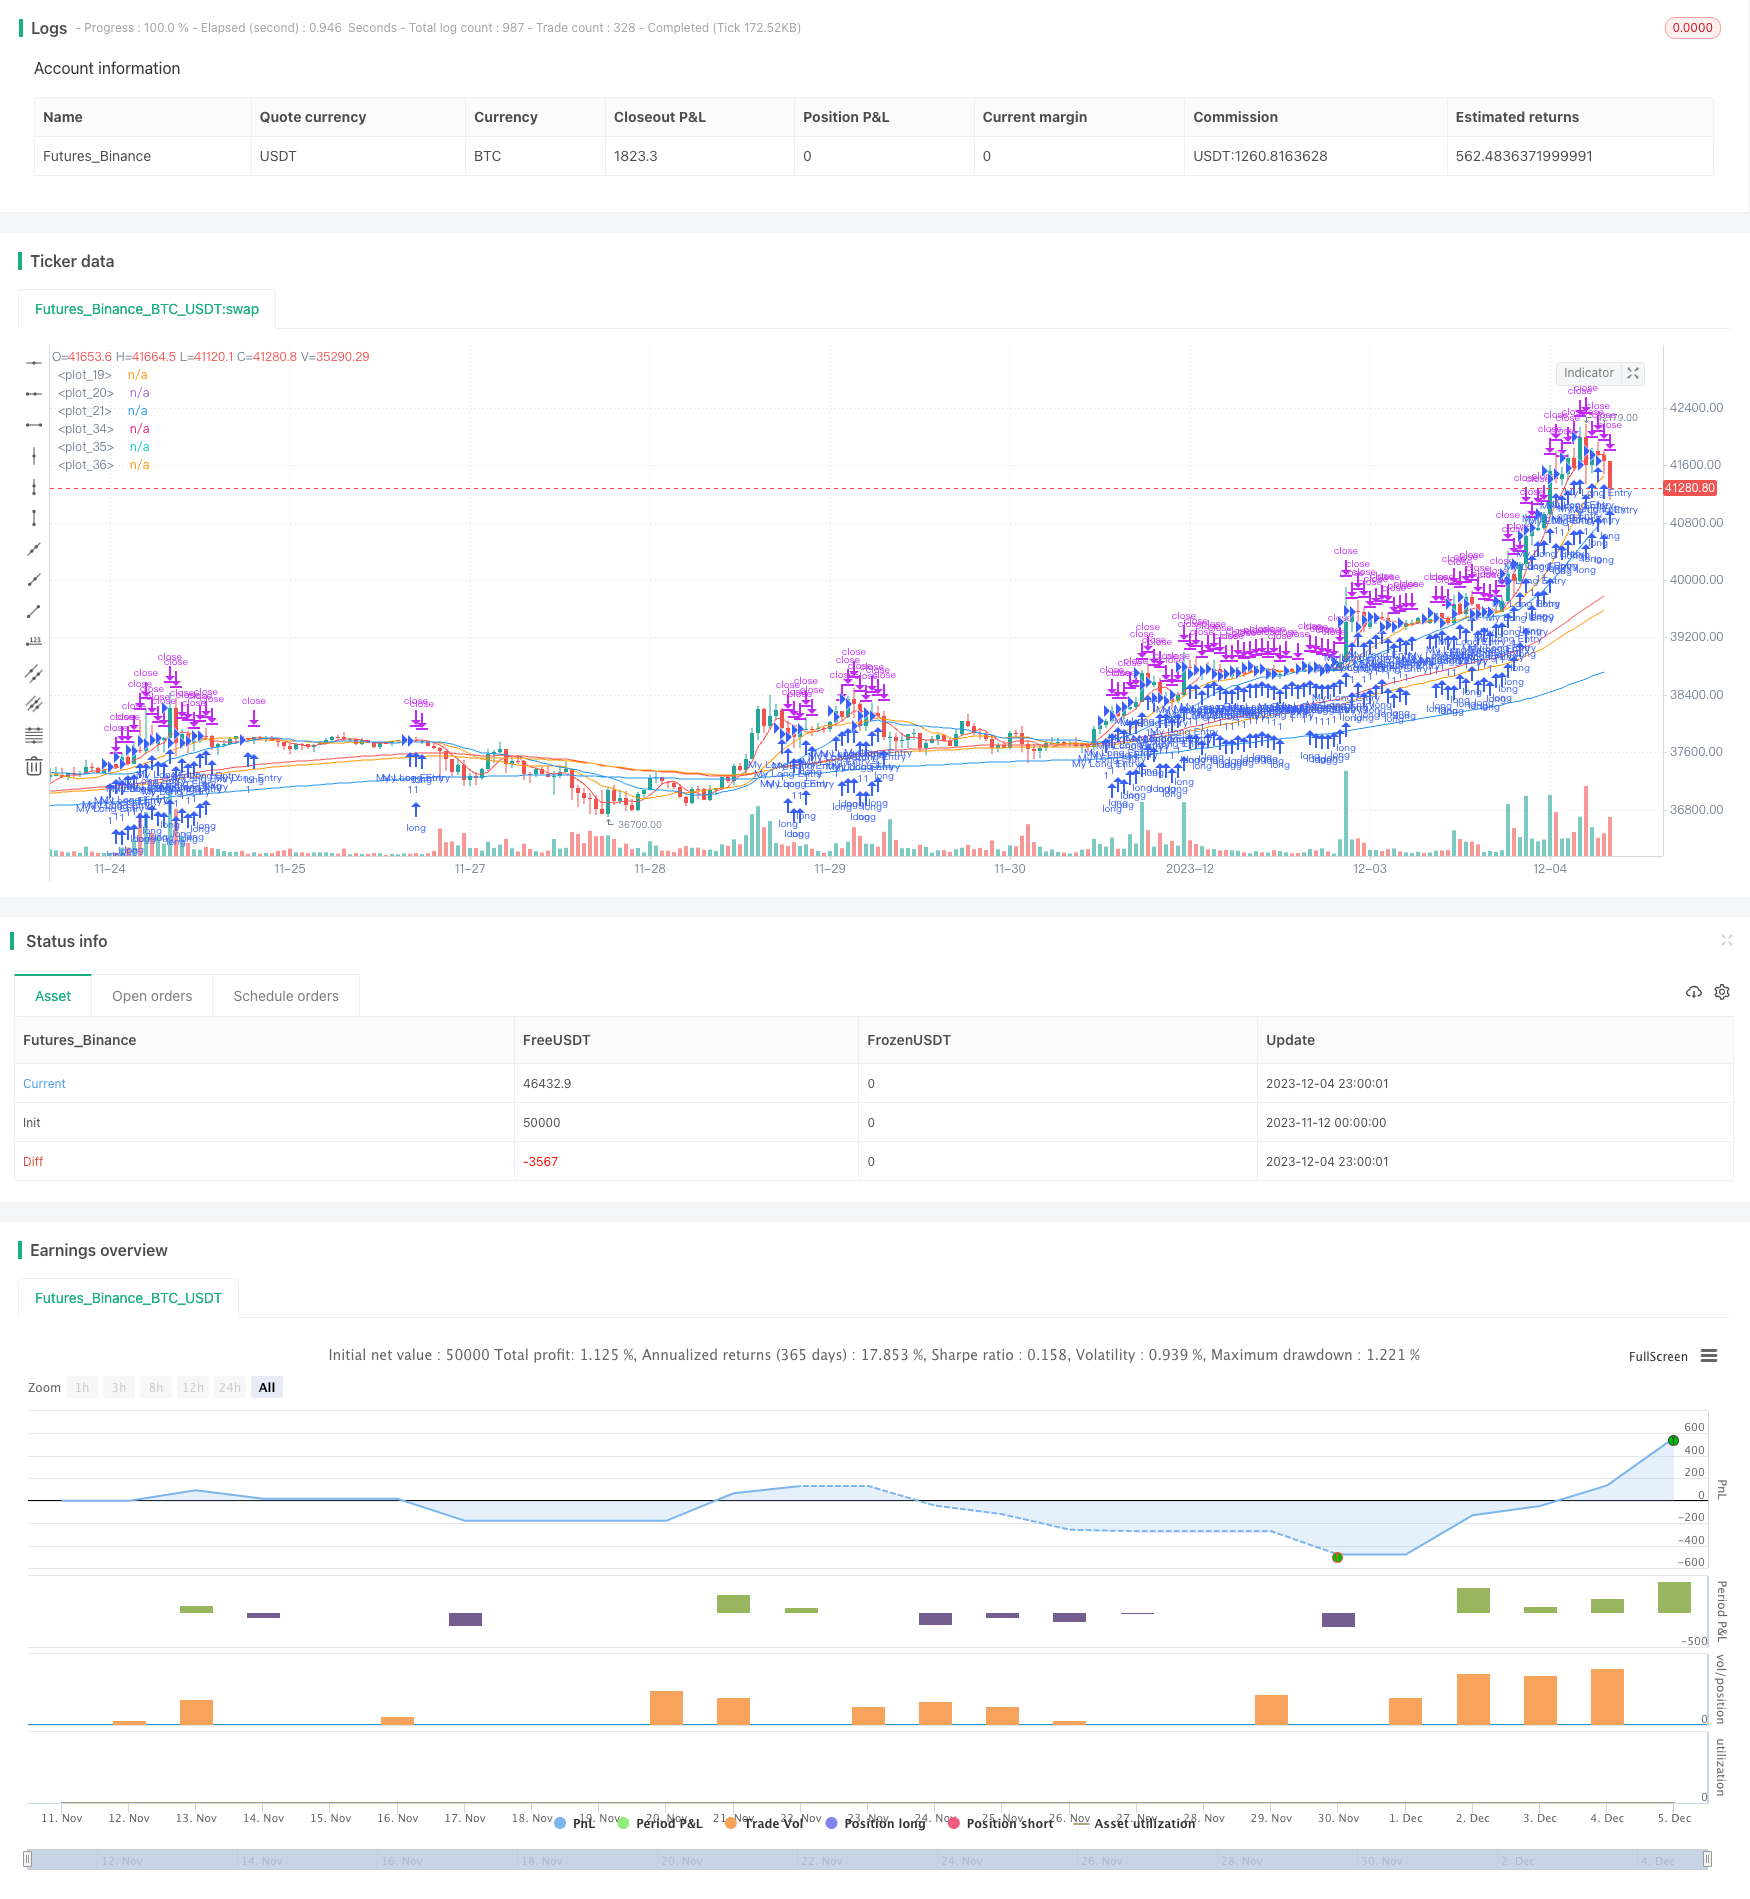
Overview
This strategy uses moving averages and exponential moving averages of different timeframes as trading signals to chase rises and kill drops. It judges the market trend and inflection points according to the location and trend of short-term moving averages and determines the major trend according to long-term moving averages. The strategy combines Simple Moving Average (SMA) and Exponential Moving Average (EMA) as technical indicators to effectively filter market noise and determine price trends.
Strategy Logic
The strategy uses 5-day, 13-day, 21-day SMA and 75-day, 90-day, 200-day EMA as trading signals. The specific logic is:
When the short-term SMAs (5-day, 13-day, 21-day) are arranged in order (5-day on the top, 13-day next, 21-day at the bottom) and all short-term SMAs are above the long-term EMAs (75-day, 90-day, 200-day), go long;
When the short-term SMAs (5-day, 13-day, 21-day) are arranged in order (5-day at the bottom, 13-day next, 21-day at the top) and all short-term SMAs are below the long-term EMAs (75-day, 90-day, 200-day), go short.
By combining SMAs and EMAs of different cycles, it can effectively judge short-term and long-term price trends to implement a trend-following strategy.
Advantage Analysis
The strategy has the following advantages:
Using dual moving average indicators can effectively filter market noise and accurately determine price trends.
Multi timeframe settings, with short cycles to determine short-term trends and long cycles to determine major trends, achieving fast with slow.
SMA is sensitive to price changes while EMA smoothes price changes, combining the two works better.
The logic of chasing rises and killing drops is simple and direct, easy to operate.
Risk Analysis
The strategy also has some risks:
Multi timeframe settings are quite complex with difficulties in parameter tuning and optimization.
Divergence may occur between short-term and long-term indicators, giving wrong signals.
Based solely on moving average indicators, may underperform in extreme market conditions.
There is a certain lag, unable to timely capture inflection points.
Optimization
The strategy can be optimized in the following aspects:
Add other technical indicators for signal filtering such as KDJ, MACD etc. to improve strategy accuracy.
Test and optimize periods and numbers of short-term and long-term moving averages to find optimal parameter combinations.
Add stop loss mechanisms to control risk and DD.
Combine volume indicators to avoid false breakouts under sharp price surges.
Conclusion
The strategy realizes simple and effective trend tracking by using dual moving averages and multi timeframe analysis. The strategy idea is clear and easy to understand with certain practical value. But there is still room for improvement such as parameter optimization, risk control etc. Overall, the strategy provides valuable ideas for quantitative trading, which is worth in-depth research and discussion.
Source Pine Script
/*backtest
start: 2023-11-12 00:00:00
end: 2023-12-05 00:00:00
period: 1h
basePeriod: 15m
exchanges: [{"eid":"Futures_Binance","currency":"BTC_USDT"}]
*/

//@version=4
strategy(title="my_strategy_name", shorttitle="MS1", overlay=true )


source = close


// MAのLongさ
len1 = 5
len2 = 13
len3 = 21

// MAのCalculate
ma1 = sma(source, len1)
ma2 = sma(source, len2)
ma3 = sma(source, len3)

// CalculateしたMAをプロットする
plot(ma1,color=color.red)
plot(ma2,color=color.orange)
plot(ma3,color=color.blue)

// EMAのLongさ
len4 = 75
len5 = 90
len6 = 200

// MAのCalculate
ema1 = ema(source, len4)
ema2 = ema(source, len5)
ema3 = ema(source, len6)

// CalculateしたMAをプロットする
plot(ema1,color=color.red)
plot(ema2,color=color.orange)
plot(ema3,color=color.blue)

longCondition = (ma1>ma2 and ma2>ma3 and ma3>ema1 and ema1>ema2 and ema2>ema3)//ロングにエントリーするcondition
if (longCondition)
    strategy.entry("My Long Entry", strategy.long, comment="Long")

shortCondition = (ma1<ma2 and ma2<ma3 and ma3<ema1 and ema1<ema2 and ema2<ema3)//ショートにエントリーするcondition
if (shortCondition)
    strategy.entry("My Short Entry", strategy.short, comment="Short")

    //エグジットcondition
strategy.exit("My Long Exit", "My Long Entry", profit=200, loss=100)
strategy.exit("My Short Exit", "My Short Entry", profit=200, loss=100)
Published by ChaoZhang on the FMZ strategy square · last modified 2023-12-13. Collected in the Quant Trading Vault. Unvalidated research: re-test with your own data and costs before trusting it.
Build this with AgenKit
A spec is not a trading system. Paste this into your coding agent and AgenKit runs a specialist team — architecture, test-first build, risk gates, review — with paper trading on by default.
/agenkit build a production-grade trading bot with a backtest engine, risk controls and paper trading by default from strategies/Multi-Timeframe-Moving-Average-Strategy.md- npx agenkit install engineering-kit in your project
- Paste the command into your agent and approve each phase
- Get tests, backtest, risk controls and a paper-trading switch
Understand it first
Before you run this, read the lesson behind the idea and how to backtest it honestly. Specs like this one are the survivors of an unknown number of trials; deflate their results accordingly.
Related specs
- EMA RSI and MACD Based Multi Timeframe Trading StrategyPine Script · Multi-timeframe · 1h
- MacD Custom Indicator Multiple Time FrameAll Available OptionsPine Script · Multi-timeframe · 1h
- CM MACD Custom Indicator Multiple Time Frame V2Pine Script · Multi-timeframe · 10m
- Multi Timeframe Adaptive Market Regime Quantitative Trading StrategyPine Script · Multi-timeframe · 1m
- Multi Timeframe Moving Average System Trading StrategyPine Script · Multi-timeframe · 4h
- Multi Timeframe Moving Average Trading StrategyPine Script · Multi-timeframe · 7d