Strategy vault / Trend following
Multi timeframe Super Trend Tracking Strategy
This strategy uses the ATR indicator to build a multi-timeframe dynamic trend channel to track trends. It generates signals when prices break through the channel by continuously adjusting the channel to capture…
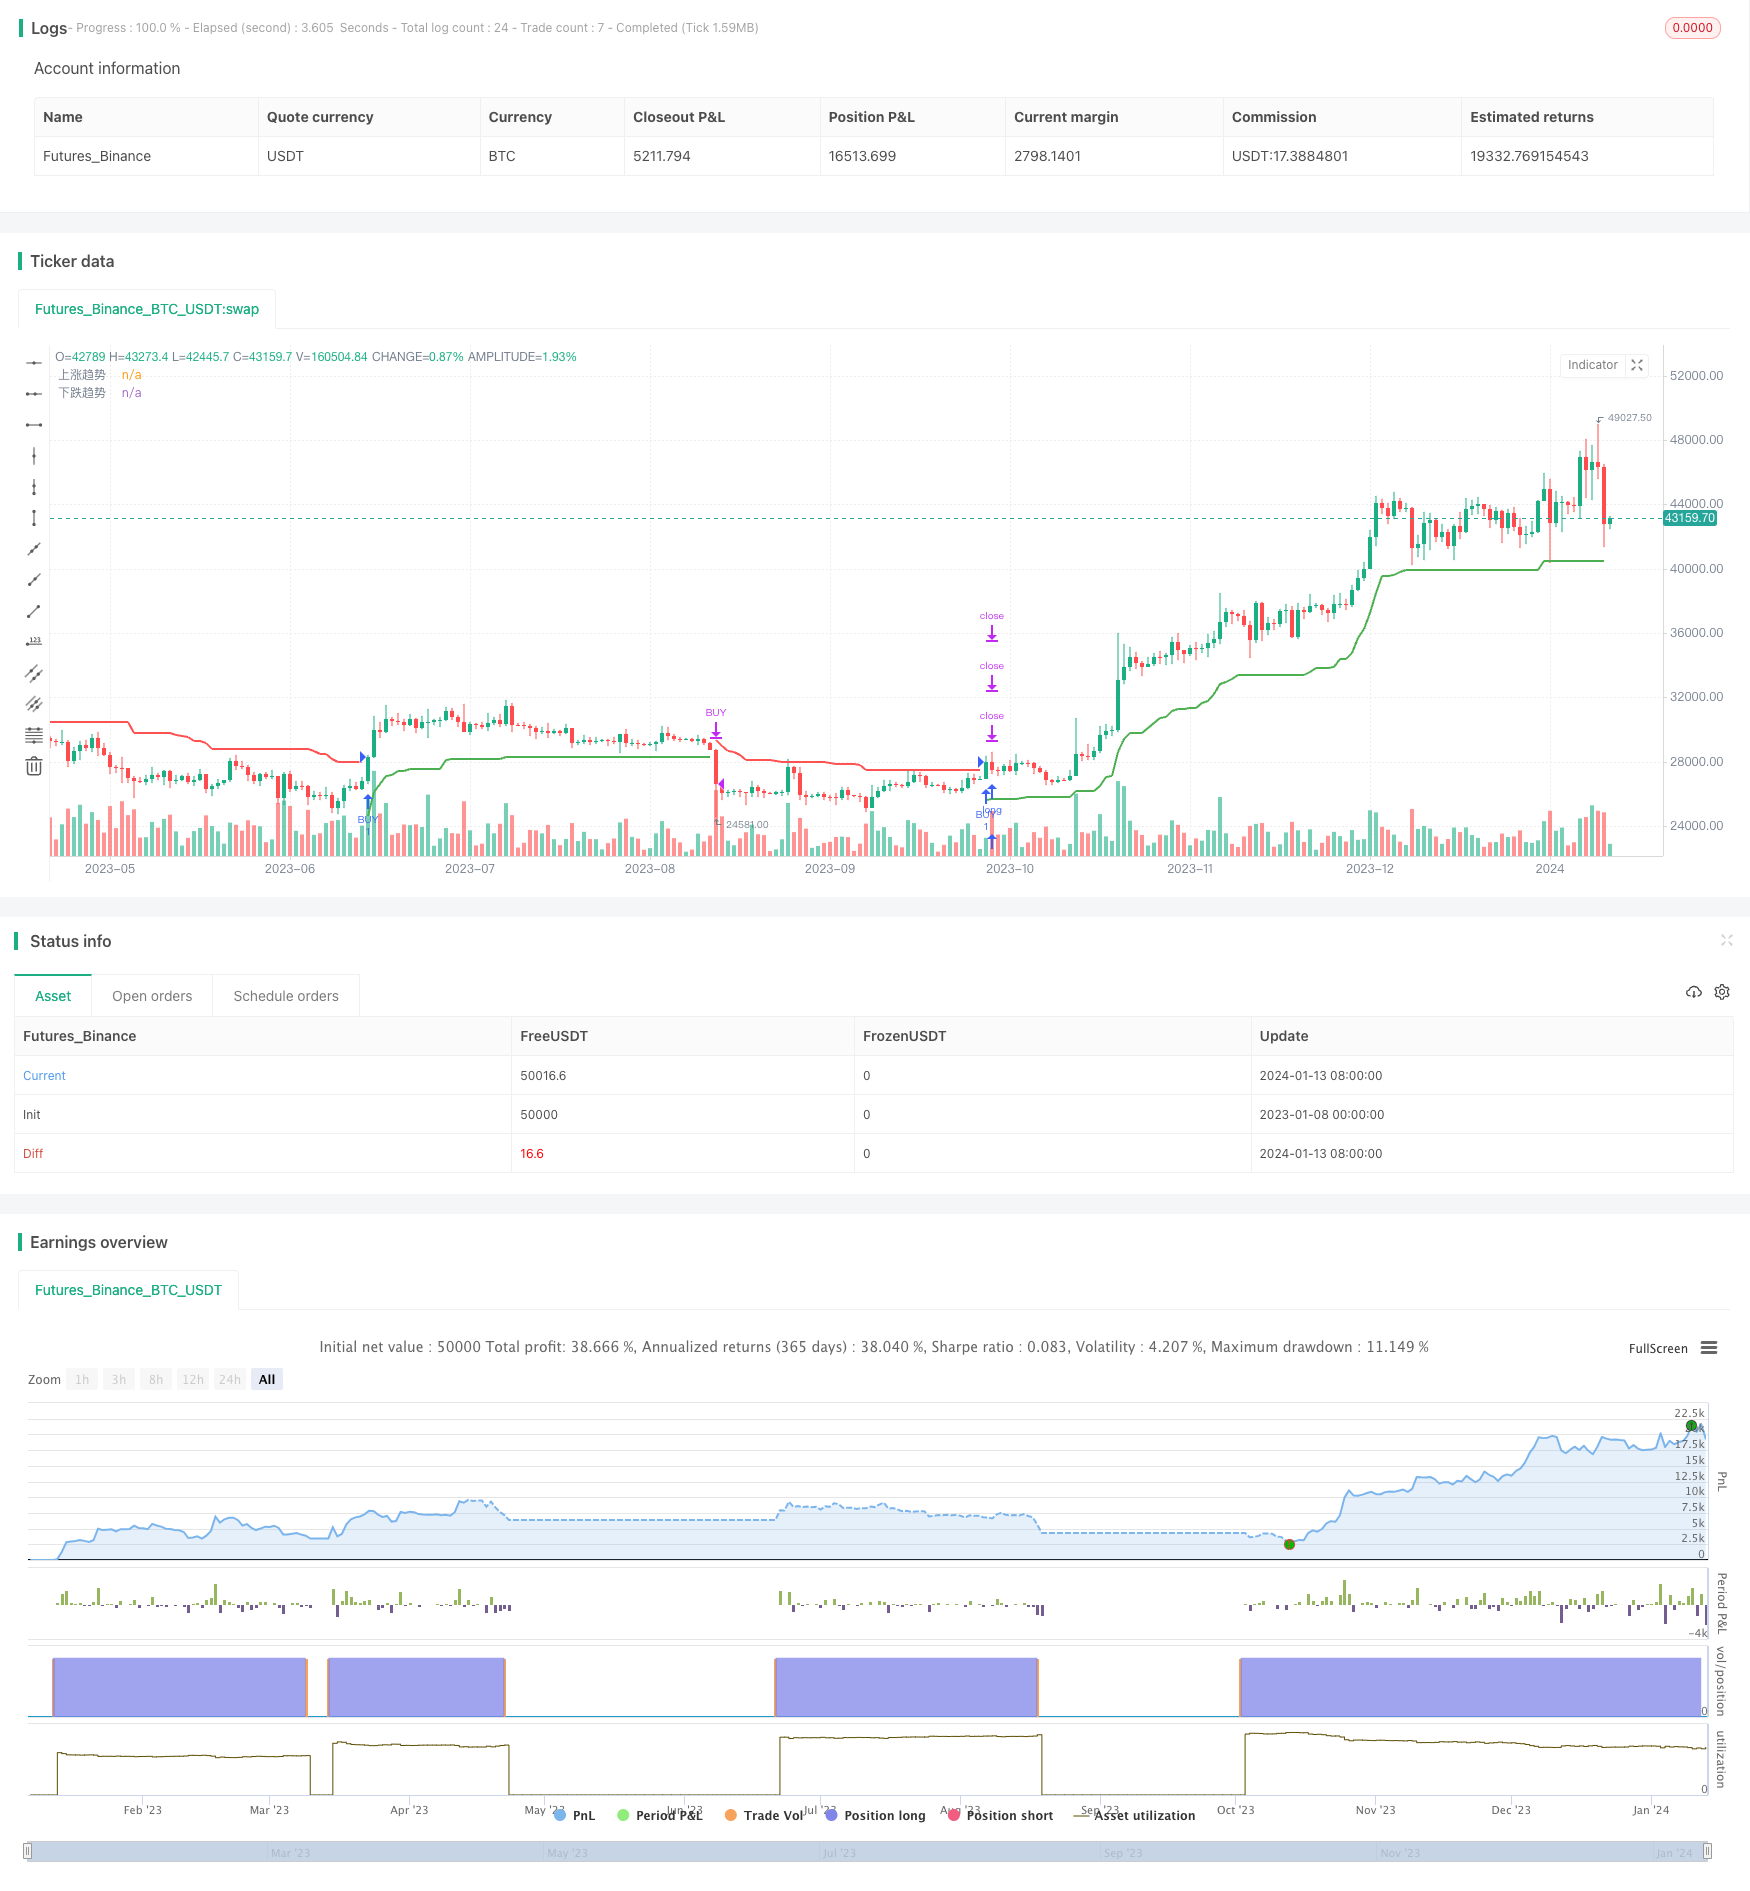
Overview
This strategy uses the ATR indicator to build a multi-timeframe dynamic trend channel to track trends. It generates signals when prices break through the channel by continuously adjusting the channel to capture larger trends.
Strategy Logic
The strategy uses the ATR indicator to build an uptrend channel and a downtrend channel. Specifically, the uptrend channel line is the closing price minus N times the ATR indicator; the downtrend channel line is the closing price plus N times the ATR indicator. The N value can be adjusted through parameters.
When the price breaks through the uptrend channel, a buy signal is generated; when the price breaks through the downtrend channel, a sell signal is generated. The channel dynamically adjusts based on the latest prices to track trends.
In addition, the strategy also defines a trend variable to determine whether the current is in an uptrend or a downtrend. The trend variable works with the channel lines to avoid generating wrong signals.
Advantages
- Uses dynamic channels to track trends and trade along with trends
- Avoids chasing highs and selling lows, reducing the risk of market reversal
- Adjustable channel parameters, high adaptability
- More flexible multi-timeframe settings
Risks
- Overly aggressive tracking may increase loss risk
- Improper channel parameter settings lead to fewer or more incorrect signals
- Requires strong programming skills to adjust parameters
Improvement:
- Appropriately reduce ATR multiplier to lower tracking magnitude
- Optimize parameters to find the best combination
- Add stop loss strategy to reduce per trade loss
Optimization Directions
- Add other indicators for filter for more reliable signals
- Add stop loss strategy to reduce risk
- Conduct parameter optimization to find optimum
- Optimize entry and exit timing to improve profit rate
Summary
Overall this is a decent trend tracking strategy. It dynamically adjusts to trade along with trends and avoids chasing highs and selling lows. With parameter optimization and proper improvements, the strategy advantages can be further enhanced and risks reduced to achieve better results.
Parameters
| Name | Default | What it controls |
|---|---|---|
| v_input_1 | 10 | ATRtimeframe |
| v_input_2_hl2 | 0 | Price data source: hl2 | high | low | open | close | hlc3 | hlcc4 | ohlc4 |
| v_input_float_1 | 3 | ATR Multiplier |
| v_input_3 | true | Change ATR calculation method |
| v_input_4 | false | Show buy/sell signals |
| v_input_int_1 | 9 | From Month |
| v_input_int_2 | true | From Day |
| v_input_int_3 | 2018 | From Year |
| v_input_int_4 | true | To Month |
| v_input_int_5 | true | To Day |
| v_input_int_6 | 9999 | To Year |
Source Pine Script
/*backtest
start: 2023-01-08 00:00:00
end: 2024-01-14 00:00:00
period: 1d
basePeriod: 1h
exchanges: [{"eid":"Futures_Binance","currency":"BTC_USDT"}]
*/

//@version=5
strategy('Supertrend simplified optimized version', overlay=true)
Periods = input(title='ATRtimeframe', defval=10)
src = input(hl2, title='Price data source')
Multiplier = input.float(title='ATR Multiplier', step=0.1, defval=3.0)
changeATR = input(title='Change ATR calculation method', defval=true,tooltip = 'Default is art otherwise sma(ta.tr,ATR period)')
showsignals = input(title='Show buy/sell signals', defval=false)
atr2 = ta.sma(ta.tr, Periods)
atr = changeATR ? ta.atr(Periods) : atr2
up = src - Multiplier * atr
up1 = nz(up[1], up)
up := close[1] > up1 ? math.max(up, up1) : up
dn = src + Multiplier * atr
dn1 = nz(dn[1], dn)
dn := close[1] < dn1 ? math.min(dn, dn1) : dn
trend = 1
trend := nz(trend[1], trend)
trend := trend == -1 and close > dn1 ? 1 : trend == 1 and close < up1 ? -1 : trend
upPlot = plot(trend == 1 ? up : na, title='Uptrend', style=plot.style_linebr, linewidth=2, color=color.new(color.green, 0))
buySignal = trend == 1 and trend[1] == -1
plotshape(buySignal and showsignals ? up : na, title='Buy some', text='Buy some', location=location.absolute, style=shape.labelup, size=size.tiny, color=color.new(color.green, 0), textcolor=color.new(color.white, 0))
dnPlot = plot(trend == 1 ? na : dn, title='Downtrend', style=plot.style_linebr, linewidth=2, color=color.new(color.red, 0))
sellSignal = trend == -1 and trend[1] == 1
plotshape(sellSignal and showsignals ? dn : na, title='Selling Points', text='Selling Points', location=location.absolute, style=shape.labeldown, size=size.tiny, color=color.new(color.red, 0), textcolor=color.new(color.white, 0))
FromMonth = input.int(defval=9, title='From Month', minval=1, maxval=12)
FromDay = input.int(defval=1, title='From Day', minval=1, maxval=31)
FromYear = input.int(defval=2018, title='From Year', minval=999)
ToMonth = input.int(defval=1, title='To Month', minval=1, maxval=12)
ToDay = input.int(defval=1, title='To Day', minval=1, maxval=31)
ToYear = input.int(defval=9999, title='To Year', minval=999)
start = timestamp(FromYear, FromMonth, FromDay, 00, 00)
finish = timestamp(ToYear, ToMonth, ToDay, 23, 59)
window() =>
    time >= start and time <= finish ? true : false
longCondition = buySignal
if longCondition and window()
    strategy.entry('BUY', strategy.long, comment = 'buy')
shortCondition = sellSignal
if shortCondition and window()
    strategy.close('BUY',comment = 'sell')
buy1 = ta.barssince(buySignal)
sell1 = ta.barssince(sellSignal)
color1 = buy1[1] < sell1[1] ? color.green : buy1[1] > sell1[1] ? color.red : na
Published by ChaoZhang on the FMZ strategy square · last modified 2024-01-15. Collected in the Quant Trading Vault. Unvalidated research: re-test with your own data and costs before trusting it.
Build this with AgenKit
A spec is not a trading system. Paste this into your coding agent and AgenKit runs a specialist team — architecture, test-first build, risk gates, review — with paper trading on by default.
/agenkit build a production-grade trading bot with a backtest engine, risk controls and paper trading by default from strategies/Multi-timeframe-Super-Trend-Tracking-Strategy.md- npx agenkit install engineering-kit in your project
- Paste the command into your agent and approve each phase
- Get tests, backtest, risk controls and a paper-trading switch
Understand it first
Before you run this, read the lesson behind the idea and how to backtest it honestly. Specs like this one are the survivors of an unknown number of trials; deflate their results accordingly.
Related specs
- Multi Indicator Dynamic Trend Following Strategy Based on EMA and SMAPine Script · Trend following · 1d
- Super trend BPine Script · Trend following · 4h
- SuperTrend Dual Direction StrategyPine Script · Trend following · 3d
- Supertrend Advance StrategyPine Script · Trend following · 5m
- Supertrend and Moving Average Crossover StrategyPine Script · Trend following · 2h
- Trading the Equity Curve Position Sizing ExamplePine Script · Trend following · 15m