Multi Trendline Breakout Momentum Quantitative Strategy
This strategy is an intelligent trading system based on multiple trendline breakouts. It dynamically identifies key support and resistance levels, combines multiple technical indicators to calculate trendline slopes…
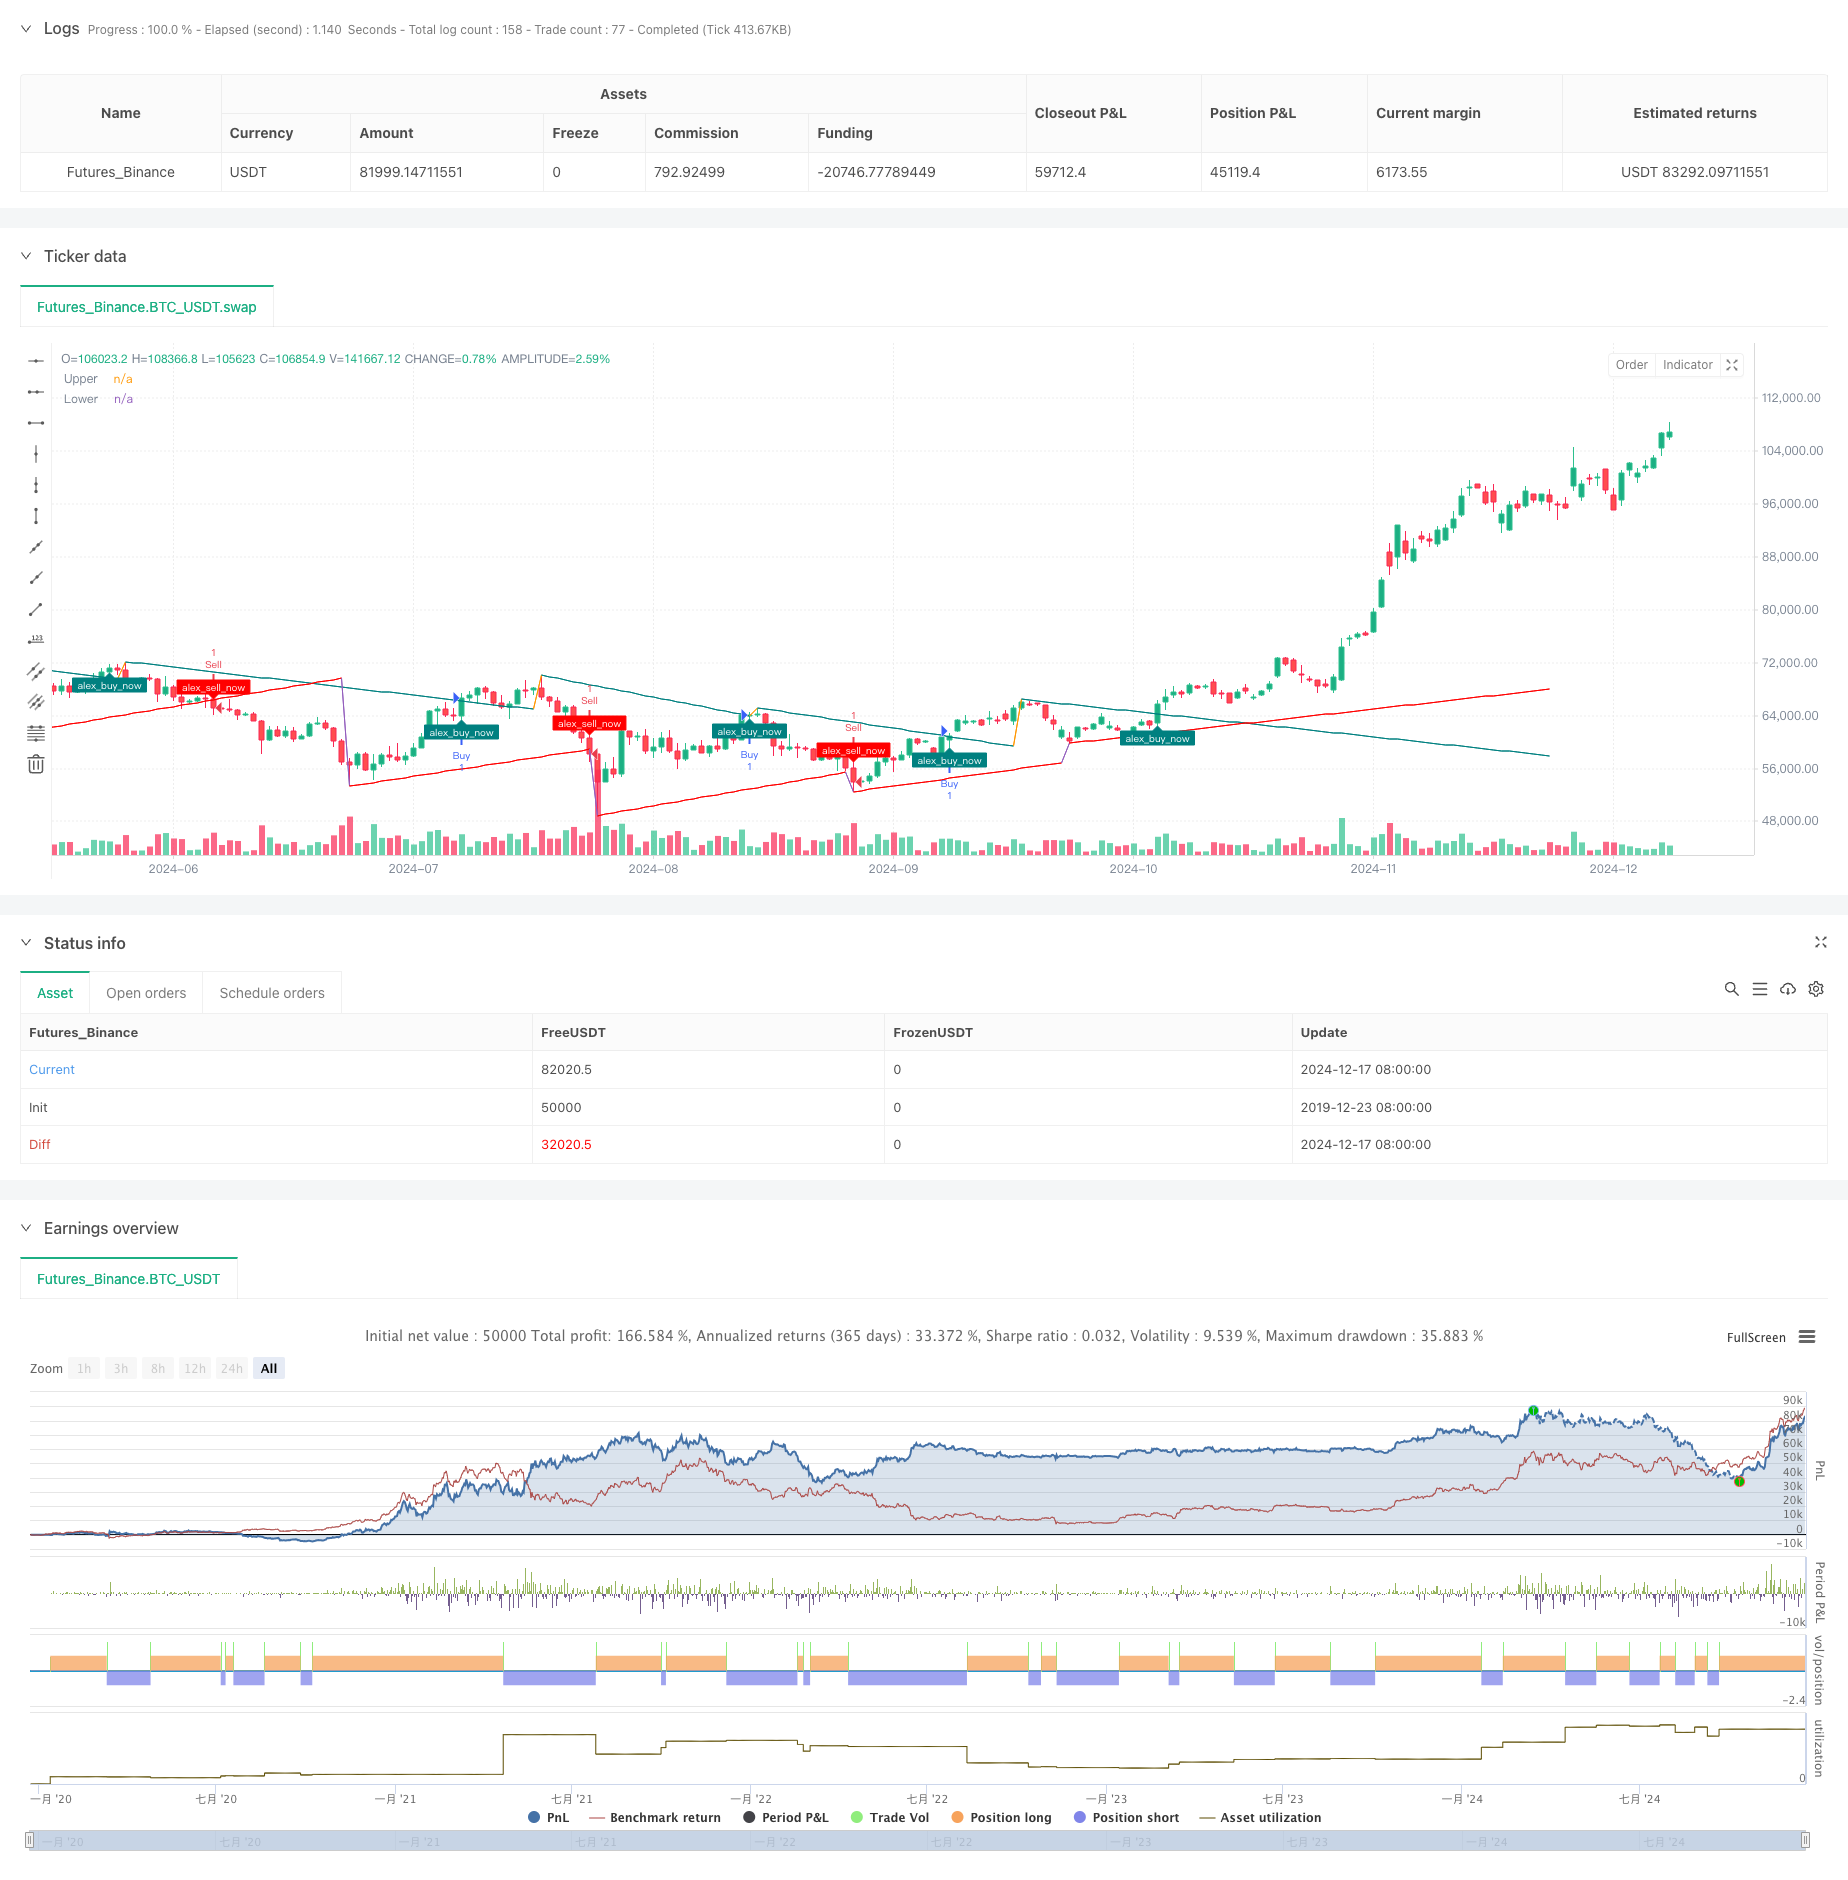
Strategy Overview
This strategy is an intelligent trading system based on multiple trendline breakouts. It dynamically identifies key support and resistance levels, combines multiple technical indicators to calculate trendline slopes, and executes trades when prices break through trendlines. The strategy not only captures market trend turning points but can also be optimized to adapt to different market conditions.
Strategy Principles
The core logic includes three main components: First, it identifies key highs and lows using a lookback period to establish initial support and resistance levels; Second, it dynamically calculates trendline slopes based on the chosen method (ATR, Standard Deviation, or Linear Regression) to better adapt to market volatility; Finally, it monitors price relationships with trendlines and triggers trading signals upon breakouts. The system also includes mechanisms to prevent backtest overfitting through the backpainting parameter, simulating real trading conditions.
Strategy Advantages
- High Adaptability: Through multiple slope calculation methods and adjustable parameters, the strategy can adapt to different market environments
- Robust Risk Control: Dynamic adjustment capability of trendlines helps identify trend changes promptly, reducing losses from false breakouts
- Excellent Visualization: Strategy provides clear visual feedback, including trendline extensions and breakout markers
- Signal Confirmation Mechanism: Uses multiple condition verification to ensure trading signal reliability
Strategy Risks
- May generate false signals during extreme market volatility
- Trendline calculation latency might lead to slightly delayed entry points
- Improper parameter selection could result in overtrading or missing important opportunities
- Frequent false breakout signals may occur in ranging markets
Strategy Optimization Directions
- Incorporate volume indicators to verify breakout validity
- Add market volatility filters to adjust parameters during high volatility periods
- Integrate additional technical indicators to improve signal accuracy
- Develop adaptive parameter adjustment mechanisms
- Implement intelligent stop-loss and profit-taking calculation methods
Summary
The strategy builds a reliable trendline breakout trading system by comprehensively utilizing various technical analysis methods. Its strength lies in the ability to dynamically adapt to market changes while providing clear trading signals. Although some inherent risks exist, the strategy's stability and profitability can be significantly improved through proper parameter settings and continuous optimization.
Source Pine Script
/*backtest
start: 2019-12-23 08:00:00
end: 2024-12-18 08:00:00
period: 1d
basePeriod: 1d
exchanges: [{"eid":"Futures_Binance","currency":"BTC_USDT"}]
*/

// This Pine Script™ code is subject to the terms of the Mozilla Public License 2.0 at https://mozilla.org/MPL/2.0/
// © Alexgoldhunter

//@version=5
strategy("Trendlines with Breaks Strategy [AlexGoldHunter]", overlay=true)

// Input parameters
length = input.int(14, title="Swing Detection Lookback")
mult = input.float(1.0, title="Slope", minval=0, step=0.1)
calcMethod = input.string('Atr', title="Slope Calculation Method", options=['Atr','Stdev','Linreg'])
backpaint = input(true, tooltip='Backpainting offset displayed elements in the past. Disable backpainting to see real-time information returned by the indicator.')

// Style settings
upCss = input.color(color.teal, title="Up Trendline Color", group="Style")
dnCss = input.color(color.red, title="Down Trendline Color", group="Style")
showExt = input(true, title="Show Extended Lines")

// Calculations
var upper = 0.0
var lower = 0.0
var slope_ph = 0.0
var slope_pl = 0.0

var offset = backpaint ? length : 0

n = bar_index
src = close

ph = ta.pivothigh(length, length)
pl = ta.pivotlow(length, length)

// Slope Calculation Method
slope = switch calcMethod
    'Atr'    => ta.atr(length) / length * mult
    'Stdev'  => ta.stdev(src, length) / length * mult
    'Linreg' => math.abs(ta.sma(src * n, length) - ta.sma(src, length) * ta.sma(n, length)) / ta.variance(n, length) / 2 * mult

// Get slopes and calculate trendlines
slope_ph := ph ? slope : slope_ph
slope_pl := pl ? slope : slope_pl

upper := ph ? ph : upper - slope_ph
lower := pl ? pl : lower + slope_pl

var upos = 0
var dnos = 0
upos := ph ? 0 : close > upper - slope_ph * length ? 1 : upos
dnos := pl ? 0 : close < lower + slope_pl * length ? 1 : dnos

// Extended Lines
// var uptl  = line.new(na, na, na, na, color=upCss, style=line.style_dashed, extend=extend.right)
// var dntl  = line.new(na, na, na, na, color=dnCss, style=line.style_dashed, extend=extend.right)

// if ph and showExt
//     uptl.set_xy1(n - offset, backpaint ? ph : upper - slope_ph * length)
//     uptl.set_xy2(n - offset + 1, backpaint ? ph - slope : upper - slope_ph * (length + 1))

// if pl and showExt
//     dntl.set_xy1(n - offset, backpaint ? pl : lower + slope_pl * length)
//     dntl.set_xy2(n - offset + 1, backpaint ? pl + slope : lower + slope_pl * (length + 1))

// Plots
plot(backpaint ? upper : upper - slope_ph * length, title="Upper", color=ph ? na : upCss, offset=-offset)
plot(backpaint ? lower : lower + slope_pl * length, title="Lower", color=pl ? na : dnCss, offset=-offset)

// Breakouts
plotshape(upos > upos[1] ? low : na, title="Upper Break",
  style=shape.labelup, location=location.absolute, color=upCss, text="alex_buy_now", textcolor=color.white, size=size.tiny)
plotshape(dnos > dnos[1] ? high : na, title="Lower Break",
  style=shape.labeldown, location=location.absolute, color=dnCss, text="alex_sell_now", textcolor=color.white, size=size.tiny)

// Strategy: Buy and Sell conditions
if (upos > upos[1])
    strategy.entry("Buy", strategy.long)
if (dnos > dnos[1])
    strategy.entry("Sell", strategy.short)

// Alerts
alertcondition(upos > upos[1], title="Upward Breakout", message="Price broke the down-trendline upward")
alertcondition(dnos > dnos[1], title="Downward Breakout", message="Price broke the up-trendline downward")
Published by ChaoZhang on the FMZ strategy square · last modified 2024-12-20. Collected in the Quant Trading Vault. Unvalidated research: re-test with your own data and costs before trusting it.
Build this with AgenKit
A spec is not a trading system. Paste this into your coding agent and AgenKit runs a specialist team — architecture, test-first build, risk gates, review — with paper trading on by default.
/agenkit build a production-grade trading bot with a backtest engine, risk controls and paper trading by default from strategies/Multi-Trendline-Breakout-Momentum-Quantitative-Strategy.md- npx agenkit install engineering-kit in your project
- Paste the command into your agent and approve each phase
- Get tests, backtest, risk controls and a paper-trading switch
Understand it first
Before you run this, read the lesson behind the idea and how to backtest it honestly. Specs like this one are the survivors of an unknown number of trials; deflate their results accordingly.
Related specs
- Kana Candle Breakout Strategy Based on Moving Average and Support ResistancePine Script · Breakout · 1h
- Momentum Breakout Moving Average StrategyPine Script · Breakout · 1d
- Momentum Breakout Trading Strategy 435896Pine Script · Breakout · 1d
- Moving Average Crossover and Upper Rail Breakthrough Impulse StrategyPine Script · Breakout · 1m
- Pivot Point Detection with Bollinger Band Oscillation StrategyPine Script · Breakout · 1h
- Quantitative Trading Strategy Based on Ichimoku with Multiple SignalsPine Script · Breakout · 1h