Strategy vault / Trend following
Multi Wave Trend Crossing Risk Management Quantitative Strategy
This strategy is a quantitative trading system based on the WaveTrend indicator, incorporating dynamic risk management mechanisms. The strategy calculates trend strength through price fluctuations, filters signals in…
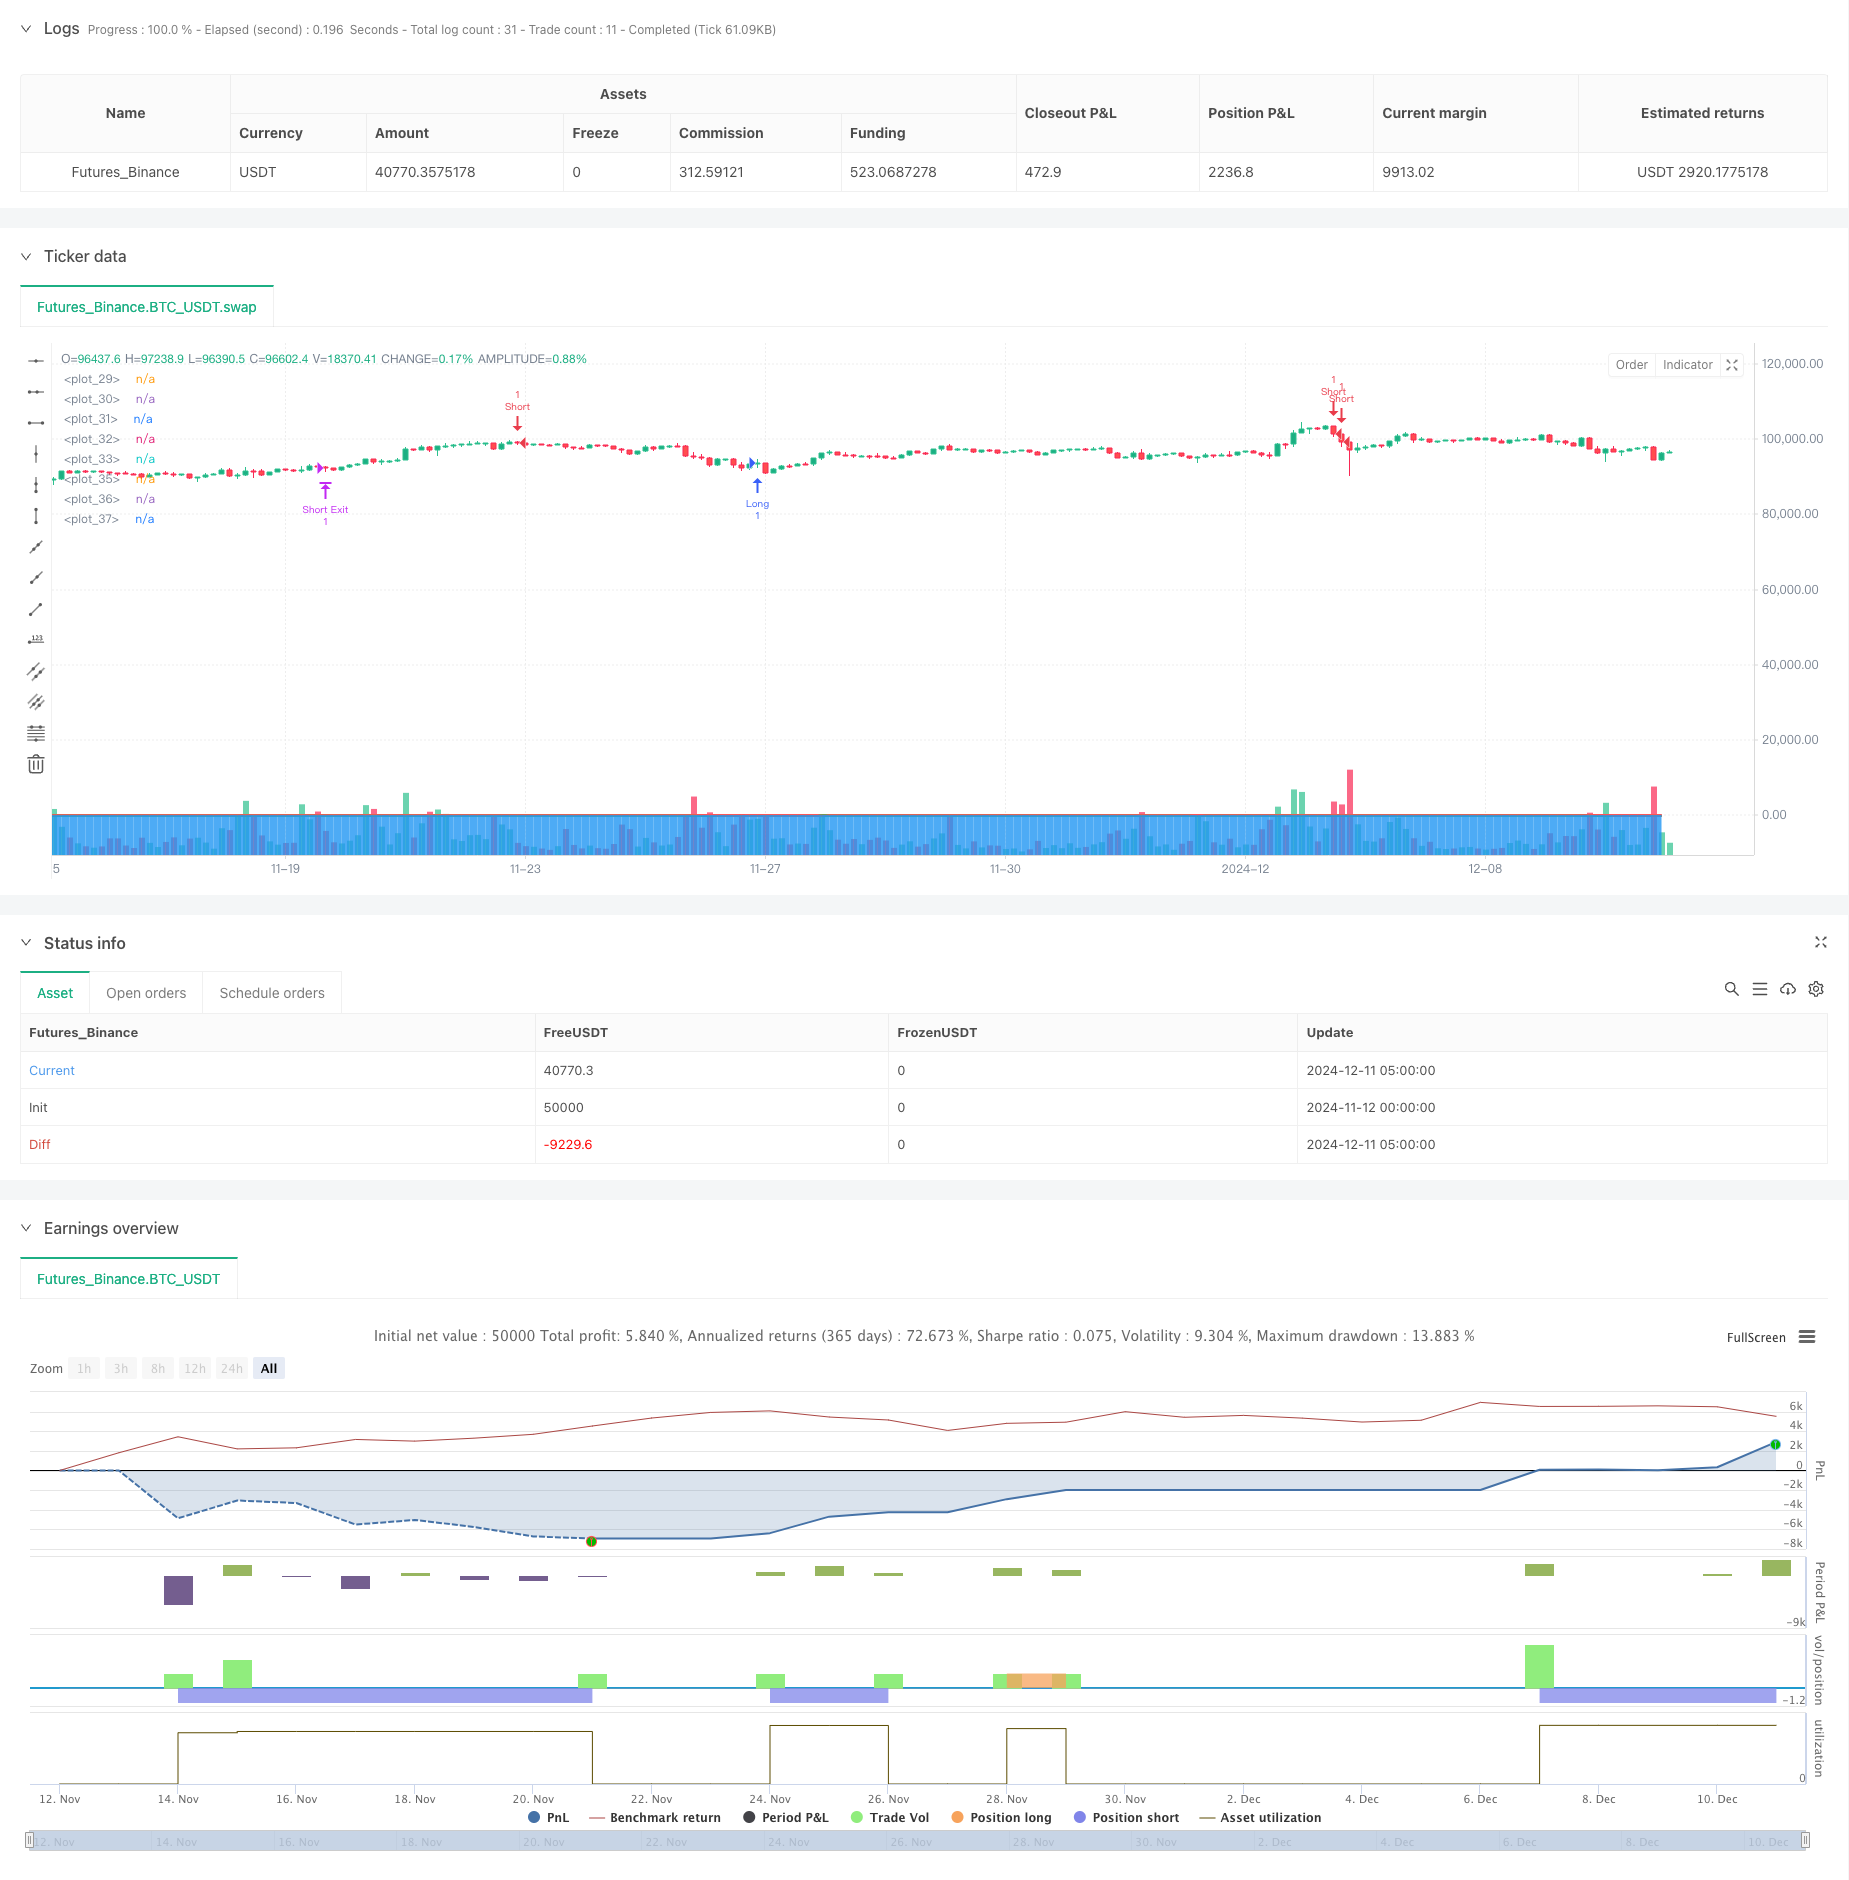
Overview
This strategy is a quantitative trading system based on the WaveTrend indicator, incorporating dynamic risk management mechanisms. The strategy calculates trend strength through price fluctuations, filters signals in overbought and oversold regions, and applies risk control measures including stop-loss, take-profit, and trailing stop mechanisms.
Strategy Principles
The core of the strategy lies in calculating the WaveTrend indicator using HLC3 prices. It first computes an n1-period exponential moving average (EMA) as a baseline, then calculates price deviations from this baseline, normalizing them with a 0.015 coefficient. This results in two wave lines, wt1 and wt2, representing fast and slow lines respectively. Trading signals are generated based on these lines crossing overbought and oversold levels, combined with a multi-layered risk control system.
Strategy Advantages
- The signal system demonstrates excellent trend-following capabilities with enhanced reliability through dual overbought/oversold levels
- Comprehensive risk management system including fixed stop-loss, take-profit, and dynamic trailing stop
- Highly adjustable parameters for optimization across different market conditions
- Incorporates volatility-adaptive mechanisms for improved adaptability
- Layered signal system design effectively reduces the impact of false signals
Strategy Risks
- Frequent stop-losses may occur in highly volatile markets
- Improper parameter settings can lead to excessive trading costs
- May generate excessive false signals in ranging markets
- Requires careful calibration of stop-loss and take-profit ratios to maintain risk-reward balance
- Trailing stops might result in significant drawdowns during quick market reversals
Optimization Directions
- Incorporate volume indicators for signal confirmation to enhance trading reliability
- Optimize trailing stop parameters for better adaptation to various market conditions
- Add trend strength filters to reduce trading frequency in ranging markets
- Consider implementing dynamic stop-loss mechanisms that automatically adjust based on market volatility
- Introduce time filters to avoid entering positions during unfavorable trading periods
Summary
This strategy achieves a comprehensive quantitative trading approach by combining the WaveTrend indicator with a robust risk management system. Its core strengths lie in its adaptability and controlled risk exposure, though traders need to optimize parameters and improve the strategy based on actual market conditions. Through continuous optimization and refinement, this strategy shows promise for achieving stable returns in real trading environments.
Source Pine Script
/*backtest
start: 2024-11-12 00:00:00
end: 2024-12-11 08:00:00
period: 3h
basePeriod: 3h
exchanges: [{"eid":"Futures_Binance","currency":"BTC_USDT"}]
*/

//@version=5
strategy(title="WaveTrend [LazyBear] with Risk Management", shorttitle="WT_LB_RM", overlay=true)

// Input Parameters
n1 = input.int(10, "Channel Length")
n2 = input.int(21, "Average Length")
obLevel1 = input.int(60, "Over Bought Level 1")
obLevel2 = input.int(53, "Over Bought Level 2")
osLevel1 = input.int(-60, "Over Sold Level 1")
osLevel2 = input.int(-53, "Over Sold Level 2")

// Risk Management Inputs
stopLossPercent = input.float(50.0, "Stop Loss (%)", minval=0.1, maxval=100)
takeProfitPercent = input.float(5.0, "Take Profit (%)", minval=0.1, maxval=100)
trailingStopPercent = input.float(3.0, "Trailing Stop (%)", minval=0.1, maxval=100)
trailingStepPercent = input.float(2.0, "Trailing Stop Step (%)", minval=0.1, maxval=100)

// WaveTrend Calculation
ap = hlc3
esa = ta.ema(ap, n1)
d = ta.ema(math.abs(ap - esa), n1)
ci = (ap - esa) / (0.015 * d)
tci = ta.ema(ci, n2)

wt1 = tci
wt2 = ta.sma(wt1, 4)

// Plotting Original Indicators
plot(0, color=color.gray)
plot(obLevel1, color=color.red)
plot(osLevel1, color=color.green)
plot(obLevel2, color=color.red, style=plot.style_line)
plot(osLevel2, color=color.green, style=plot.style_line)

plot(wt1, color=color.green)
plot(wt2, color=color.red, style=plot.style_line)
plot(wt1-wt2, color=color.blue, style=plot.style_area, transp=80)

// Buy and Sell Signals with Risk Management
longCondition = ta.crossover(wt1, osLevel1) or ta.crossover(wt1, osLevel2)
shortCondition = ta.crossunder(wt1, obLevel1) or ta.crossunder(wt1, obLevel2)

// Strategy Entry with Risk Management
if (longCondition)
    entryPrice = close
    stopLossPrice = entryPrice * (1 - stopLossPercent/100)
    takeProfitPrice = entryPrice * (1 + takeProfitPercent/100)

    strategy.entry("Long", strategy.long)
    strategy.exit("Long Exit", "Long",
                  stop=stopLossPrice,
                  limit=takeProfitPrice,
                  trail_price=close * (1 + trailingStopPercent/100),
                  trail_offset=close * (trailingStepPercent/100))

if (shortCondition)
    entryPrice = close
    stopLossPrice = entryPrice * (1 + stopLossPercent/100)
    takeProfitPrice = entryPrice * (1 - takeProfitPercent/100)

    strategy.entry("Short", strategy.short)
    strategy.exit("Short Exit", "Short",
                  stop=stopLossPrice,
                  limit=takeProfitPrice,
                  trail_price=close * (1 - trailingStopPercent/100),
trail_offset=close * (trailingStepPercent/100))Published by ChaoZhang on the FMZ strategy square · last modified 2024-12-13. Collected in the Quant Trading Vault. Unvalidated research: re-test with your own data and costs before trusting it.
Build this with AgenKit
A spec is not a trading system. Paste this into your coding agent and AgenKit runs a specialist team — architecture, test-first build, risk gates, review — with paper trading on by default.
/agenkit build a production-grade trading bot with a backtest engine, risk controls and paper trading by default from strategies/Multi-Wave-Trend-Crossing-Risk-Management-Quantitative-Strategy.md- npx agenkit install engineering-kit in your project
- Paste the command into your agent and approve each phase
- Get tests, backtest, risk controls and a paper-trading switch
Understand it first
Before you run this, read the lesson behind the idea and how to backtest it honestly. Specs like this one are the survivors of an unknown number of trials; deflate their results accordingly.
Related specs
- ADX MA and EMA Long Only Trend Tracking StrategyPine Script · Trend following · 1d
- ATR and Moving Average Crossover Hybrid StrategyPine Script · Trend following · 1h
- Bollinger Band Moving Average Crossover StrategyPine Script · Trend following · 1h
- Bollinger Bands and EMA Trend Following StrategyPine Script · Trend following · 1h
- Bollinger Bands and RSI Trend Following StrategyPine Script · Trend following · 1h
- Candlestick Pattern Trend Filter StrategyPine Script · Trend following · 1d