Strategy vault / Machine learning
Multiple Moving Average Trading Strategy
The strategy is named "Multiple Moving Average Trading Strategy". It utilizes the crossover of the MACD indicator and multiple moving averages as trading signals, with the assistance of the ZLSMA indicator to…
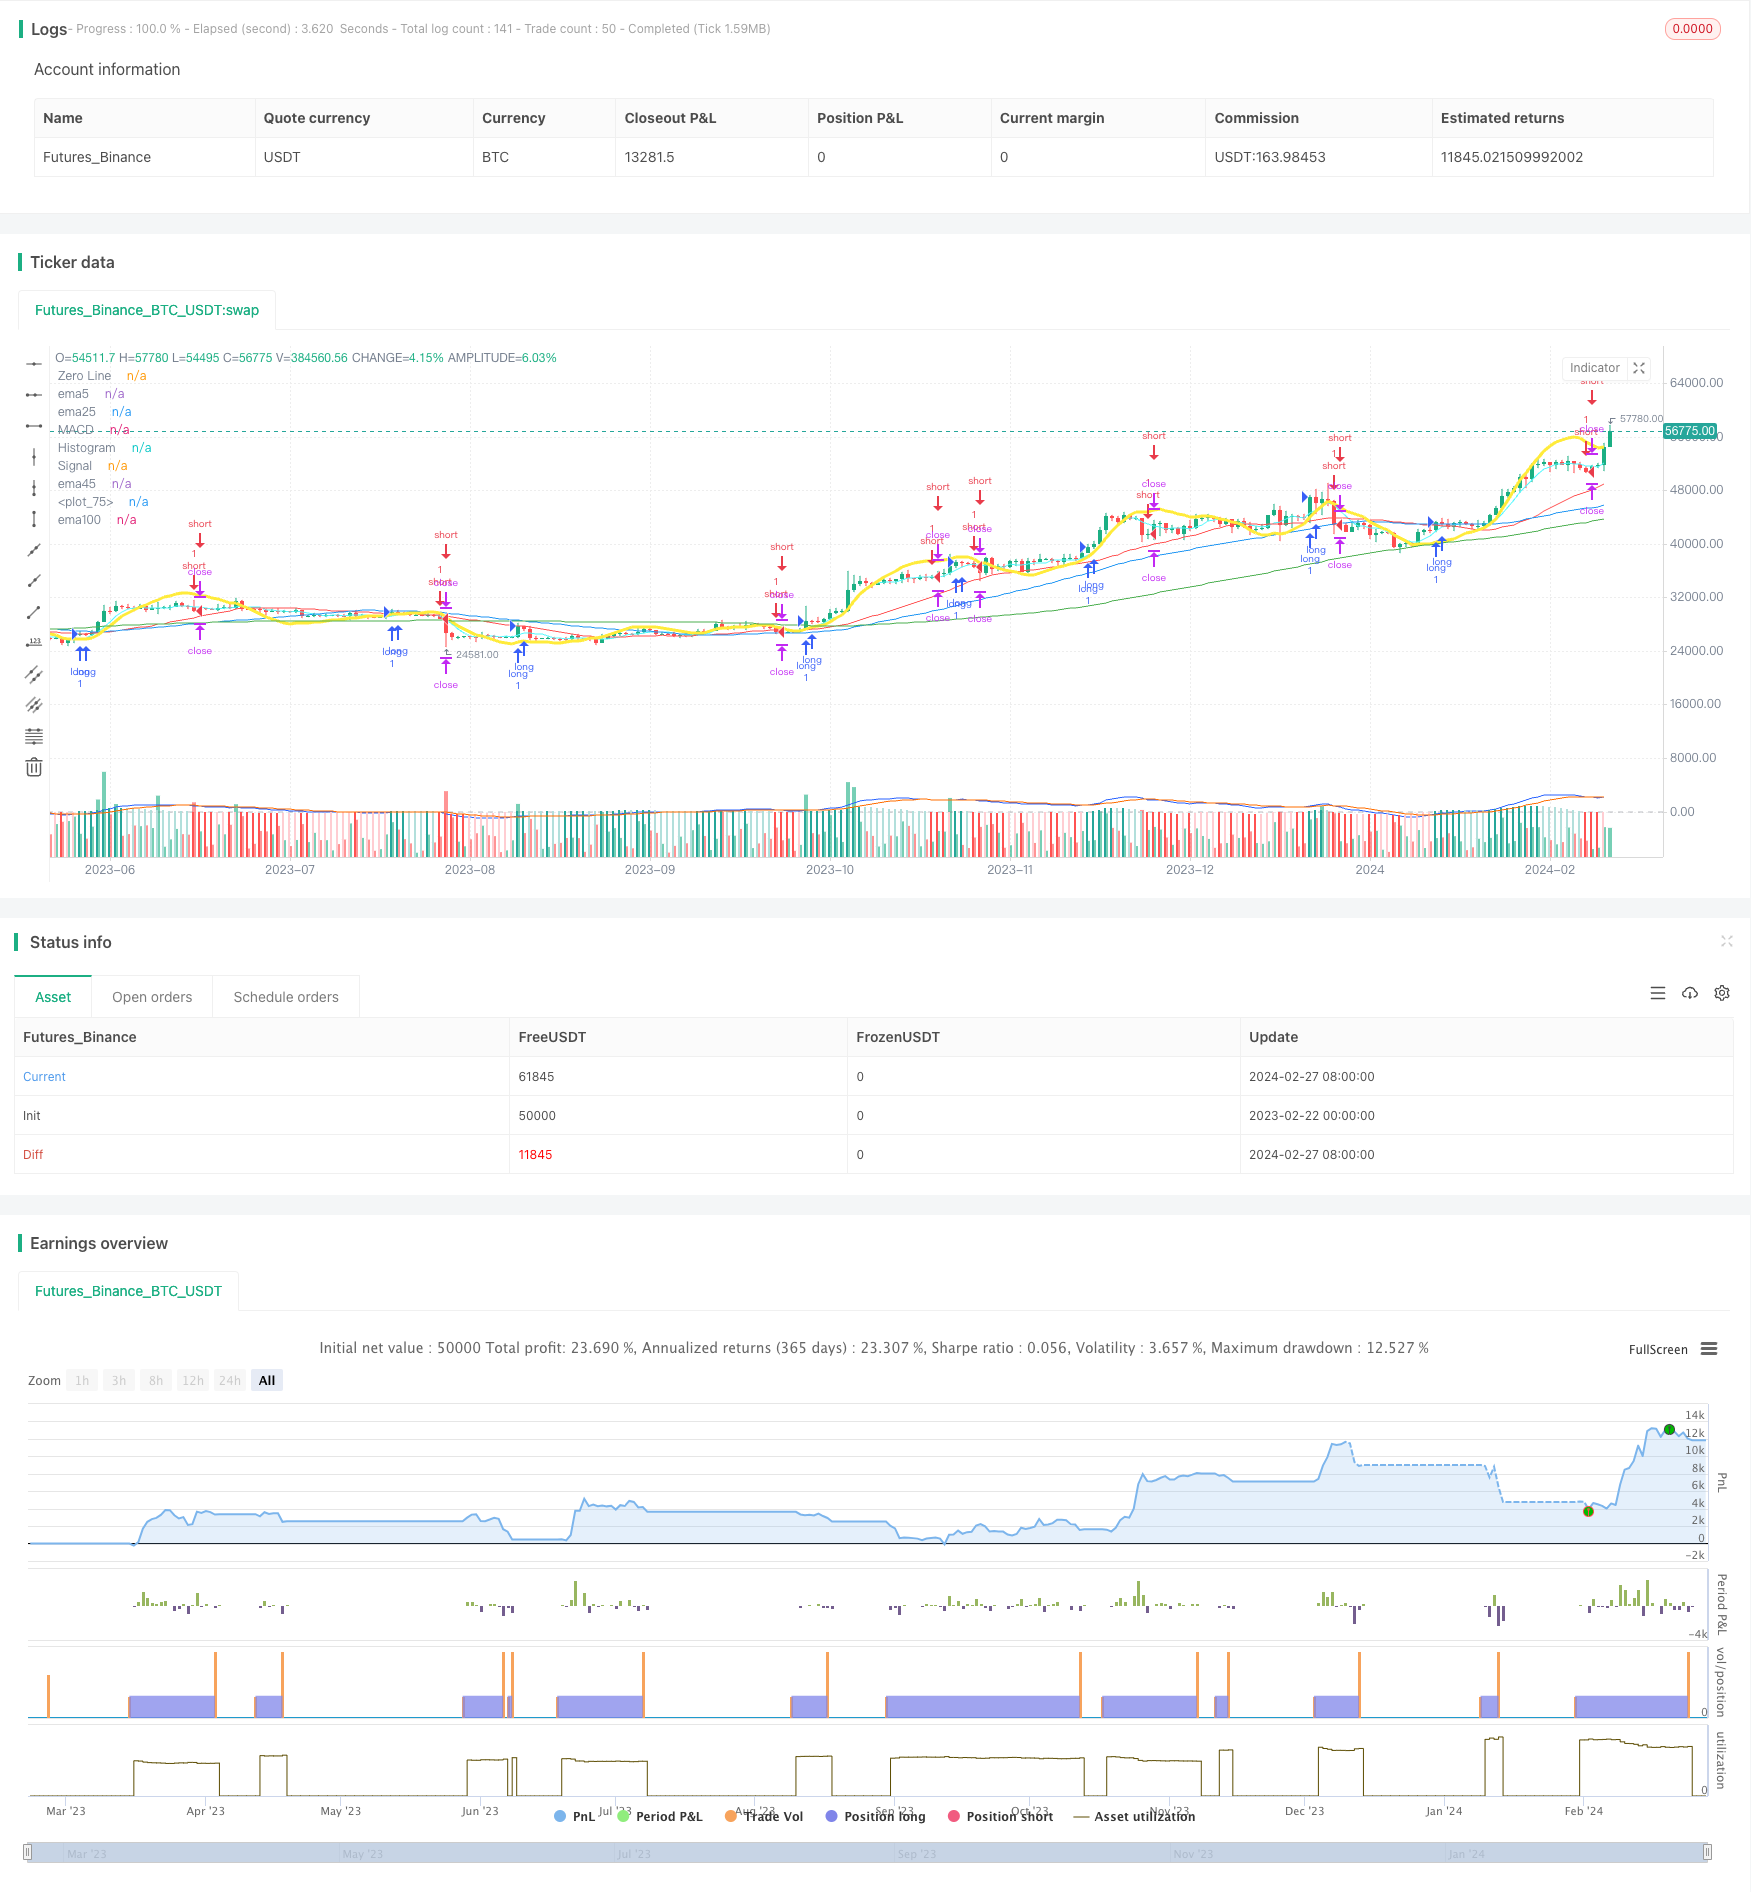
Overview
The strategy is named "Multiple Moving Average Trading Strategy". It utilizes the crossover of the MACD indicator and multiple moving averages as trading signals, with the assistance of the ZLSMA indicator to determine the trend, and sets the profit-taking and stop-loss exiting logic to realize automated trading.
Strategy Principle
Calculate the fast line, slow line and MACD histogram of the MACD indicator. Set long when seeing golden cross and short when seeing death cross.
Calculate the 5-day, 25-day, 45-day and 100-day moving averages. The longer the moving average, the stronger the trend sustainability it represents.
Calculate the distance between the two groups of moving averages. If the distance exceeds a certain threshold, it means the divergence of the moving averages, which can be set as trading signals.
Calculate the ZLSMA indicator, representing the mid-to-long term trend direction of the price. Trend reversals can be determined when ZLSMA forms turning points.
Combine the MACD crossover, moving average divergence signals and ZLSMA trend judgment to set long and short trading strategies.
Set take profit and stop loss points to realize automated exiting logic.
Advantage Analysis
Multi-filter signals improve strategy efficiency. MACD and moving average divergence signals can verify each other to avoid false breakouts.
ZLSMA assists in determining the medium and long term trend direction to avoid trading against the trend.
Automated exiting by setting profit-taking and stop-loss points reduces human intervention frequency.
Risk Analysis
Improper parameter settings may lead to over-trading or missing orders. Parameters need to be optimized for best results.
Fixed profit-taking and stop-loss points limit profit potential or increase losses. Dynamic stops based on ATR can be considered.
Moving average strategies work poorly in range-bound markets. Other indicators or manual intervention may be needed.
Optimization Directions
Optimize combinations of moving average parameters by testing different length moving averages.
Test adding other indicators such as KDJ and BOLL to determine entry and exit points.
Try dynamic stop loss strategies based on volatility measures.
Add machine learning models to find optimal parameters automatically.
Conclusion
This strategy integrates MACD, multiple moving averages and ZLSMA trend determination to achieve automated trading. By filtering with multiple signals, strategy stability is improved; by setting exiting logic, risks are reduced. There is certain practical value for real trading. Subsequent parameter optimization, indicator expansion, dynamic stops etc. can further improve strategy performance.
Parameters
| Name | Default | What it controls |
|---|---|---|
| v_input_1 | 12 | Fast Length |
| v_input_2 | 26 | Slow Length |
| v_input_3_close | 0 | Source: close | high | low | open | hl2 | hlc3 | hlcc4 | ohlc4 |
| v_input_int_1 | 9 | Signal Smoothing |
| v_input_string_1 | 0 | Oscillator MA Type: EMA | SMA |
| v_input_string_2 | 0 | Signal Line MA Type: EMA | SMA |
| v_input_4 | 5 | maPeriod5 |
| v_input_5 | 25 | maPeriod25 |
| v_input_6 | 45 | maPeriod45 |
| v_input_7 | 100 | maPeriod100 |
| v_input_8 | 0.03 | emaDisparity value among peers |
| v_input_int_2 | 32 | Length |
| v_input_int_3 | false | offset |
| v_input_9_close | 0 | Source: close | high | low | open | hl2 | hlc3 | hlcc4 | ohlc4 |
| v_input_10 | 0.06 | ロングProfit takingpips |
| v_input_11 | -0.06 | ショートProfit takingpips |
| v_input_12 | -0.06 | ロングCutting lossespips |
| v_input_13 | 0.06 | ショートCutting lossespips |
Source Pine Script
/*backtest
start: 2023-02-22 00:00:00
end: 2024-02-28 00:00:00
period: 1d
basePeriod: 1h
exchanges: [{"eid":"Futures_Binance","currency":"BTC_USDT"}]
*/

//@version=5
strategy("MACD ZLSMA_izumi⑤(4つのcondition,MCDがクロスしてたら)", overlay=true)

fast_length = input(title = "Fast Length", defval = 12)
slow_length = input(title = "Slow Length", defval = 26)
src = input(title = "Source", defval = close)
signal_length = input.int(title = "Signal Smoothing",  minval = 1, maxval = 50, defval = 9)
sma_source = input.string(title = "Oscillator MA Type",  defval = "EMA", options = ["SMA", "EMA"])
sma_signal = input.string(title = "Signal Line MA Type", defval = "EMA", options = ["SMA", "EMA"])
// Calculating
fast_ma = sma_source == "SMA" ? ta.sma(src, fast_length) : ta.ema(src, fast_length)
slow_ma = sma_source == "SMA" ? ta.sma(src, slow_length) : ta.ema(src, slow_length)
macd = fast_ma - slow_ma
signal = sma_signal == "SMA" ? ta.sma(macd, signal_length) : ta.ema(macd, signal_length)
hist = macd - signal

alertcondition(hist[1] >= 0 and hist < 0, title = 'Rising to falling', message = 'The MACD histogram switched from a rising to falling state')
alertcondition(hist[1] <= 0 and hist > 0, title = 'Falling to rising', message = 'The MACD histogram switched from a falling to rising state')

hline(0, "Zero Line", color = color.new(#787B86, 50))
plot(hist, title = "Histogram", style = plot.style_columns, color = (hist >= 0 ? (hist[1] < hist ? #26A69A : #B2DFDB) : (hist[1] < hist ? #FFCDD2 : #FF5252)))
plot(macd,   title = "MACD",   color = #2962FF)
plot(signal, title = "Signal", color = #FF6D00)

//MACDクロスSettings
enterLong = ta.crossover(macd, signal)
enterShort = ta.crossunder(macd, signal)

//Moving average lineのPeriodをSettings
ema5 = input(5, title="maPeriod5")
ema25 = input(25, title="maPeriod25")
ema45 = input(45, title="maPeriod45")
ema100 = input(100, title="maPeriod100")

//Moving average lineをCalculate
//smaFunctionで「ema25」バーMinuteのcloseをMoving average lineとして「Kema」にSettings
Kema5 = ta.sma(close,ema5)
Kema25 = ta.sma(close,ema25)
Kema45 = ta.sma(close,ema45)
Kema100 = ta.sma(close,ema100)


//Moving average lineをプロット
plot(Kema5, color=color.rgb(82, 249, 255),title="ema5")
plot(Kema25, color=color.red,title="ema25")
plot(Kema45, color=color.blue,title="ema45")
plot(Kema100, color=color.green,title="ema100")

//emaComradesのDistanceが30AboveのHourに「distancOK」にTureをReturnす
//distance1 = math.abs(Kema5-Kema25)
distance2 = math.abs(Kema25-Kema45)
distanceValue1 = input(0.030, title ="emaDisparity value among peers")
//distanceOk1 = distance1 > distanceValue1
distanceOk2 = distance2 > distanceValue1

//2IntervalのemaComradesのDistanceが30AboveのHourに「distanceOKK」にTrueをReturnす
//distanceOkK1 = distanceOk1 and distanceOk2
distanceOkK1 = distanceOk2

//5EMAとロウソクのDeviation judgment
//DistanceValue5ema = input(0.03, title ="5emaとロウソクのDeviation rate")
//emaDistance = math.abs(Kema5 - close)
//emaDistance5ema = emaDistance < DistanceValue5ema

//ZLSMAAddのコード
length = input.int(32, title="Length")
offset = input.int(0, title="offset")
src2 = input(close, title="Source")
lsma = ta.linreg(src2, length, offset)
lsma2 = ta.linreg(lsma, length, offset)
eq= lsma-lsma2
zlsma = lsma+eq
//ZLSMAのプロット
plot(zlsma, color=color.yellow, linewidth=3)

//ZLSMAのPrevious highをInspectSO
//var float zlsmaHigh = na
//var float zlsmaHighValue = na
//if ta.highest(zlsma,35) == zlsma[3]
//    zlsmaHighValue := zlsmaHigh
//    zlsmaHigh := zlsma[3]

//if (na(zlsmaHighValue))
 //   zlsmaHighValue := zlsmaHigh

//ZLSMAのPrevious lowをInspectSO
//var float zlsmaLow = na
//var float zlsmaLowValue = na
//if ta.lowest(zlsma,35) == zlsma[3]
//    zlsmaLowValue := zlsmaLow
//    zlsmaLow := zlsma[3]

///if (na(zlsmaLowValue))
//    zlsmaLowValue := zlsmaLow

//Profit taking・Cutting lossesりポイントのInitialization (variablesのInitialization)
var longProfit = 0.0
var longStop = 0.0
var shortProfit = 0.0
var shortStop = 0.0

//inputでSetting screenのSelect itemをSettings
longProfitValue = input(0.06, title ="ロングProfit takingpips")
shortProfitValue = input(-0.06, title ="ショートProfit takingpips")
longStopValue = input(-0.06, title ="ロングCutting lossespips")
shortStopValue = input(0.06, title ="ショートCutting lossespips")

// クロスのStrongさをPresumption
//angleThreshold = input(0.001, title = "クロスのStrongさAdjustment" )

// クロスのStrongさのThreshold value,このValueをAdjustmentしてクロスのStrongさのBenchmarkをChangeえる
//macdDiff = macdLine - signalLine
//strongCross = math.abs(macdDiff) > angleThreshold

// エントリーcondition (MACDラインとシグナルラインがクロス)
//ta.crossover(macdLine, signalLine) and strongCross


//ロングエントリーcondition
if  distanceOkK1 and enterLong
	strategy.entry("long", strategy.long, comment="long")
    longProfit := close + longProfitValue
    longStop := close + longStopValue

//    if na(strategy.position_avg_price) and close>strategy.position_avg_price + 0.05 * syminfo.mintick
 //       longStop := strategy.position_avg_price + 10 * syminfo.mintick
  //  strategy.exit("exit", "long",stop = longStop)

strategy.exit("exit", "long", limit = longProfit,stop = longStop)


if  distanceOkK1 and enterShort
	strategy.entry("short", strategy.short, comment="short")
    shortProfit := close + shortProfitValue
    shortStop := close + shortStopValue

 //   if na(strategy.position_avg_price) and close>strategy.position_avg_price - 0.05 * syminfo.mintick
  //      shortStop := strategy.position_avg_price - 0.1 * syminfo.mintick
  //  strategy.exit("exit", "long",stop = longStop)


strategy.exit("exit", "short", limit = shortProfit,stop = shortStop)
//plot(strategy.equity, title="equity", color=color.red, linewidth=2, style=plot.style_areabr)Published by ChaoZhang on the FMZ strategy square · last modified 2024-02-29. Collected in the Quant Trading Vault. Unvalidated research: re-test with your own data and costs before trusting it.
Build this with AgenKit
A spec is not a trading system. Paste this into your coding agent and AgenKit runs a specialist team — architecture, test-first build, risk gates, review — with paper trading on by default.
/agenkit build a production-grade trading bot with a backtest engine, risk controls and paper trading by default from strategies/Multiple-Moving-Average-Trading-Strategy.md- npx agenkit install engineering-kit in your project
- Paste the command into your agent and approve each phase
- Get tests, backtest, risk controls and a paper-trading switch
Understand it first
Before you run this, read the lesson behind the idea and how to backtest it honestly. Specs like this one are the survivors of an unknown number of trials; deflate their results accordingly.
Related specs
- Multi Indicator Dynamic Adaptive Quantitative Trading StrategyPine Script · Machine learning · 1h
- High Low Cryptocurrency Strategy Based on Multiple IndicatorsPine Script · Machine learning · 45m
- ADX EFI 50 Moving Average Channel Pullback StrategyPine Script · Machine learning · 1h
- Auto Trading Strategy Based on Multiple Indicators and Dynamic Stop LossPine Script · Machine learning · 1h
- Multi indicator Combination StrategyPine Script · Machine learning · 1d
- Trading Strategy Based on Bollinger Bands and MACDPine Script · Machine learning · 1h