Noros Bollinger Tracking Strategy
This is a momentum tracking strategy based on Bollinger Bands. It combines Bollinger Bands to judge market trends and reversal points, and sets long and short positions to track market fluctuations.
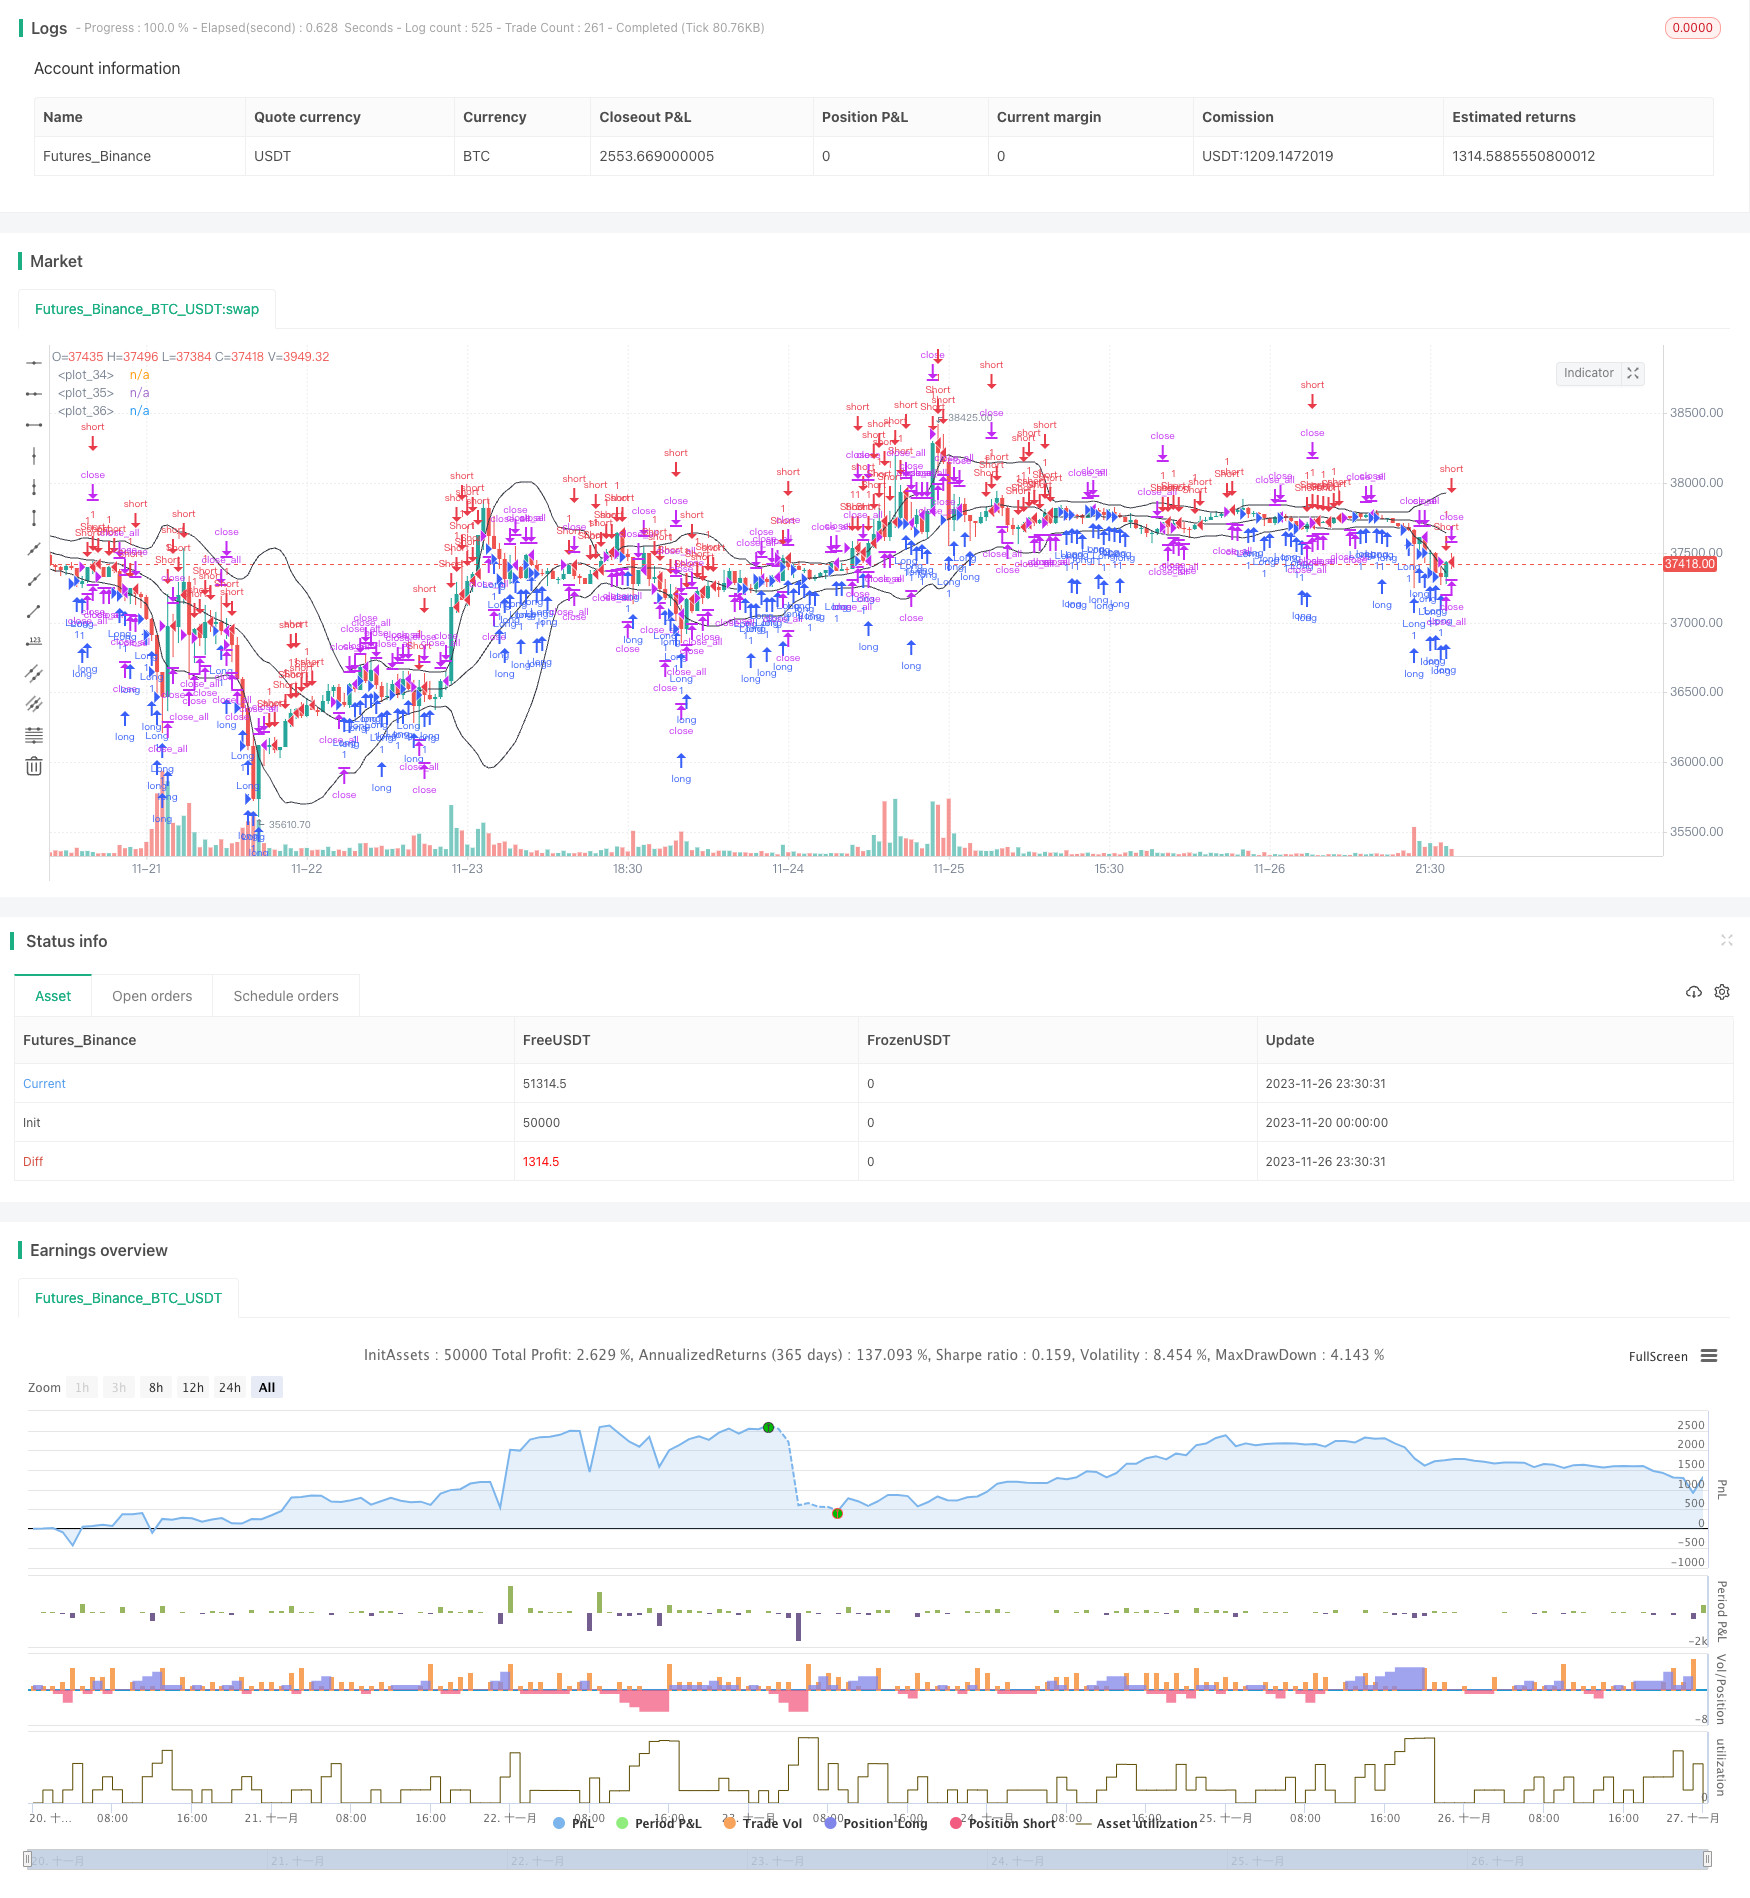
Overview
This is a momentum tracking strategy based on Bollinger Bands. It combines Bollinger Bands to judge market trends and reversal points, and sets long and short positions to track market fluctuations.
Principles
The core indicator of this strategy is Bollinger Bands, which consists of middle band, upper band and lower band. The middle band is the moving average of n days, and the upper and lower bands are the offsets of the middle band plus/minus standard deviation. When the price approaches the upper/lower band, it is considered a signal of overbought/oversold. The strategy incorporates trend deviation as the basis for opening positions, i.e. opening positions when the price breaks through the middle band in the opposite direction. To prevent losses caused by false breakouts, the strategy requires that the width of breakout is greater than the mean. The closing condition is that the price turns back after breaking through the middle band.
This strategy also incorporates both trend-following entries and mean-reversion entries, corresponding to different trading opportunities. Trend-following entries require the middle band to be the support/resistance reference and form deviation breakouts. Mean-reversion entries directly reverse near the upper/lower Bollinger bands. The strategy combines these two types of signals and can take both trend tracking and reversal operations.
Advantage Analysis
This strategy combines the overbought/oversold characteristics of Bollinger Bands with reversal point judgment. This enables it to apply to both trending and ranging markets, capturing different types of trading opportunities. The stop loss exit setting prevents the loss from expanding. Also, the ability to trade both long and short enhances the applicability of the strategy.
Compared with simple Bollinger strategies, the additional trend logic makes entries of this strategy more stable, and it also captures reversal opportunities. This improves the signal-to-noise ratio. In addition, trading both directions utilizes trading opportunities more fully across different market situations.
Risk Analysis
This strategy mainly relies on the overbought/oversold characteristics of Bollinger Bands. So when there is extreme price fluctuation, the width of Bollinger Bands keeps expanding, which can easily lead to multiple losing trades. This is a potential risk point. In addition, there are still some uncertainties and errors in reversal judgments, causing failed entries and stops.
Against the failure of Bollinger Bands, we can shorten the parameter n to make the bands more sensitive, or reduce the band width to lower the chance of losses. As for reversal curve judgments, optimizing the parameters of breakouts can reduce errors.
Optimization Directions
The main directions to optimize this strategy include:
- The parameters of Bollinger Bands can be adjusted according to different markets to find the optimal combination.
- The magnitude of deviation and the calculation of mean values can be tested with other options.
- Add more filters to judge entry signals and reduce false positives.
- Test other stop loss methods like trail stop loss.
- Parameters can be optimized towards specific products and timeframes.
Conclusion
This strategy makes effective expansions and optimizations to standard Bollinger strategies. The added trend deviation improves stability and utilizes reversal opportunities well. The ability to trade both directions and stop losses also makes the strategy more robust. Further improvements can be achieved through parameter optimization and adding more filters.
Parameters
| Name | Default | What it controls |
|---|---|---|
| v_input_1 | true | Long |
| v_input_2 | true | Short |
| v_input_3 | 20 | Bollinger Length |
| v_input_4 | 2 | Bollinger Mult |
| v_input_5_ohlc4 | 0 | Bollinger Source: ohlc4 | high | low | open | hl2 | hlc3 | hlcc4 | close |
| v_input_6 | true | Use trend entry |
| v_input_7 | true | Use counter-trend entry |
| v_input_8 | 2018 | From Year |
| v_input_9 | 2100 | To Year |
| v_input_10 | true | From Month |
| v_input_11 | 12 | To Month |
| v_input_12 | true | From day |
| v_input_13 | 31 | To day |
| v_input_14 | true | Show Bollinger Bands |
Source Pine Script
/*backtest
start: 2023-11-20 00:00:00
end: 2023-11-27 00:00:00
period: 30m
basePeriod: 15m
exchanges: [{"eid":"Futures_Binance","currency":"BTC_USDT"}]
*/

//Noro
//2018

//@version=3
strategy("Noro's Bollinger Strategy v1.3", shorttitle = "Bollinger str 1.3", overlay = true, default_qty_type = strategy.percent_of_equity, default_qty_value = 100.0, pyramiding = 5)

//Settings
needlong = input(true, defval = true, title = "Long")
needshort = input(true, defval = true, title = "Short")

length = input(20, defval = 20, minval = 1, maxval = 1000, title = "Bollinger Length")
mult = input(2.0, defval = 2.0, minval = 0.001, maxval = 50, title = "Bollinger Mult")
source = input(ohlc4, defval = ohlc4, title = "Bollinger Source")

uset = input(true, defval = true, title = "Use trend entry")
usect = input(true, defval = true, title = "Use counter-trend entry")

fromyear = input(2018, defval = 2018, minval = 1900, maxval = 2100, title = "From Year")
toyear = input(2100, defval = 2100, minval = 1900, maxval = 2100, title = "To Year")
frommonth = input(01, defval = 01, minval = 01, maxval = 12, title = "From Month")
tomonth = input(12, defval = 12, minval = 01, maxval = 12, title = "To Month")
fromday = input(01, defval = 01, minval = 01, maxval = 31, title = "From day")
today = input(31, defval = 31, minval = 01, maxval = 31, title = "To day")
showbands = input(true, defval = true, title = "Show Bollinger Bands")

//Bollinger Bands
basis = sma(source, length)
dev = mult * stdev(source, length)
upper = basis + dev
lower = basis - dev

//Lines
col = showbands ? black : na
plot(upper, linewidth = 1, color = col)
plot(basis, linewidth = 1, color = col)
plot(lower, linewidth = 1, color = col)

//Body
body = abs(close - open)
abody = ema(body, 30)

//Signals
bar = close > open ? 1 : close < open ? -1 : 0
up1 = bar == -1 and ohlc4 >= basis and ohlc4 < upper and (close < strategy.position_avg_price or strategy.position_size == 0) and uset
dn1 = bar == 1 and ohlc4 <= basis and ohlc4 > lower and (close > strategy.position_avg_price or strategy.position_size == 0) and uset
up2 = close <= lower and usect
dn2 = close >= upper and usect
exit = ((strategy.position_size > 0 and close > open) or (strategy.position_size < 0 and close < open)) and body > abody / 2

//Trading
if up1 or up2
    strategy.entry("Long", strategy.long, needlong == false ? 0 : na, when=(time > timestamp(fromyear, frommonth, fromday, 00, 00) and time < timestamp(toyear, tomonth, today, 23, 59)))

if dn1 or dn2
    strategy.entry("Short", strategy.short, needshort == false ? 0 : na, when=(time > timestamp(fromyear, frommonth, fromday, 00, 00) and time < timestamp(toyear, tomonth, today, 23, 59)))

if time > timestamp(toyear, tomonth, today, 23, 59) or exit
strategy.close_all()Published by ChaoZhang on the FMZ strategy square · last modified 2023-11-28. Collected in the Quant Trading Vault. Unvalidated research: re-test with your own data and costs before trusting it.
Build this with AgenKit
A spec is not a trading system. Paste this into your coding agent and AgenKit runs a specialist team — architecture, test-first build, risk gates, review — with paper trading on by default.
/agenkit build a production-grade trading bot with a backtest engine, risk controls and paper trading by default from strategies/Noros-Bollinger-Tracking-Strategy.md- npx agenkit install engineering-kit in your project
- Paste the command into your agent and approve each phase
- Get tests, backtest, risk controls and a paper-trading switch
Understand it first
Before you run this, read the lesson behind the idea and how to backtest it honestly. Specs like this one are the survivors of an unknown number of trials; deflate their results accordingly.
Related specs
- Momentum Breakout Moving Average StrategyPine Script · Breakout · 1d
- Moving Average Crossover and Upper Rail Breakthrough Impulse StrategyPine Script · Breakout · 1m
- Bollinger Bands Breakout Strategy 442259Pine Script · Breakout · 1h
- Volatility Breakthrough StrategyPine Script · Breakout · 10m
- Cross Timeframe SuperTrend Breakout StrategyPine Script · Breakout · 1h
- Price Breakthrough Bollinger Band A StrategyPine Script · Breakout · 1m