Strategy vault / Trend following
Optimized Trend Tracker
A brand new indicator from the developer of MOST (Moving Stop Loss) indicator Anıl Özekşi. Optimized Trend Tracker OTT is an indicator that provides traders to find an existing trend or in another words to ser…
A brand new indicator from the developer of MOST (Moving Stop Loss) indicator Anıl Özekşi.
Optimized Trend Tracker OTT is an indicator that provides traders to find an existing trend or in another words to ser which side of the current trend we are on.
We are under the effect of the uptrend in cases where the prices are above OTT , under the influence of a downward trend, when prices are below OTT it is possible to say that we are.
The first parameter in the OTT indicator set by the two parameters is the period/length.
OTT will be much sensitive to trend movements if it is smaller. And vice versa, will be less sensitive when it is longer.
As the period increases it will become less sensitive to little trends and price actions.
In this way, your choice of period, will be closely related to which of the sort of trends you are interested in.
The OTT percent parameter in OTT is an optimization coefficient. Just like in the period small values are better at capturing short term fluctuations, while large values will be more suitable for long-term trends.
In addition, when OTT is used with the support line in it, buy and sell signals it will become a producing indicator.
You can use OTT default alarms and Buy Sell signals like:
1- BUY when Prices are above OTT SELL when Prices are below OTT
2- BUY when OTT support Line crosses over OTT line. SELL when OTT support Line crosses under OTT line.
3- BUY when OTT line is Green and makes higher highs. SELL when OTT line is Red and makes lower lows.
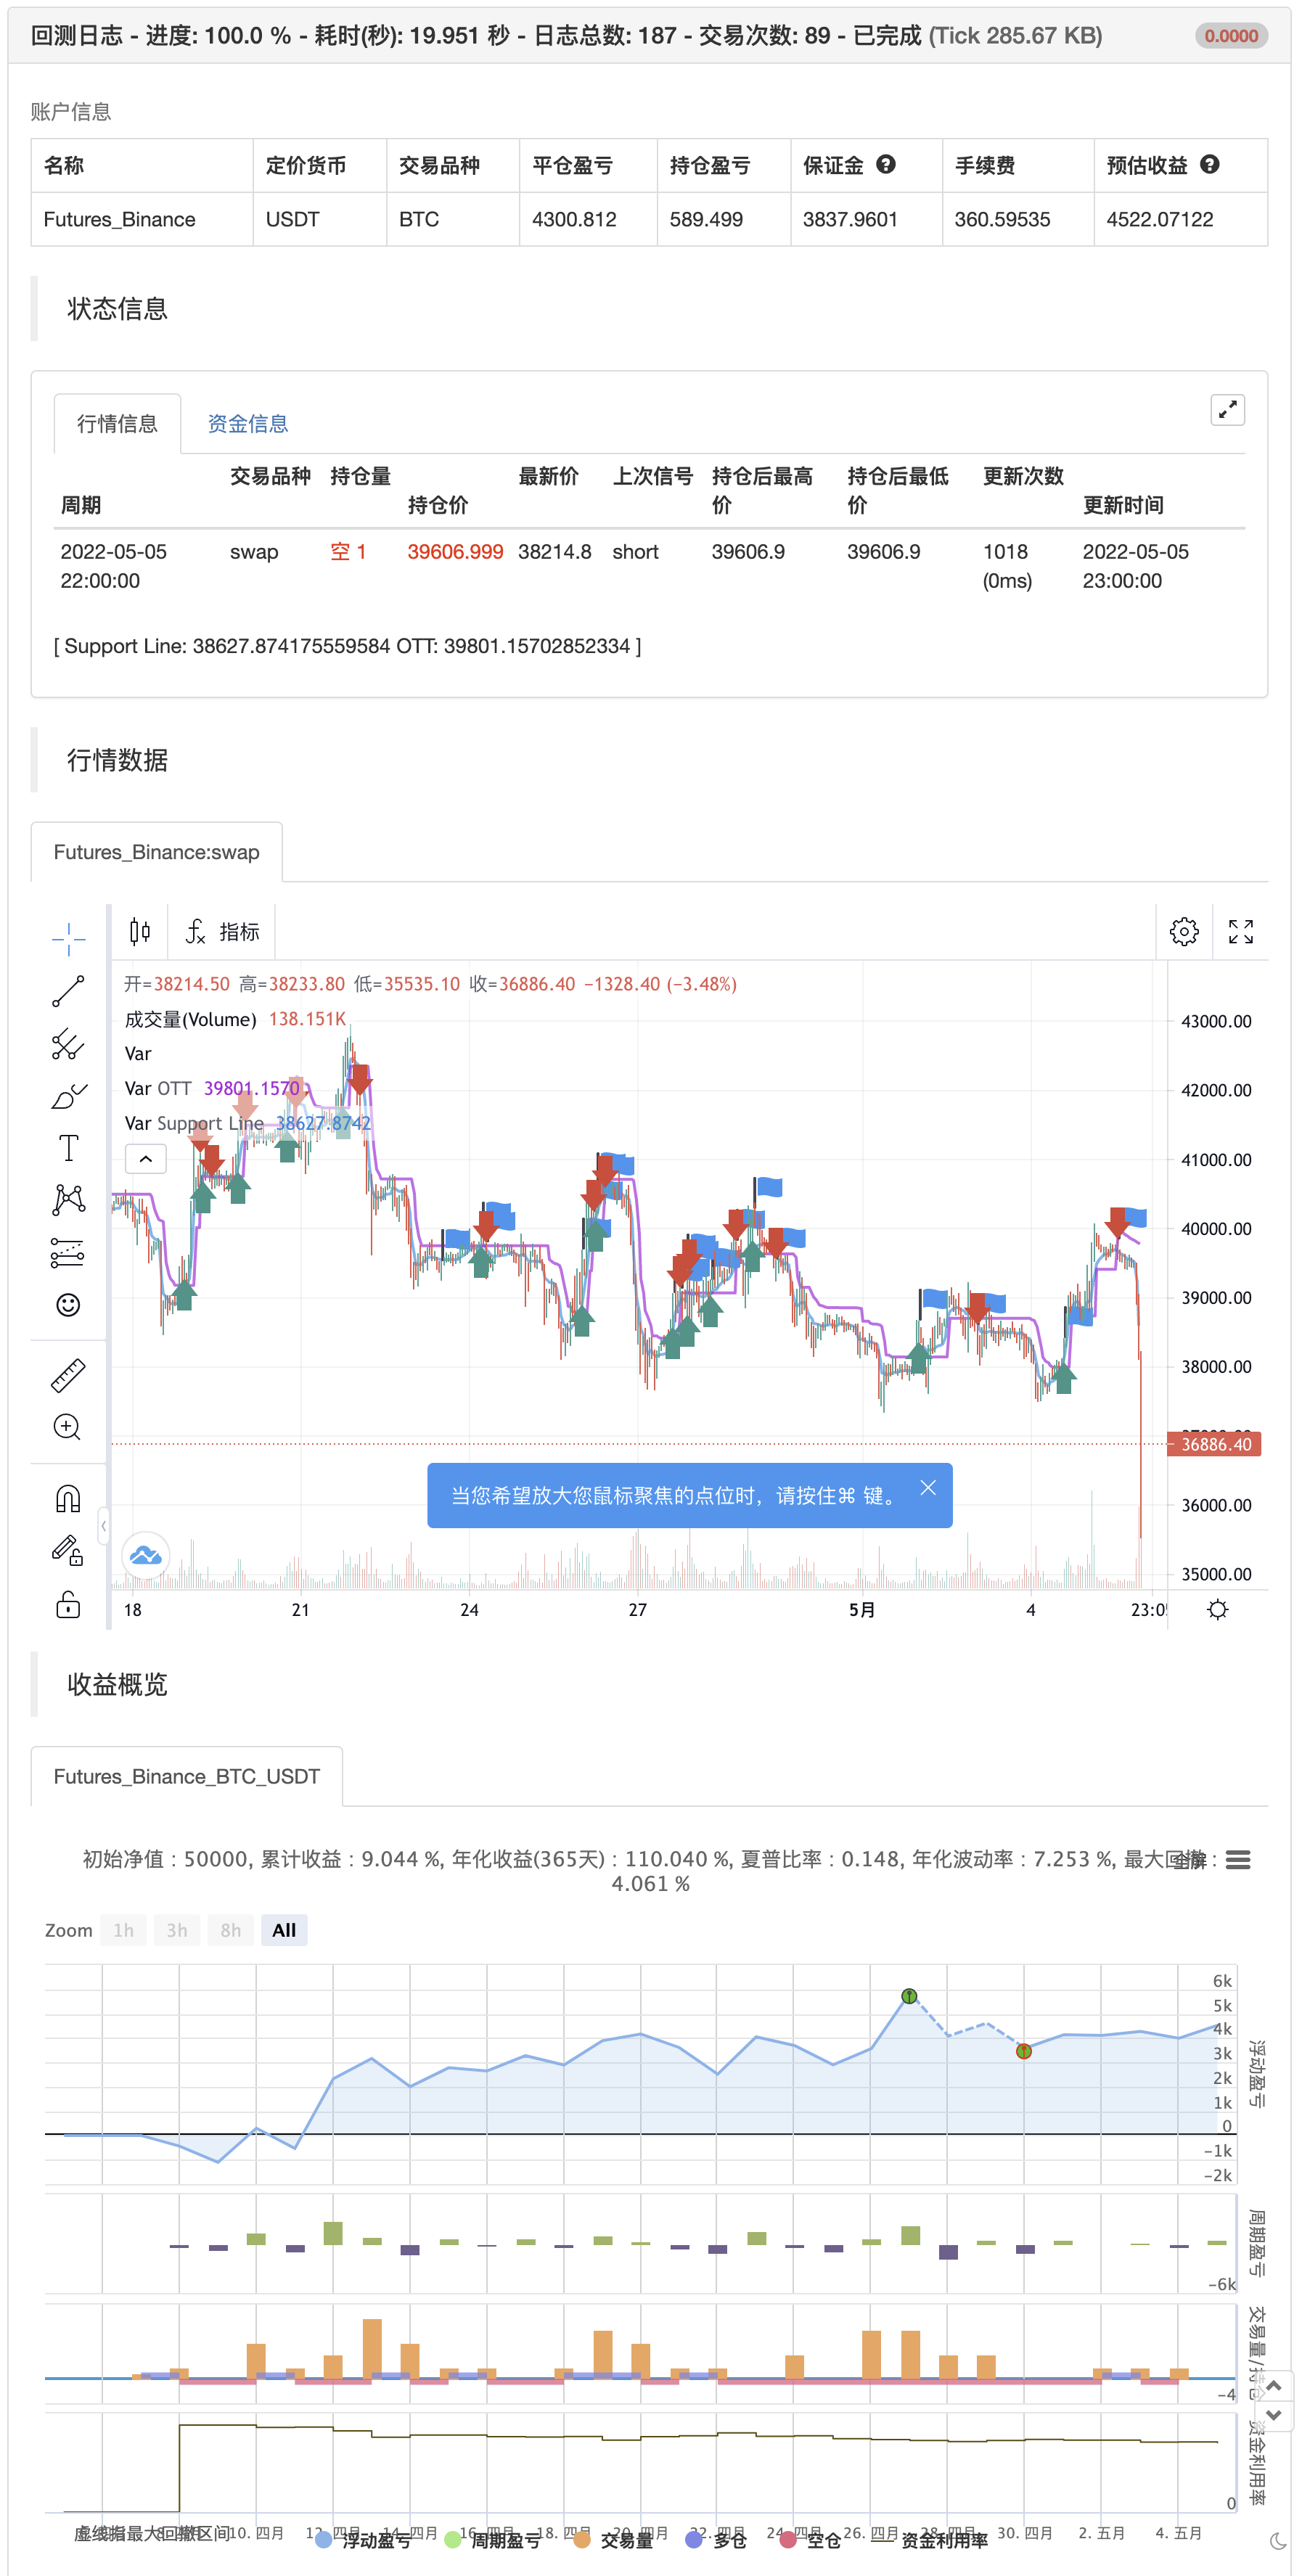
Note: A small coverage with English subtitles will be available on my Youtube Channel soon. backtest
Parameters
| Name | Default | What it controls |
|---|---|---|
| v_input_1_close | 0 | Source: close | high | low | open | hl2 | hlc3 | hlcc4 | ohlc4 |
| v_input_2 | 2 | OTT Period |
| v_input_3 | 1.4 | OTT Percent |
| v_input_4 | true | Show Support Line? |
| v_input_5 | true | Show Support Line Crossing Signals? |
| v_input_6 | false | Show Price/OTT Crossing Signals? |
| v_input_7 | false | Show OTT Color Changes? |
| v_input_8 | false | Show OTT Color Change Signals? |
| v_input_9 | true | Highlighter On/Off ? |
| v_input_10 | 0 | Moving Average Type: VAR | EMA | WMA | TMA | SMA | WWMA | ZLEMA | TSF |
Source Pine Script
/*backtest
start: 2022-04-06 00:00:00
end: 2022-05-05 23:59:00
period: 1h
basePeriod: 15m
exchanges: [{"eid":"Futures_Binance","currency":"BTC_USDT"}]
*/
//@version=4
// This source code is subject to the terms of the Mozilla Public License 2.0 at https://mozilla.org/MPL/2.0/
// © KivancOzbilgic

//created by: @Anil_Ozeksi
//developer: ANIL ÖZEKŞİ
//author: @kivancozbilgic

study("Optimized Trend Tracker","OTT", overlay=true)
src = input(close, title="Source")
length=input(2, "OTT Period", minval=1)
percent=input(1.4, "OTT Percent", type=input.float, step=0.1, minval=0)
showsupport = input(title="Show Support Line?", type=input.bool, defval=true)
showsignalsk = input(title="Show Support Line Crossing Signals?", type=input.bool, defval=true)
showsignalsc = input(title="Show Price/OTT Crossing Signals?", type=input.bool, defval=false)
highlight = input(title="Show OTT Color Changes?", type=input.bool, defval=false)
showsignalsr = input(title="Show OTT Color Change Signals?", type=input.bool, defval=false)
highlighting = input(title="Highlighter On/Off ?", type=input.bool, defval=true)
mav = input(title="Moving Average Type", defval="VAR", options=["SMA", "EMA", "WMA", "TMA", "VAR", "WWMA", "ZLEMA", "TSF"])
Var_Func(src,length)=>
    valpha=2/(length+1)
    vud1=src>src[1] ? src-src[1] : 0
    vdd1=src<src[1] ? src[1]-src : 0
    vUD=sum(vud1,9)
    vDD=sum(vdd1,9)
    vCMO=nz((vUD-vDD)/(vUD+vDD))
    VAR=0.0
    VAR:=nz(valpha*abs(vCMO)*src)+(1-valpha*abs(vCMO))*nz(VAR[1])
VAR=Var_Func(src,length)
Wwma_Func(src,length)=>
    wwalpha = 1/ length
    WWMA = 0.0
    WWMA := wwalpha*src + (1-wwalpha)*nz(WWMA[1])
WWMA=Wwma_Func(src,length)
Zlema_Func(src,length)=>
    zxLag = length/2==round(length/2) ? length/2 : (length - 1) / 2
    zxEMAData = (src + (src - src[zxLag]))
    ZLEMA = ema(zxEMAData, length)
ZLEMA=Zlema_Func(src,length)
Tsf_Func(src,length)=>
    lrc = linreg(src, length, 0)
    lrc1 = linreg(src,length,1)
    lrs = (lrc-lrc1)
    TSF = linreg(src, length, 0)+lrs
TSF=Tsf_Func(src,length)
getMA(src, length) =>
    ma = 0.0
    if mav == "SMA"
        ma := sma(src, length)
        ma

    if mav == "EMA"
        ma := ema(src, length)
        ma

    if mav == "WMA"
        ma := wma(src, length)
        ma

    if mav == "TMA"
        ma := sma(sma(src, ceil(length / 2)), floor(length / 2) + 1)
        ma

    if mav == "VAR"
        ma := VAR
        ma

    if mav == "WWMA"
        ma := WWMA
        ma

    if mav == "ZLEMA"
        ma := ZLEMA
        ma

    if mav == "TSF"
        ma := TSF
        ma
    ma

MAvg=getMA(src, length)
fark=MAvg*percent*0.01
longStop = MAvg - fark
longStopPrev = nz(longStop[1], longStop)
longStop := MAvg > longStopPrev ? max(longStop, longStopPrev) : longStop
shortStop =  MAvg + fark
shortStopPrev = nz(shortStop[1], shortStop)
shortStop := MAvg < shortStopPrev ? min(shortStop, shortStopPrev) : shortStop
dir = 1
dir := nz(dir[1], dir)
dir := dir == -1 and MAvg > shortStopPrev ? 1 : dir == 1 and MAvg < longStopPrev ? -1 : dir
MT = dir==1 ? longStop: shortStop
OTT=MAvg>MT ? MT*(200+percent)/200 : MT*(200-percent)/200
plot(showsupport ? MAvg : na, color=#0585E1, linewidth=2, title="Support Line")
OTTC = highlight ? OTT[2] > OTT[3] ? color.green : color.red : #B800D9
pALL=plot(nz(OTT[2]), color=OTTC, linewidth=2, title="OTT", transp=0)

buySignalk = crossover(MAvg, OTT[2])
plotshape(buySignalk and showsignalsk ? OTT*0.995 : na, title="Buy", text="Buy", location=location.absolute, style=shape.labelup, size=size.tiny, color=color.green, textcolor=color.white, transp=0)
sellSignallk = crossunder(MAvg, OTT[2])
plotshape(sellSignallk and showsignalsk ? OTT*1.005 : na, title="Sell", text="Sell", location=location.absolute, style=shape.labeldown, size=size.tiny, color=color.red, textcolor=color.white, transp=0)

if buySignalk
    strategy.entry("entry long", strategy.long)
else if sellSignallk
    strategy.entry("entry short", strategy.short)
Published by ChaoZhang on the FMZ strategy square · last modified 2022-05-07. Collected in the Quant Trading Vault. Unvalidated research: re-test with your own data and costs before trusting it.
Build this with AgenKit
A spec is not a trading system. Paste this into your coding agent and AgenKit runs a specialist team — architecture, test-first build, risk gates, review — with paper trading on by default.
/agenkit build a production-grade trading bot with a backtest engine, risk controls and paper trading by default from strategies/Optimized-Trend-Tracker.md- npx agenkit install engineering-kit in your project
- Paste the command into your agent and approve each phase
- Get tests, backtest, risk controls and a paper-trading switch
Understand it first
Before you run this, read the lesson behind the idea and how to backtest it honestly. Specs like this one are the survivors of an unknown number of trials; deflate their results accordingly.
Related specs
- ADX MA and EMA Long Only Trend Tracking StrategyPine Script · Trend following · 1d
- ATR and Moving Average Crossover Hybrid StrategyPine Script · Trend following · 1h
- Bollinger Band Moving Average Crossover StrategyPine Script · Trend following · 1h
- Bollinger Bands and EMA Trend Following StrategyPine Script · Trend following · 1h
- Bollinger Bands and RSI Trend Following StrategyPine Script · Trend following · 1h
- Candlestick Pattern Trend Filter StrategyPine Script · Trend following · 1d