Strategy vault / Trend following
Parabolic SAR and EMA Trend Tracking Strategy
The main idea of this strategy is to use both the Parabolic SAR and EMA indicators to identify the trend direction and timing of entering the market. Parabolic SAR is used to determine the current trend direction…
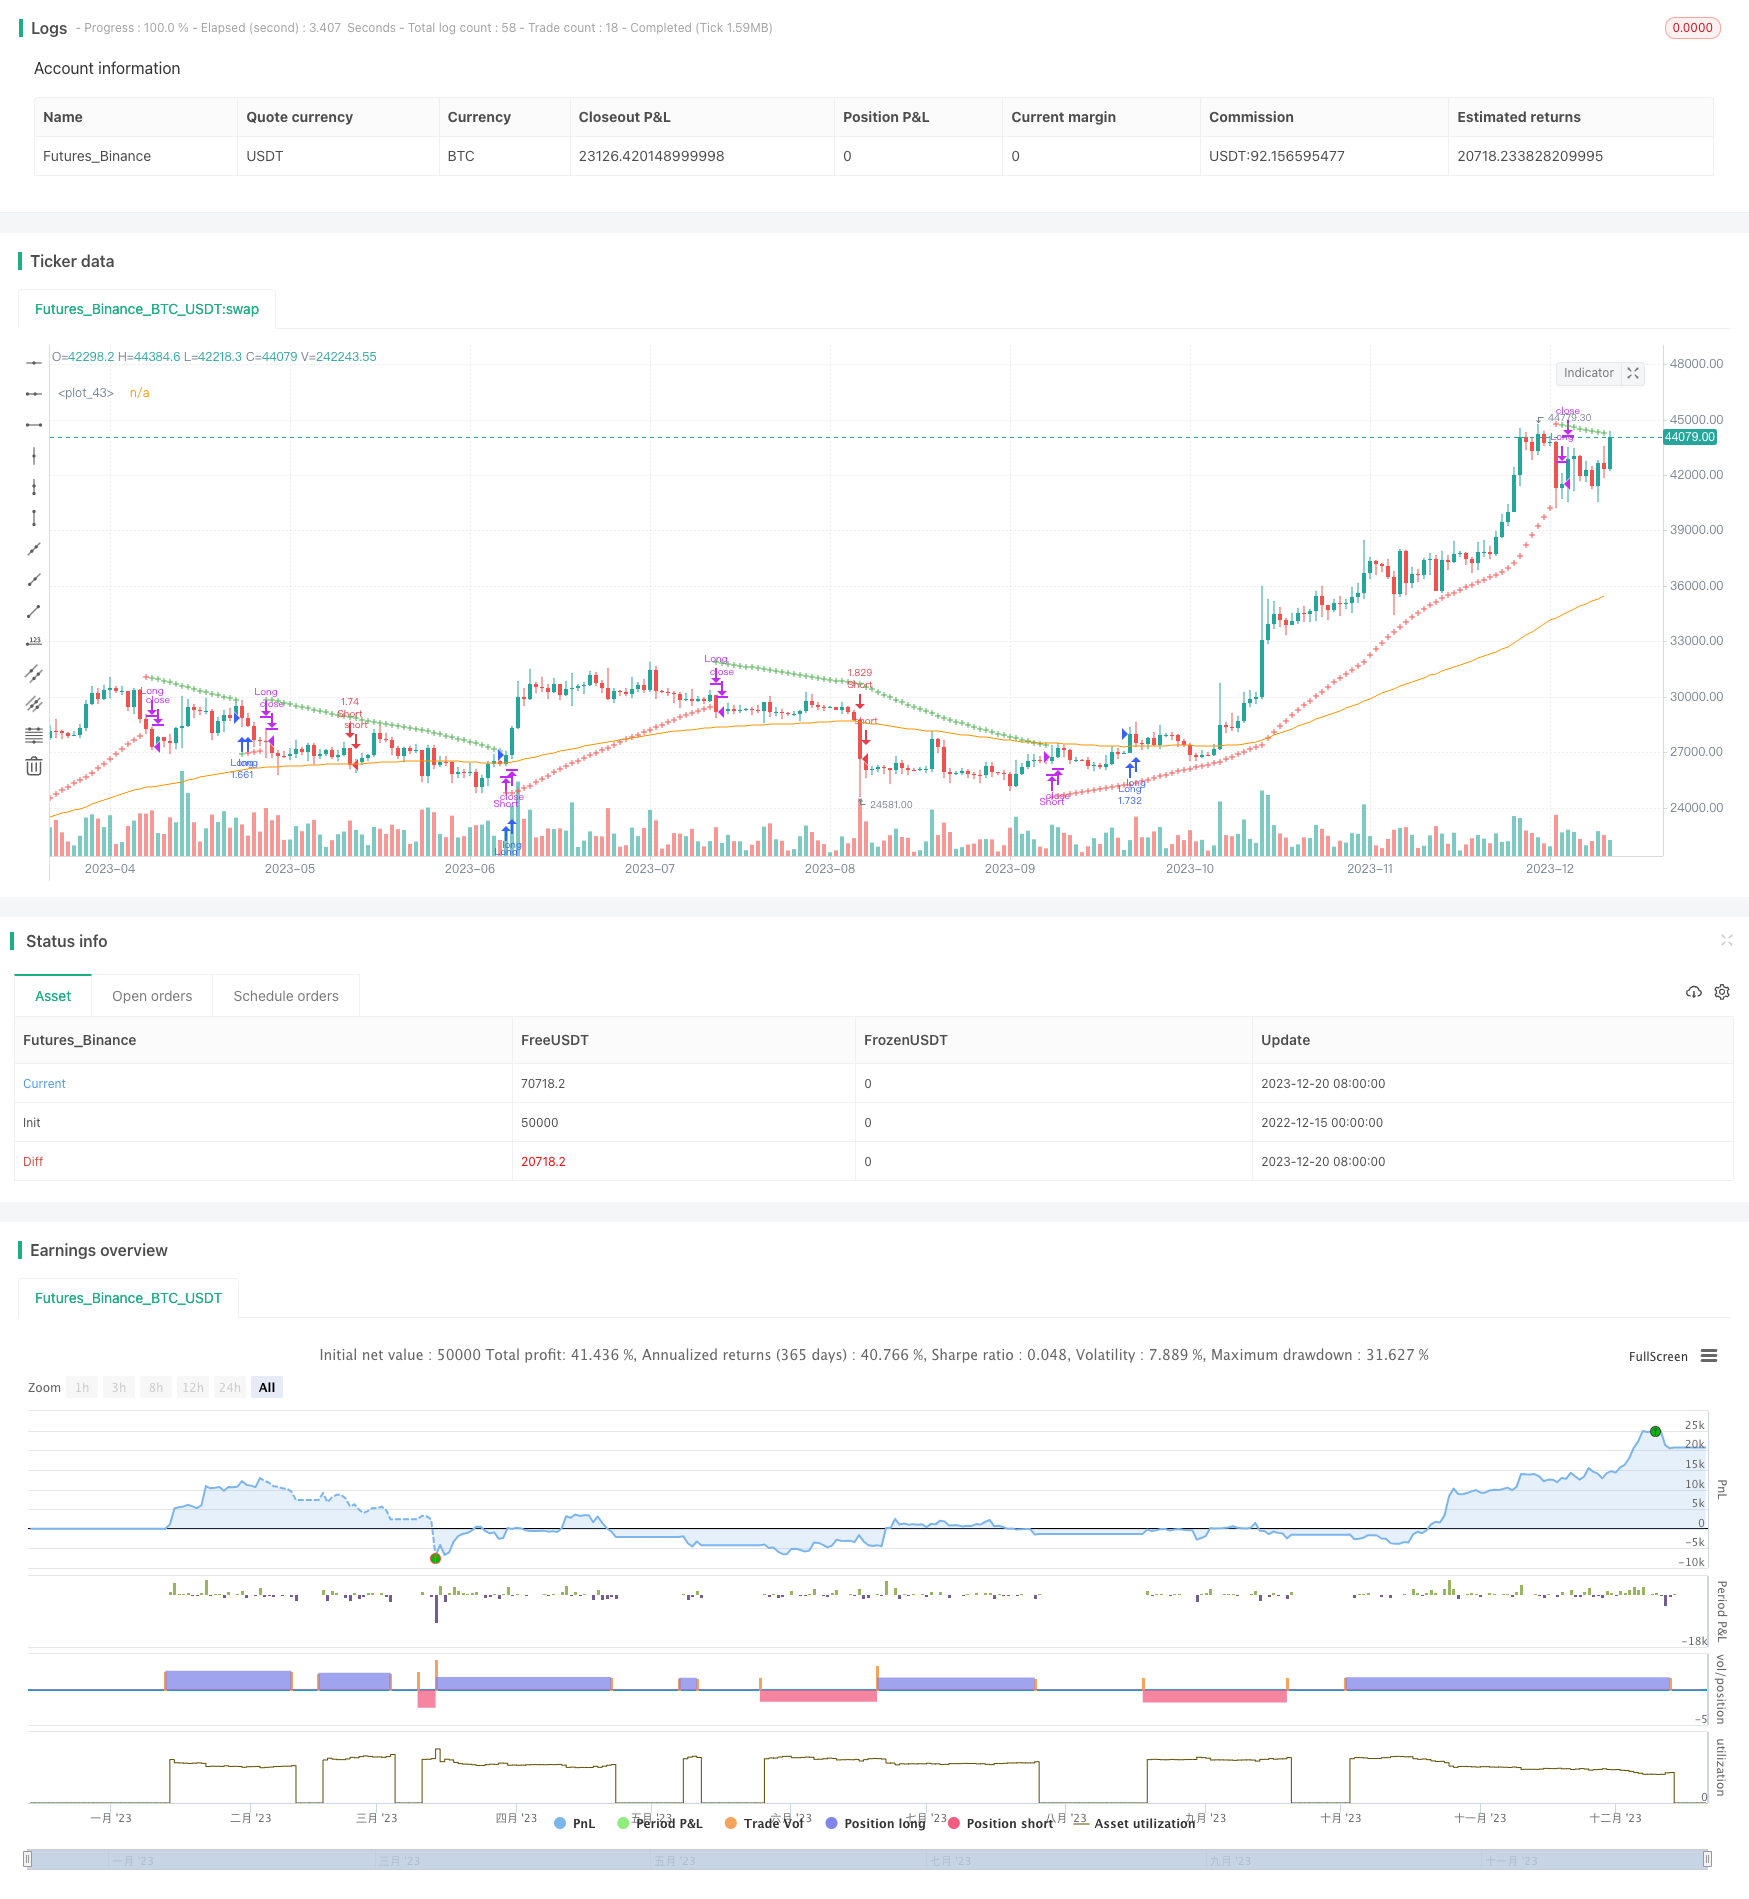
Overview
The main idea of this strategy is to use both the Parabolic SAR and EMA indicators to identify the trend direction and timing of entering the market. Parabolic SAR is used to determine the current trend direction, and EMA is used to assist in determining the specific timing of entering the market. When SAR is above price, it is a bear market. When SAR is below price, it is a bull market. When entering the market, it also requires the price to break through the EMA before the trend is considered to be forming. At this time, follow the trend direction to enter the market.
Strategy Principle
The core indicator of this strategy is Parabolic SAR, which is a technical analysis tool that can track prices and judge trend reversals. Its calculation formula is more complicated, but the principle is simple and intuitive. The SAR indicator constantly adjusts its position to always stay behind the price. When the price reverses, it will immediately adjust its position to the other side of the price. Therefore, just observe the position of the SAR indicator relative to the price to judge the current trend direction.
Another indicator assisting this strategy is EMA. Unlike SAR, EMA is more suitable for judging the sustainability of trends. By requiring the price to break through the EMA before entering the market, some noise can be effectively filtered out. And EMA can also be used to confirm reversal signals. For example, when the price breaks through the rising trend EMA, it is likely to be a signal of trend reversal.
In summary, the specific trading rules of this strategy are as follows:
- Use SAR to determine the trend direction. SAR above price is bearish market and below price is bullish market
- Go long when price is greater than EMA in a bull market; go short when price is less than EMA in a bear market
- Set stop loss to SAR value to control risk
By determining the major trend through Parabolic SAR and filtering misleading signals with EMA, it is possible to lock in the trend while controlling risk and achieving effective trend tracking.
Advantage Analysis
This strategy has the following main advantages:
- Strong trend tracking capability. SAR is very sensitive to judging trend reversals and can effectively lock in trend directions.
- High accuracy. EMA filters noise and avoids traps.
- Proper risk control. Setting stop loss with SAR controls single loss.
- Easy to implement. The strategy rules are simple and clear, easy to understand and implement.
In general, this strategy integrates the advantages of multiple indicators, while capturing the trend it also achieves effective risk control, and it is a stable trend tracking strategy that is easy to master.
Risk Analysis
Although the strategy has many advantages, there are still certain risks that need to be guarded against during actual operation. The main risks are:
- Trend reversal risk. When a trend reversal occurs, the strategy cannot stop loss in time, which may cause greater losses.
- Range-bound market risk. In range-bound markets, the strategy will incur multiple small losses.
- Parameter optimization risk. The parameter settings of SAR and EMA affect strategy performance and need to be repeatedly tested to find the optimal parameters.
To reduce the above risks, optimization can be carried out in the following aspects:
- Combine other indicators to determine the timing of trend reversal and set a more sensitive stop loss point.
- Add filters to avoid frequent opening in volatile markets.
- Use genetic algorithms and other means to optimize parameter combinations and find the optimal parameters.
Optimization Direction
To further optimize this strategy, consider the following aspects:
Optimize parameter settings. Methods such as genetic algorithms can be used to test and optimize the parameters of EMA and SAR to find the optimal parameter combination.
Add trend judgment tools. Other indicators such as MACD and Bollinger Bands can be added to confirm the trend and improve accuracy.
Set dynamic stop loss. Set dynamic stop loss points based on indicators such as ATR for more flexible stops.
Consider trading costs. Introduce slippage and commission parameters to optimize net profits rather than absolute returns.
Multi-level entry and exit. More complex multi-level entry and exit mechanisms can be set to build positions or stop losses in stages at different trend stages.
With the above optimizations, while tracking the trend, the strategy can be expected to obtain higher stability, more accurate judgment and stronger risk control capabilities, thereby achieving melhor performance.
Summary
The Parabolic SAR and EMA trend tracking strategy integrates the advantages of multiple indicators to judge trend direction and timing of entry. With SAR set as stop loss point, risk is under control. It is a relatively stable quantitative strategy. This strategy has advantages such as high judgment accuracy and easy mastery. But there are also certain risks. Further optimization of parameters and stop loss methods is needed to achieve melhor performance. It is worth investors' reference and learning.
Parameters
| Name | Default | What it controls |
|---|---|---|
| v_input_1 | 100 | EMA Length |
| v_input_2 | false | EMA Offset % |
| v_input_3 | 0.015 | start |
| v_input_4 | 0.005 | increment |
| v_input_5 | 0.2 | maximum |
| v_input_6 | true | From Day |
| v_input_7 | true | From Month |
| v_input_8 | 2019 | From Year |
| v_input_9 | true | To Day |
| v_input_10 | true | To Month |
| v_input_11 | 2020 | To Year |
Source Pine Script
/*backtest
start: 2022-12-15 00:00:00
end: 2023-12-21 00:00:00
period: 1d
basePeriod: 1h
exchanges: [{"eid":"Futures_Binance","currency":"BTC_USDT"}]
*/

//@version=3
strategy("Parabolic SAR Strategy w/ EMA", overlay=true, default_qty_type=strategy.percent_of_equity, default_qty_value=100)


emalength = input(100 , "EMA Length")
emaoffset = input(0.00, "EMA Offset %")
start = input(0.015)
increment = input(0.005)
maximum = input(0.2)

////////////////////////////////////////////////////////////////////////////////
// BACKTESTING RANGE

// From Date Inputs
fromDay = input(defval = 1, title = "From Day", minval = 1, maxval = 31)
fromMonth = input(defval = 1, title = "From Month", minval = 1, maxval = 12)
fromYear = input(defval = 2019, title = "From Year", minval = 1970)

// To Date Inputs
toDay = input(defval = 1, title = "To Day", minval = 1, maxval = 31)
toMonth = input(defval = 1, title = "To Month", minval = 1, maxval = 12)
toYear = input(defval = 2020, title = "To Year", minval = 1970)

// Calculate start/end date and time condition
startDate = timestamp(fromYear, fromMonth, fromDay, 00, 00)
finishDate = timestamp(toYear, toMonth, toDay, 00, 00)
time_cond = true

////////////////////////////////////////////////////////////////////////////////

psar = sar(start, increment, maximum)
ema = ema(close, emalength)
offset = (emaoffset / 100) * ema

// Signals
psar_long  = high[1] < psar[2] and high > psar[1]
psar_short = low[1]  > psar[2] and low  < psar[1]

// Plot PSAR
plotshape(psar, location = location.absolute, style = shape.cross, size = size.tiny, color = low < psar[1] and not psar_long ? green : red)

//Plot EMA
plot(ema)

if(psar_long)
    strategy.close("Short")

if(psar_short)
    strategy.close("Long")

if (psar < low and time_cond and close > ema + offset)
    strategy.entry("Long", strategy.long, comment="Long", stop = psar)

if (psar > high and time_cond and close < ema - offset)
    strategy.entry("Short", strategy.short, comment="Short", stop = psar)

if (not time_cond)
    strategy.close_all()
Published by ChaoZhang on the FMZ strategy square · last modified 2023-12-22. Collected in the Quant Trading Vault. Unvalidated research: re-test with your own data and costs before trusting it.
Build this with AgenKit
A spec is not a trading system. Paste this into your coding agent and AgenKit runs a specialist team — architecture, test-first build, risk gates, review — with paper trading on by default.
/agenkit build a production-grade trading bot with a backtest engine, risk controls and paper trading by default from strategies/Parabolic-SAR-and-EMA-Trend-Tracking-Strategy.md- npx agenkit install engineering-kit in your project
- Paste the command into your agent and approve each phase
- Get tests, backtest, risk controls and a paper-trading switch
Understand it first
Before you run this, read the lesson behind the idea and how to backtest it honestly. Specs like this one are the survivors of an unknown number of trials; deflate their results accordingly.
Related specs
- Dual ATR Channel Trend Following StrategyPine Script · Trend following · 15m
- PSAR and EMA Based Quantitative Trading StrategyPine Script · Trend following · 1h
- An Optimization of Dual Moving Average Trend Following Strategy Based on Indicators CombinationPine Script · Trend following · 4h
- Multi Indicator Trend Following Trading Strategy with Parabolic SAR and SuperTrend CloudPine Script · Trend following
- Adaptive Trend Following with Dynamic Risk Control StrategyPine Script · Trend following · 1h
- An Intraday Trend Following Quantitative Strategy Based on Multi indicator Condition FilteringPine Script · Trend following · 1d