Strategy vault / Trend following
Price Crossing Moving Average Trend Following Strategy
This strategy generates buy and sell signals based on the crossing of price with a moving average. It provides various types of moving averages and a tolerance parameter to filter false breakouts. The strategy aims…
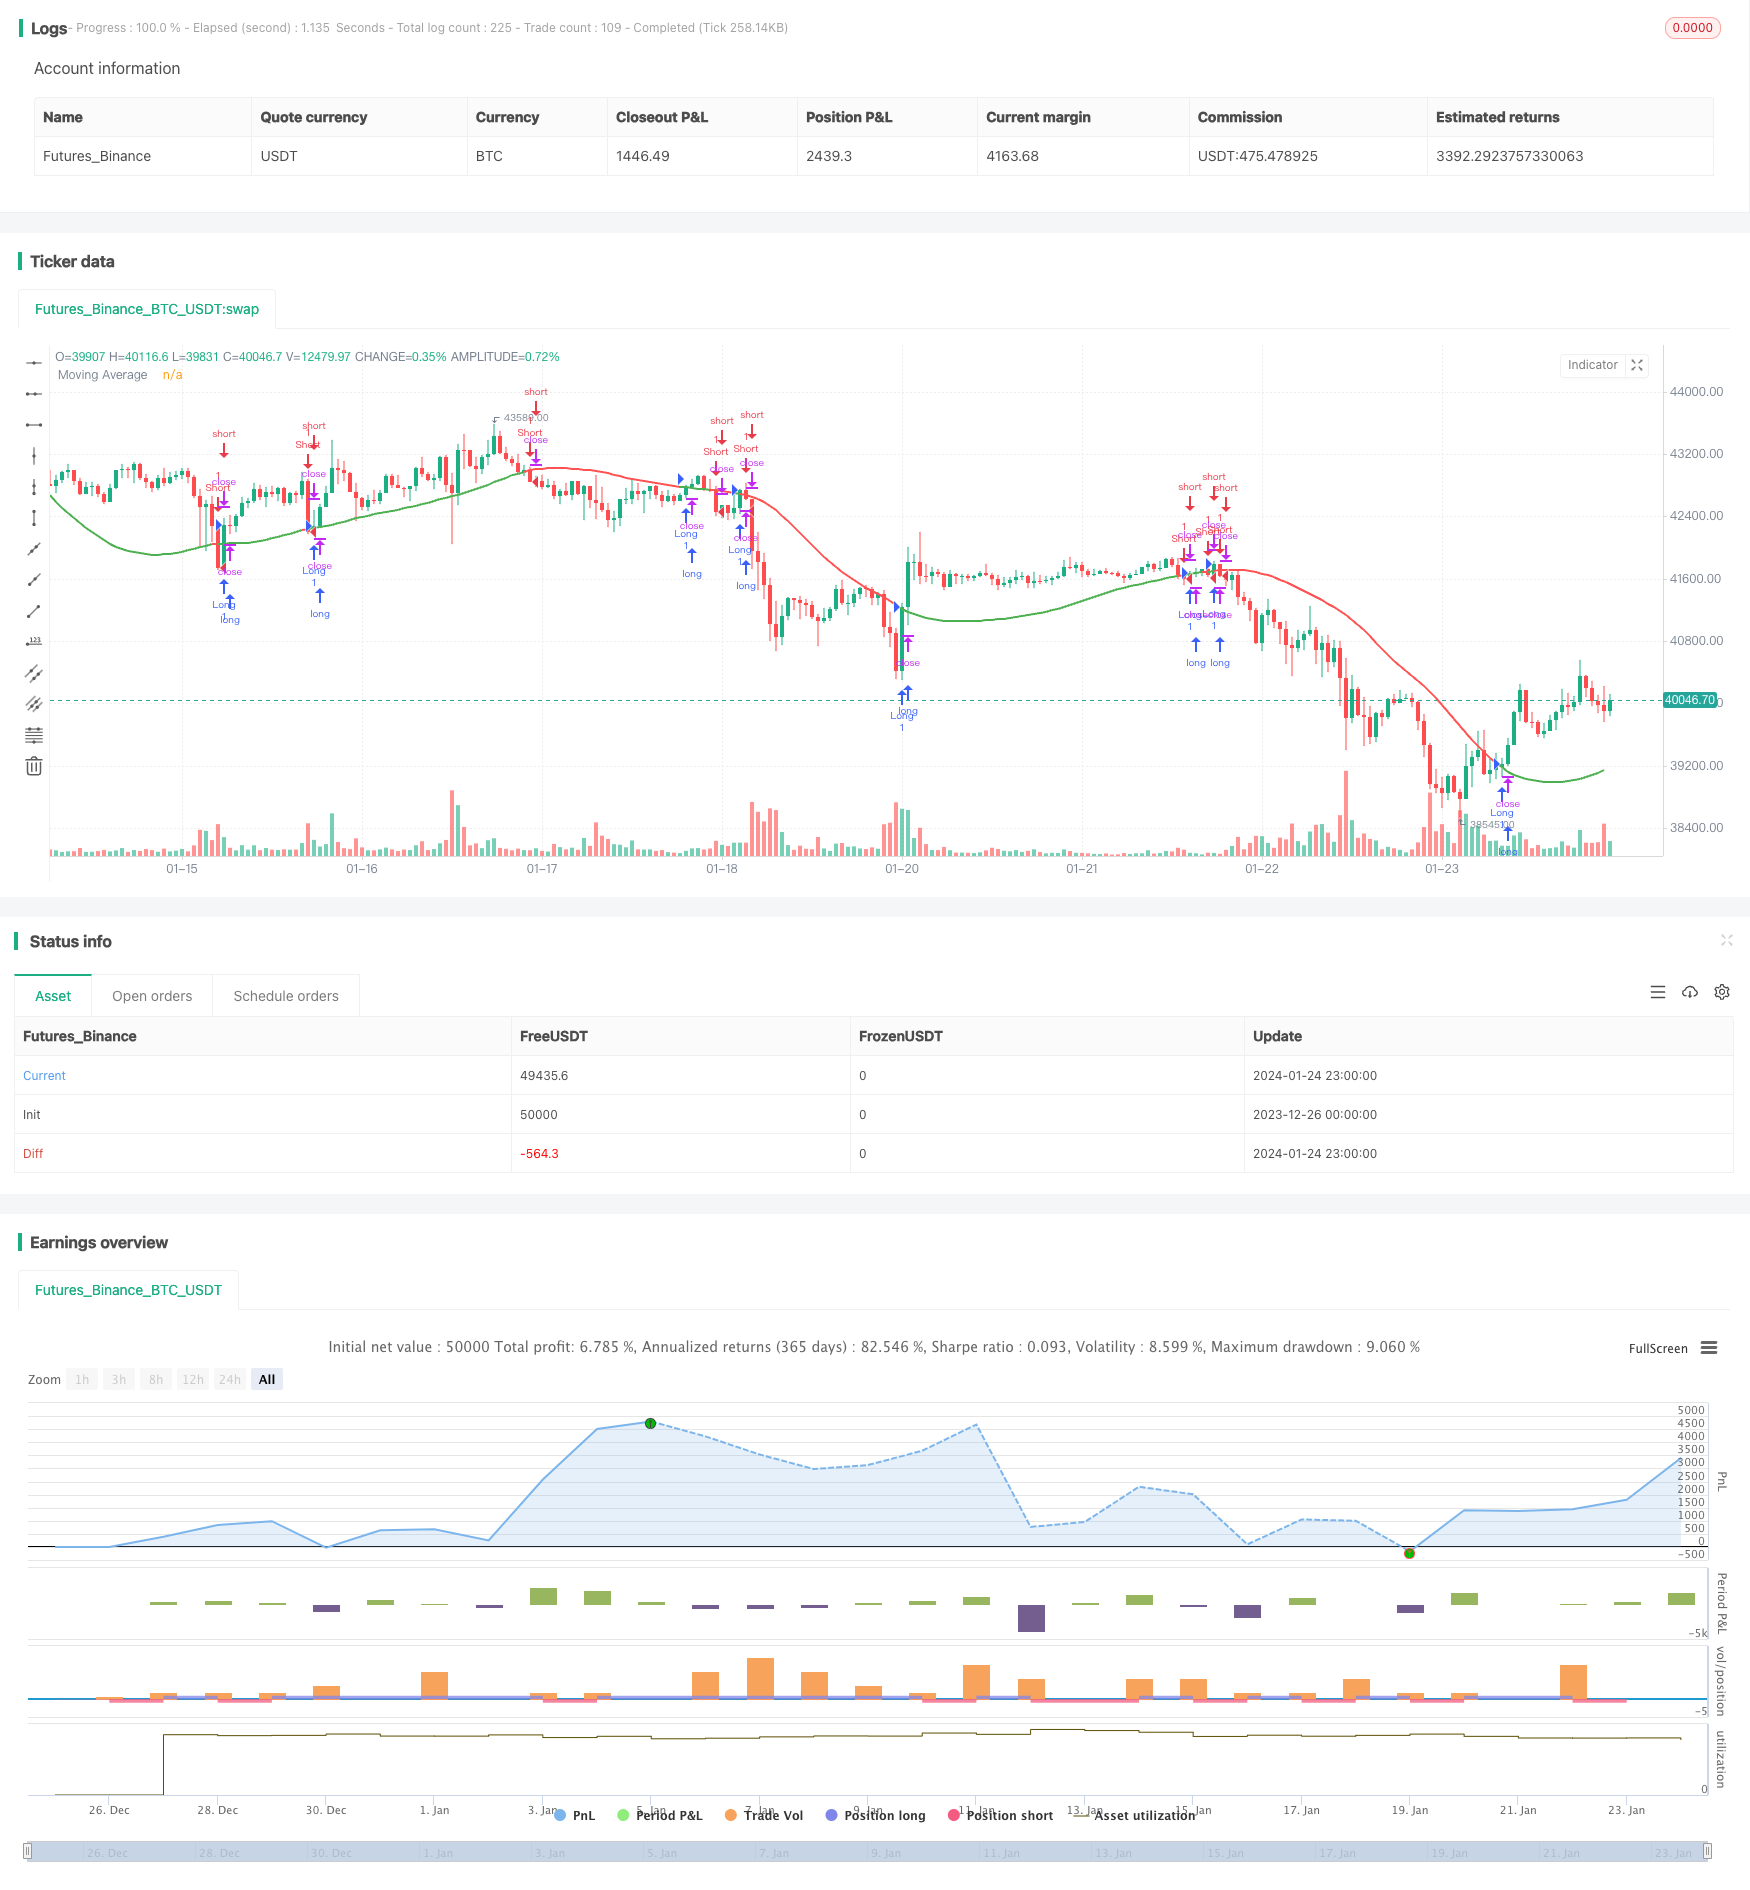
Overview
This strategy generates buy and sell signals based on the crossing of price with a moving average. It provides various types of moving averages and a tolerance parameter to filter false breakouts. The strategy aims to capture turning points in price trends for trend following.
Strategy Logic
The strategy calculates a length N moving average based on the closing price. Typical moving average types include Simple Moving Average (SMA), Exponential Moving Average (EMA), Weighted Moving Average (WMA) etc. Then a tolerance level is set, e.g. 5%, and upper band (1.05 times moving average) and lower band (0.95 times moving average) are calculated. When closing price crosses above upper band, a buy signal is generated. When closing price crosses below lower band, a sell signal is generated. This helps filter some false breakouts. Also, a Boolean parameter "Short Only" is provided. When enabled, only sell signals are generated for shorting the market.
Advantages
- Effectively follows price trends using moving average's trend following characteristics
- Provides various moving average types for flexible combinations
- Tolerance parameter helps filter false breakouts and avoid unnecessary trades
- Can go short only, suitable for catching downward trends
Risks
- Moving averages have lagging effect, may miss price turning points
- Not suitable for range-bound market environments
- Improper tolerance parameter settings may filter valid signals
- Going short has higher risks, need prudent operations
Optimization Directions
- Optimize moving average type and length parameters
- Test different tolerance parameter settings
- Add other indicators to filter signals
- Employ position sizing strategies
Conclusion
Overall this is a typical trend following strategy. It uses the relationship between price and moving average to determine trends, with some flexibility. Through parameter optimization and proper signal filtering, it can become a decent quant strategy. But controlling downside risks when shorting is important to avoid excessive losses.
Parameters
| Name | Default | What it controls |
|---|---|---|
| v_input_1 | 0 | MA Type: HMA | EMA | WMA | SMA | VWMA | RMA | TEMA |
| v_input_2 | 100 | Length |
| v_input_3_close | 0 | Source: close | high | low | open | hl2 | hlc3 | hlcc4 | ohlc4 |
| v_input_4 | false | Tolerance (%) |
| v_input_5 | false | Short only |
Source Pine Script
/*backtest
start: 2023-12-26 00:00:00
end: 2024-01-25 00:00:00
period: 1h
basePeriod: 15m
exchanges: [{"eid":"Futures_Binance","currency":"BTC_USDT"}]
*/

// This source code is subject to the terms of the Mozilla Public License 2.0 at https://mozilla.org/MPL/2.0/
// © RafaelPiccolo

//@version=4
strategy("Price X MA Cross", overlay=true)

typ = input("HMA", "MA Type", options=["SMA", "EMA", "WMA", "HMA", "VWMA", "RMA", "TEMA"])
len = input(100, minval=1, title="Length")
src = input(close, "Source", type=input.source)
tol = input(0, minval=0, title="Tolerance (%)", type=input.float)
shortOnly = input(false, "Short only")

tema(src, len)=>
    ema1 = ema(src, len)
    ema2 = ema(ema1, len)
    ema3 = ema(ema2, len)
    return = 3 * (ema1 - ema2) + ema3

getMAPoint(type, len, src)=>
    return = type == "SMA" ? sma(src, len) : type == "EMA" ? ema(src, len) : type == "WMA" ? wma(src, len) : type == "HMA" ? hma(src, len) : type == "VWMA" ? vwma(src, len) : type == "RMA" ? rma(src, len) : tema(src, len)

ma = getMAPoint(typ, len, src)
upperTol = ma * (1 + tol/100)
lowerTol = ma * (1 - tol/100)

longCondition = crossover(close, upperTol)
shortCondition = crossunder(close, lowerTol)

if (shortCondition)
    strategy.entry("Short", strategy.short)

if (longCondition)
    if (shortOnly)
        strategy.close("Short")
    else
        strategy.entry("Long", strategy.long)

plot(ma, "Moving Average", close > ma ? color.green : color.red, linewidth = 2)
t1 = plot(tol > 0 ? upperTol : na, transp = 70)
t2 = plot(tol > 0 ? lowerTol : na, transp = 70)
fill(t1, t2, color = tol > 0 ? color.blue : na)
Published by ChaoZhang on the FMZ strategy square · last modified 2024-01-26. Collected in the Quant Trading Vault. Unvalidated research: re-test with your own data and costs before trusting it.
Build this with AgenKit
A spec is not a trading system. Paste this into your coding agent and AgenKit runs a specialist team — architecture, test-first build, risk gates, review — with paper trading on by default.
/agenkit build a production-grade trading bot with a backtest engine, risk controls and paper trading by default from strategies/Price-Crossing-Moving-Average-Trend-Following-Strategy.md- npx agenkit install engineering-kit in your project
- Paste the command into your agent and approve each phase
- Get tests, backtest, risk controls and a paper-trading switch
Understand it first
Before you run this, read the lesson behind the idea and how to backtest it honestly. Specs like this one are the survivors of an unknown number of trials; deflate their results accordingly.
Related specs
- ADX MA and EMA Long Only Trend Tracking StrategyPine Script · Trend following · 1d
- ATR and Moving Average Crossover Hybrid StrategyPine Script · Trend following · 1h
- Bollinger Band Moving Average Crossover StrategyPine Script · Trend following · 1h
- Bollinger Bands and EMA Trend Following StrategyPine Script · Trend following · 1h
- Bollinger Bands and RSI Trend Following StrategyPine Script · Trend following · 1h
- Candlestick Pattern Trend Filter StrategyPine Script · Trend following · 1d