Strategy vault / Mean reversion
Price Reversal RSI Combo Strategy
This strategy combines the price reversal strategy and the Relative Strength Index (RSI) indicator to achieve an organic combination of trend judgment and overbought-oversold detection. The price reversal part judges…
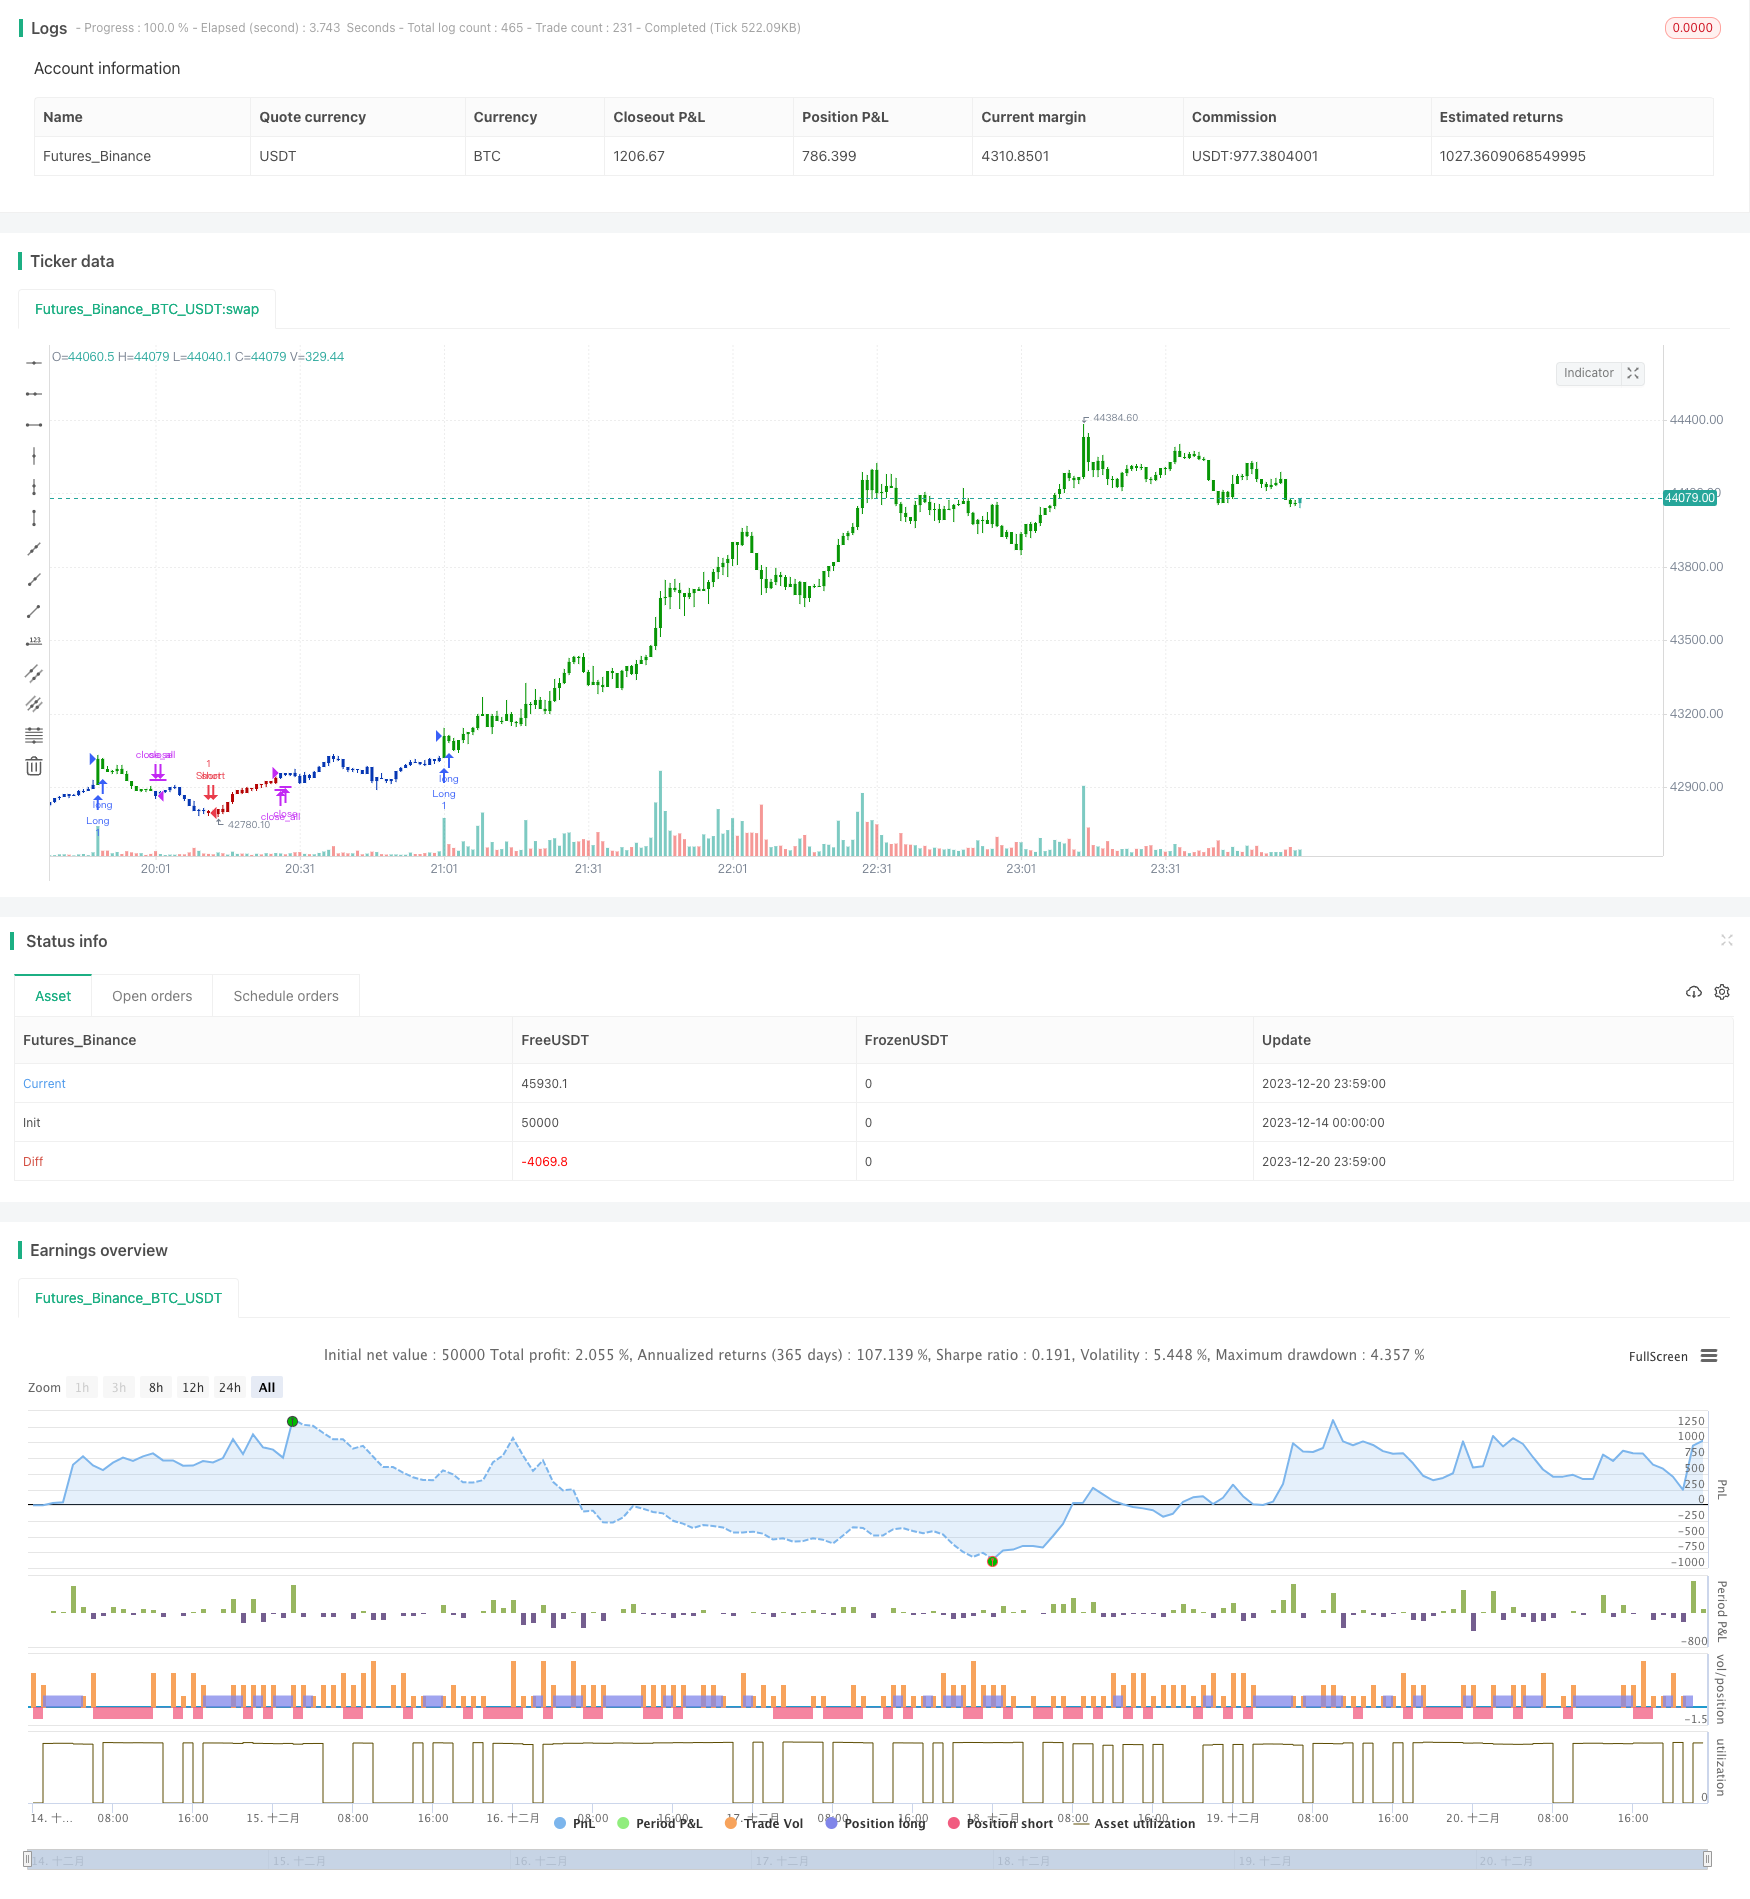
Overview
This strategy combines the price reversal strategy and the Relative Strength Index (RSI) indicator to achieve an organic combination of trend judgment and overbought-oversold detection. The price reversal part judges whether a price reversal signal has occurred, and the RSI part is used to determine whether the market is overbought or oversold. The combination of the two signals can effectively filter out false signals and improve signal quality.
Strategy Principle
The price reversal part uses the 123 pattern to judge price reversals. Specifically, when the closing price is lower than the previous closing price for 2 consecutive days, and the 9-day stochastic indicator lower channel line is higher than 50, a buy signal is generated; When the closing price is higher than the previous closing price for 2 consecutive days, and the 9-day stochastic oscillator upper channel line is lower than 50, a sell signal is generated.
The RSI part judges whether the market is overbought or oversold according to whether the Relative Strength Index is higher than 70 or lower than 30. An RSI above 70 is an overbought signal, and an RSI below 30 is an oversold signal.
Finally, a logical "AND" operation is performed on the price reversal signal and the RSI signal. That is, only when both are buy or sell signals will an actual trading signal be generated to enter the market. This effectively filters out false signals from single indicators and improves signal quality.
Advantage Analysis
The combination of multiple indicators to judge can effectively filter out false signals.
This strategy uses price pattern indicators and overbought-oversold indicators at the same time. The two signals need to be in the same direction before entering the market. This can maximize filtering out the false signals that a single indicator may produce and ensure the reliability of each entry signal.
The trading method with reversal as the main and trend as the accessory.
The price reversal part mainly uses the 123 pattern to judge the reversal situation. This is a typical reversal trading method. At the same time, the RSI indicator can also judge trends and act as an auxiliary confirmation. The combination of reversal-based and trend-assisted can capture reversal opportunities while avoiding trend conflicts.
Simple parameter settings for easy live trading operations.
This strategy uses only two common indicators with a moderate number of parameters. This makes the overall structure of the strategy simple and clear, with low difficulty for live operations, which is easy to master. This is very important for live traders.
Risk Analysis
Risk of reversal failure
There is a probability of failure inherent in price reversal trading that cannot be completely avoided. When the price forms a 123 signal but then reverses back again. This will cause the trade to fail.
Risk of excessively high trading frequency
The standard of the strategy itself is relatively loose, which easily generates more trading signals. If not controlled, it will lead to excessively high operating frequencies, increasing trading costs and psychological pressure.
Improper RSI Parameter Settings
The overbought/oversold zones of the RSI indicator default to 30-70. These are empirical parameters. If the actual market does not match, correct signals may be missed or incorrect signals may be issued.
Risk Mitigation
Adjust position size appropriately to control single loss.
Increase filtering conditions to reduce trading frequency. For example, add moving average judgment.
Test different markets and dynamically adjust RSI parameter ranges to set reasonable values.
Strategy Optimization
Add moving average indicator judgment
On the existing basis, add a moving average judgment rule to filter out small-range noise to some extent.
Optimize RSI parameter settings
Through backtesting historical data, test and determine the optimal parameter combination of RSI overbought and oversold values.
Evaluate the profit-loss ratio as the position exit
In addition to the existing stop loss method, a profit target versus stop loss relationship exit mechanism can be added to lock in profits.
Summary
This strategy uses double confirmation of price reversal judgment and RSI indicator judgment to implement a trading idea of reversal-based and trend-assisted. At the same time, the parameter settings are simple and easy to grasp for live trading. Through optimization, more filtering conditions can be added to reduce the trading frequency while maintaining the signal capture quality. The overall performance of this strategy is good and it has value for practical use.
Parameters
| Name | Default | What it controls |
|---|---|---|
| v_input_1 | true | ---- 123 Reversal ---- |
| v_input_2 | 14 | Length |
| v_input_3 | true | KSmoothing |
| v_input_4 | 3 | DLength |
| v_input_5 | 50 | Level |
| v_input_6 | true | ---- RSI ---- |
| v_input_7 | 12 | LengthRSI |
| v_input_8 | 30 | Oversold |
| v_input_9 | 70 | Overbought |
| v_input_10 | false | Trade reverse |
Source Pine Script
/*backtest
start: 2023-12-14 00:00:00
end: 2023-12-21 00:00:00
period: 1m
basePeriod: 1m
exchanges: [{"eid":"Futures_Binance","currency":"BTC_USDT"}]
*/

//@version=4
////////////////////////////////////////////////////////////
//  Copyright by HPotter v1.0 16/08/2021
// This is combo strategies for get a cumulative signal.
//
// First strategy
// This System was created from the Book "How I Tripled My Money In The
// Futures Market" by Ulf Jensen, Page 183. This is reverse type of strategies.
// The strategy buys at market, if close price is higher than the previous close
// during 2 days and the meaning of 9-days Stochastic Slow Oscillator is lower than 50.
// The strategy sells at market, if close price is lower than the previous close price
// during 2 days and the meaning of 9-days Stochastic Fast Oscillator is higher than 50.
//
// Second strategy
// The RSI is a very popular indicator that follows price activity.
// It calculates an average of the positive net changes, and an average
// of the negative net changes in the most recent bars, and it determines
// the ratio between these averages. The result is expressed as a number
// between 0 and 100. Commonly it is said that if the RSI has a low value,
// for example 30 or under, the symbol is oversold. And if the RSI has a
// high value, 70 for example, the symbol is overbought.
//
// WARNING:
// - For purpose educate only
// - This script to change bars colors.
////////////////////////////////////////////////////////////
Reversal123(Length, KSmoothing, DLength, Level) =>
    vFast = sma(stoch(close, high, low, Length), KSmoothing)
    vSlow = sma(vFast, DLength)
    pos = 0.0
    pos := iff(close[2] < close[1] and close > close[1] and vFast < vSlow and vFast > Level, 1,
	         iff(close[2] > close[1] and close < close[1] and vFast > vSlow and vFast < Level, -1, nz(pos[1], 0)))
	pos


mRSI(Length,Oversold,Overbought) =>
    pos = 0.0
    xRSI = rsi(close, Length)
    pos:=iff(xRSI > Overbought, 1,
	       iff(xRSI < Oversold, -1, nz(pos[1], 0)))
    pos

strategy(title="Combo Backtest 123 Reversal & RSI", shorttitle="Combo", overlay = true)
line1 = input(true, "---- 123 Reversal ----")
Length = input(14, minval=1)
KSmoothing = input(1, minval=1)
DLength = input(3, minval=1)
Level = input(50, minval=1)
//-------------------------
line2 = input(true, "---- RSI ----")
LengthRSI = input(12, minval=1)
Oversold = input(30, minval=1)
Overbought = input(70, minval=1)
reverse = input(false, title="Trade reverse")
posReversal123 = Reversal123(Length, KSmoothing, DLength, Level)
posmRSI = mRSI(LengthRSI,Oversold,Overbought)
pos = iff(posReversal123 == 1 and posmRSI == 1 , 1,
	   iff(posReversal123 == -1 and posmRSI == -1, -1, 0))
possig = iff(reverse and pos == 1, -1,
          iff(reverse and pos == -1 , 1, pos))
if (possig == 1 )
    strategy.entry("Long", strategy.long)
if (possig == -1 )
    strategy.entry("Short", strategy.short)
if (possig == 0)
    strategy.close_all()
barcolor(possig == -1 ? #b50404: possig == 1 ? #079605 : #0536b3 )Published by ChaoZhang on the FMZ strategy square · last modified 2023-12-22. Collected in the Quant Trading Vault. Unvalidated research: re-test with your own data and costs before trusting it.
Build this with AgenKit
A spec is not a trading system. Paste this into your coding agent and AgenKit runs a specialist team — architecture, test-first build, risk gates, review — with paper trading on by default.
/agenkit build a production-grade trading bot with a backtest engine, risk controls and paper trading by default from strategies/Price-Reversal-RSI-Combo-Strategy.md- npx agenkit install engineering-kit in your project
- Paste the command into your agent and approve each phase
- Get tests, backtest, risk controls and a paper-trading switch
Understand it first
Before you run this, read the lesson behind the idea and how to backtest it honestly. Specs like this one are the survivors of an unknown number of trials; deflate their results accordingly.
Related specs
- Advanced 15 Minute Chart Trading Signal StrategyPine Script · Mean reversion · 3h
- Bollinger Bands Stochastic RSI Extreme Strategy BBSR Extreme StrategyPine Script · Mean reversion · 1h
- BuySell Strategy depends on AOStochRSIATRPine Script · Mean reversion · 30m
- Byron Serpent Cloud Quant StrategyPine Script · Mean reversion · 1h
- Dual Momentum Trend Reversal Strategy Based on RSI and Stochastic RSIPine Script · Mean reversion · 1h
- Dynamic Adaptive Multi Timeframe Trend Following and Range Reversal Hybrid StrategyPine Script · Mean reversion · 2d