Prime Number Oscillator Trading Strategy
This strategy uses the Prime Number Oscillator indicator to determine market trends and construct long/short positions accordingly. The PNO calculates the difference between the nearest prime number to price and the…
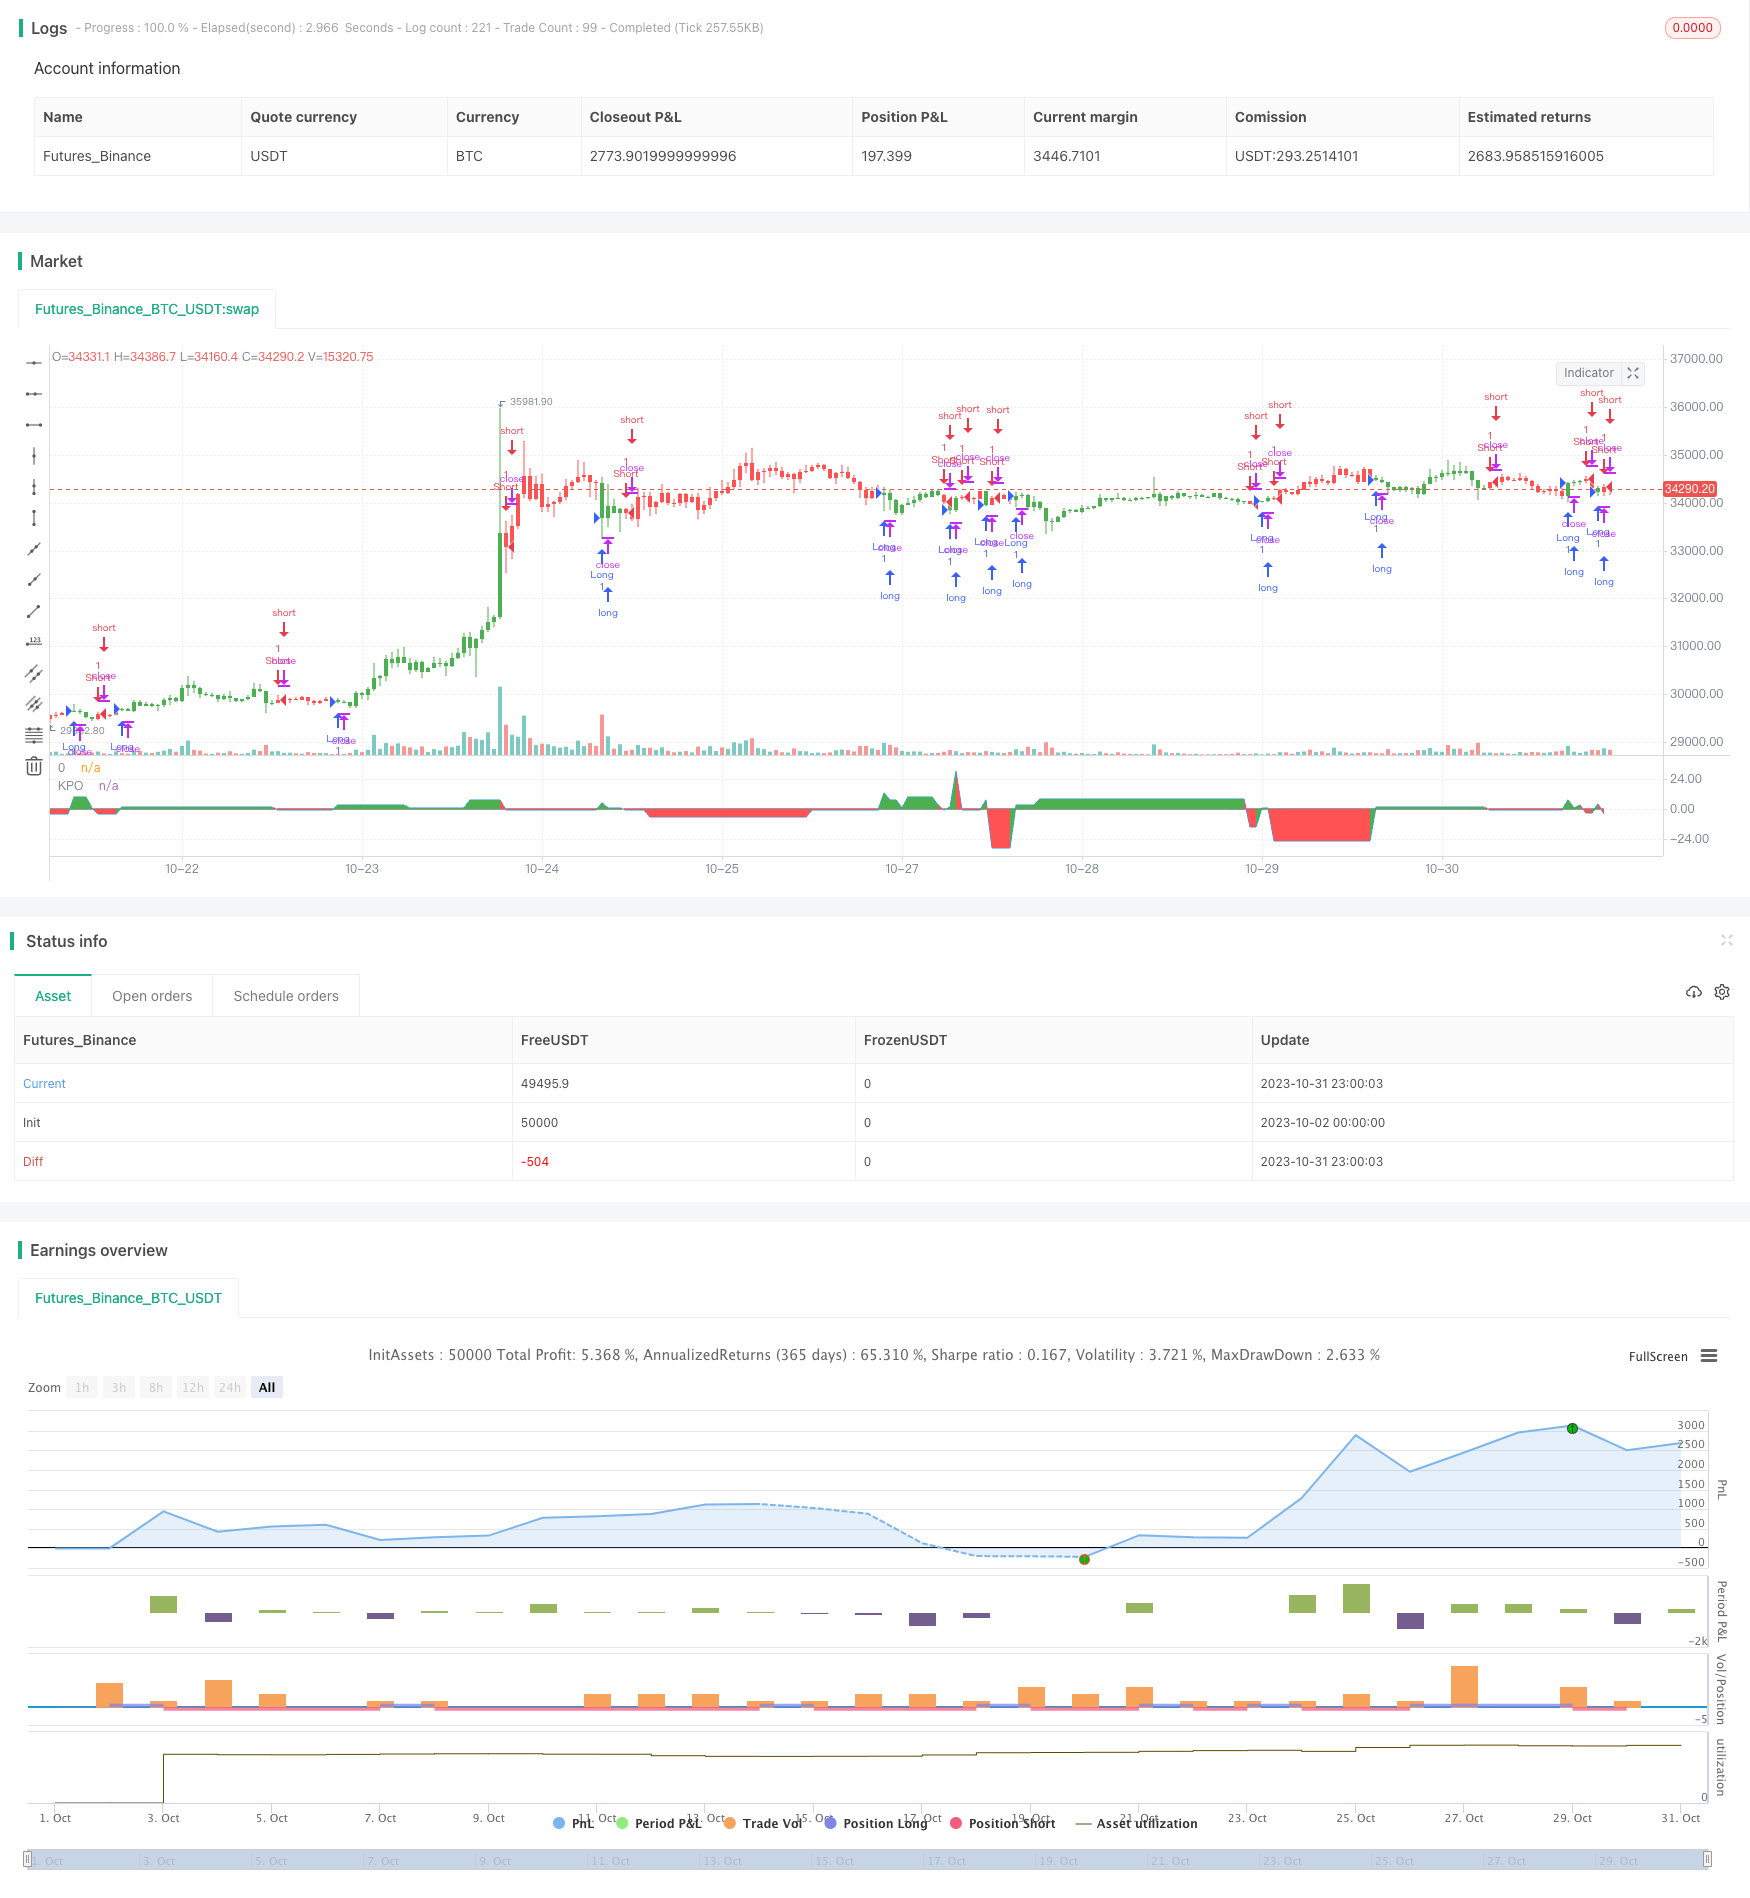
Overview
This strategy uses the Prime Number Oscillator indicator to determine market trends and construct long/short positions accordingly. The PNO calculates the difference between the nearest prime number to price and the price itself, with positive values indicating bullish trends and negative values indicating bearish trends. The strategy can capture hidden trend information during price oscillations and provide guidance for breakout trading.
Strategy Logic
The strategy first defines a PrimeNumberOscillator function that takes price and allowedPercent as parameters. The function searches for the nearest prime number to price within the allowedPercent range and returns their difference. A positive difference indicates bullish and a negative difference indicates bearish.
In the strategy, the PrimeNumberOscillator function is called to compute the xPNO value. The position direction is determined by the sign of xPNO and multiplied by the reverseFactor to get the final trade direction. Long/short positions are opened based on the direction.
The strategy mainly relies on the PNO indicator for trend direction. The indicator itself is quite crude and needs to be combined with other factors for signal verification. But it is based on mathematical principles and can provide some objective guidance.
Advantage Analysis
- Based on mathematical principles, relatively objective
- Can identify trends hidden in oscillations
- Flexible parameter tuning for sensitivity adjustment
- Simple to implement, easy to understand and optimize
Risk Analysis
- PNO itself is crude, prone to multiple false signals
- Needs verification from other technical indicators, cannot be used alone
- Careful parameter selection needed, too large or small will fail
- High trading frequency, position sizing needs control
Optimization Directions
- Add filters like moving average, RSI for signal verification
- Implement stop loss to limit downside risk
- Dynamically adjust allowedPercent based on market conditions
- Optimize position sizing through volatility and other metrics
Conclusion
The strategy determines trend direction based on prime number oscillation principles, with simple logic and implementation. But PNO has limitations that require cautious use. Combining other technical indicators to verify signals and control risk is needed. As a typical representative of mathematical trading strategies, it has reference value for study and research.
Parameters
| Name | Default | What it controls |
|---|---|---|
| v_input_1 | 5 | Tolerance Percentage |
| v_input_2 | false | Trade reverse |
Source Pine Script
/*backtest
start: 2023-10-02 00:00:00
end: 2023-11-01 00:00:00
period: 1h
basePeriod: 15m
exchanges: [{"eid":"Futures_Binance","currency":"BTC_USDT"}]
*/

//@version=2
////////////////////////////////////////////////////////////
//  Copyright by HPotter v1.0 29/03/2018
// Determining market trends has become a science even though a high number or people
// still believe it's a gambling game. Mathematicians, technicians, brokers and investors
// have worked together in developing quite several indicators to help them better understand
// and forecast market movements.
//
// Developed by Modulus Financial Engineering Inc., the prime number oscillator indicates the
// nearest prime number, be it at the top or the bottom of the series, and outlines the
// difference between that prime number and the respective series.
//
// You can change long to short in the Input Settings
// WARNING:
//  - For purpose educate only
//  - This script to change bars colors.
////////////////////////////////////////////////////////////
PrimeNumberOscillator(price, percent) =>
    res = 0
    res1 = 0
    res2 = 0
    for j = price to price + (price * percent / 100)
        res1 := j
	    for i = 2 to sqrt(price)
        	res1 := iff(j % i == 0 , 0, j)
            if res1 == 0
                break
		if res1 > 0
		    break
    for j = price to price - (price * percent / 100)
        res2 := j
	    for i = 2 to sqrt(price)
        	res2 := iff(j % i == 0 , 0, j)
            if res2 == 0
                break
		if res2 > 0
		    break
    res := iff(res1 - price < price - res2,  res1 - price, res2 - price)
    res := iff(res == 0, res[1], res)
    res

strategy(title="Prime Number Oscillator Backtest")
percent = input(5, minval=0.01, step = 0.01, title="Tolerance Percentage")
reverse = input(false, title="Trade reverse")
xPNO = PrimeNumberOscillator(close, percent)
pos = iff(xPNO > 0, 1,
       iff(xPNO < 0, -1, nz(pos[1], 0)))
possig = iff(reverse and pos == 1, -1,
          iff(reverse and pos == -1, 1, pos))
if (possig == 1)
    strategy.entry("Long", strategy.long)
if (possig == -1)
    strategy.entry("Short", strategy.short)
barcolor(possig == -1 ? red: possig == 1 ? green : blue )
clr = iff(xPNO > 0, green, red)
p1 = plot(xPNO, color=blue, title="KPO")
p2 = plot(0, color=black, title="0")
fill(p1,p2,color=clr)Published by ChaoZhang on the FMZ strategy square · last modified 2023-11-02. Collected in the Quant Trading Vault. Unvalidated research: re-test with your own data and costs before trusting it.
Build this with AgenKit
A spec is not a trading system. Paste this into your coding agent and AgenKit runs a specialist team — architecture, test-first build, risk gates, review — with paper trading on by default.
/agenkit build a production-grade trading bot with a backtest engine, risk controls and paper trading by default from strategies/Prime-Number-Oscillator-Trading-Strategy.md- npx agenkit install engineering-kit in your project
- Paste the command into your agent and approve each phase
- Get tests, backtest, risk controls and a paper-trading switch
Understand it first
Before you run this, read the lesson behind the idea and how to backtest it honestly. Specs like this one are the survivors of an unknown number of trials; deflate their results accordingly.
Related specs
- Bollinger Band Channel Breakout Trading StrategyPine Script · Breakout · 1d
- Bollinger Bands Dynamic Breakout StrategyPine Script · Breakout · 1h
- Bull Market Tracking SystemPine Script · Breakout · 1h
- Cross boundary Dynamic Range Quantitative Trading Strategy Based on Bollinger BandsPine Script · Breakout · 3h
- Cross period Value Area Breakout StrategyPine Script · Breakout · 1d
- Darvas Box Breakout and Risk Management Strategy DarvasPine Script · Breakout · 1d