Strategy vault / Trend following
Quantitative Trading Strategy Based on Moving Averages and Bollinger Bands
This strategy mainly utilizes moving averages and Bollinger Bands to capture market trends and volatility. It employs three different types of moving averages: Simple Moving Average (SMA), Weighted Moving Average…
Overview
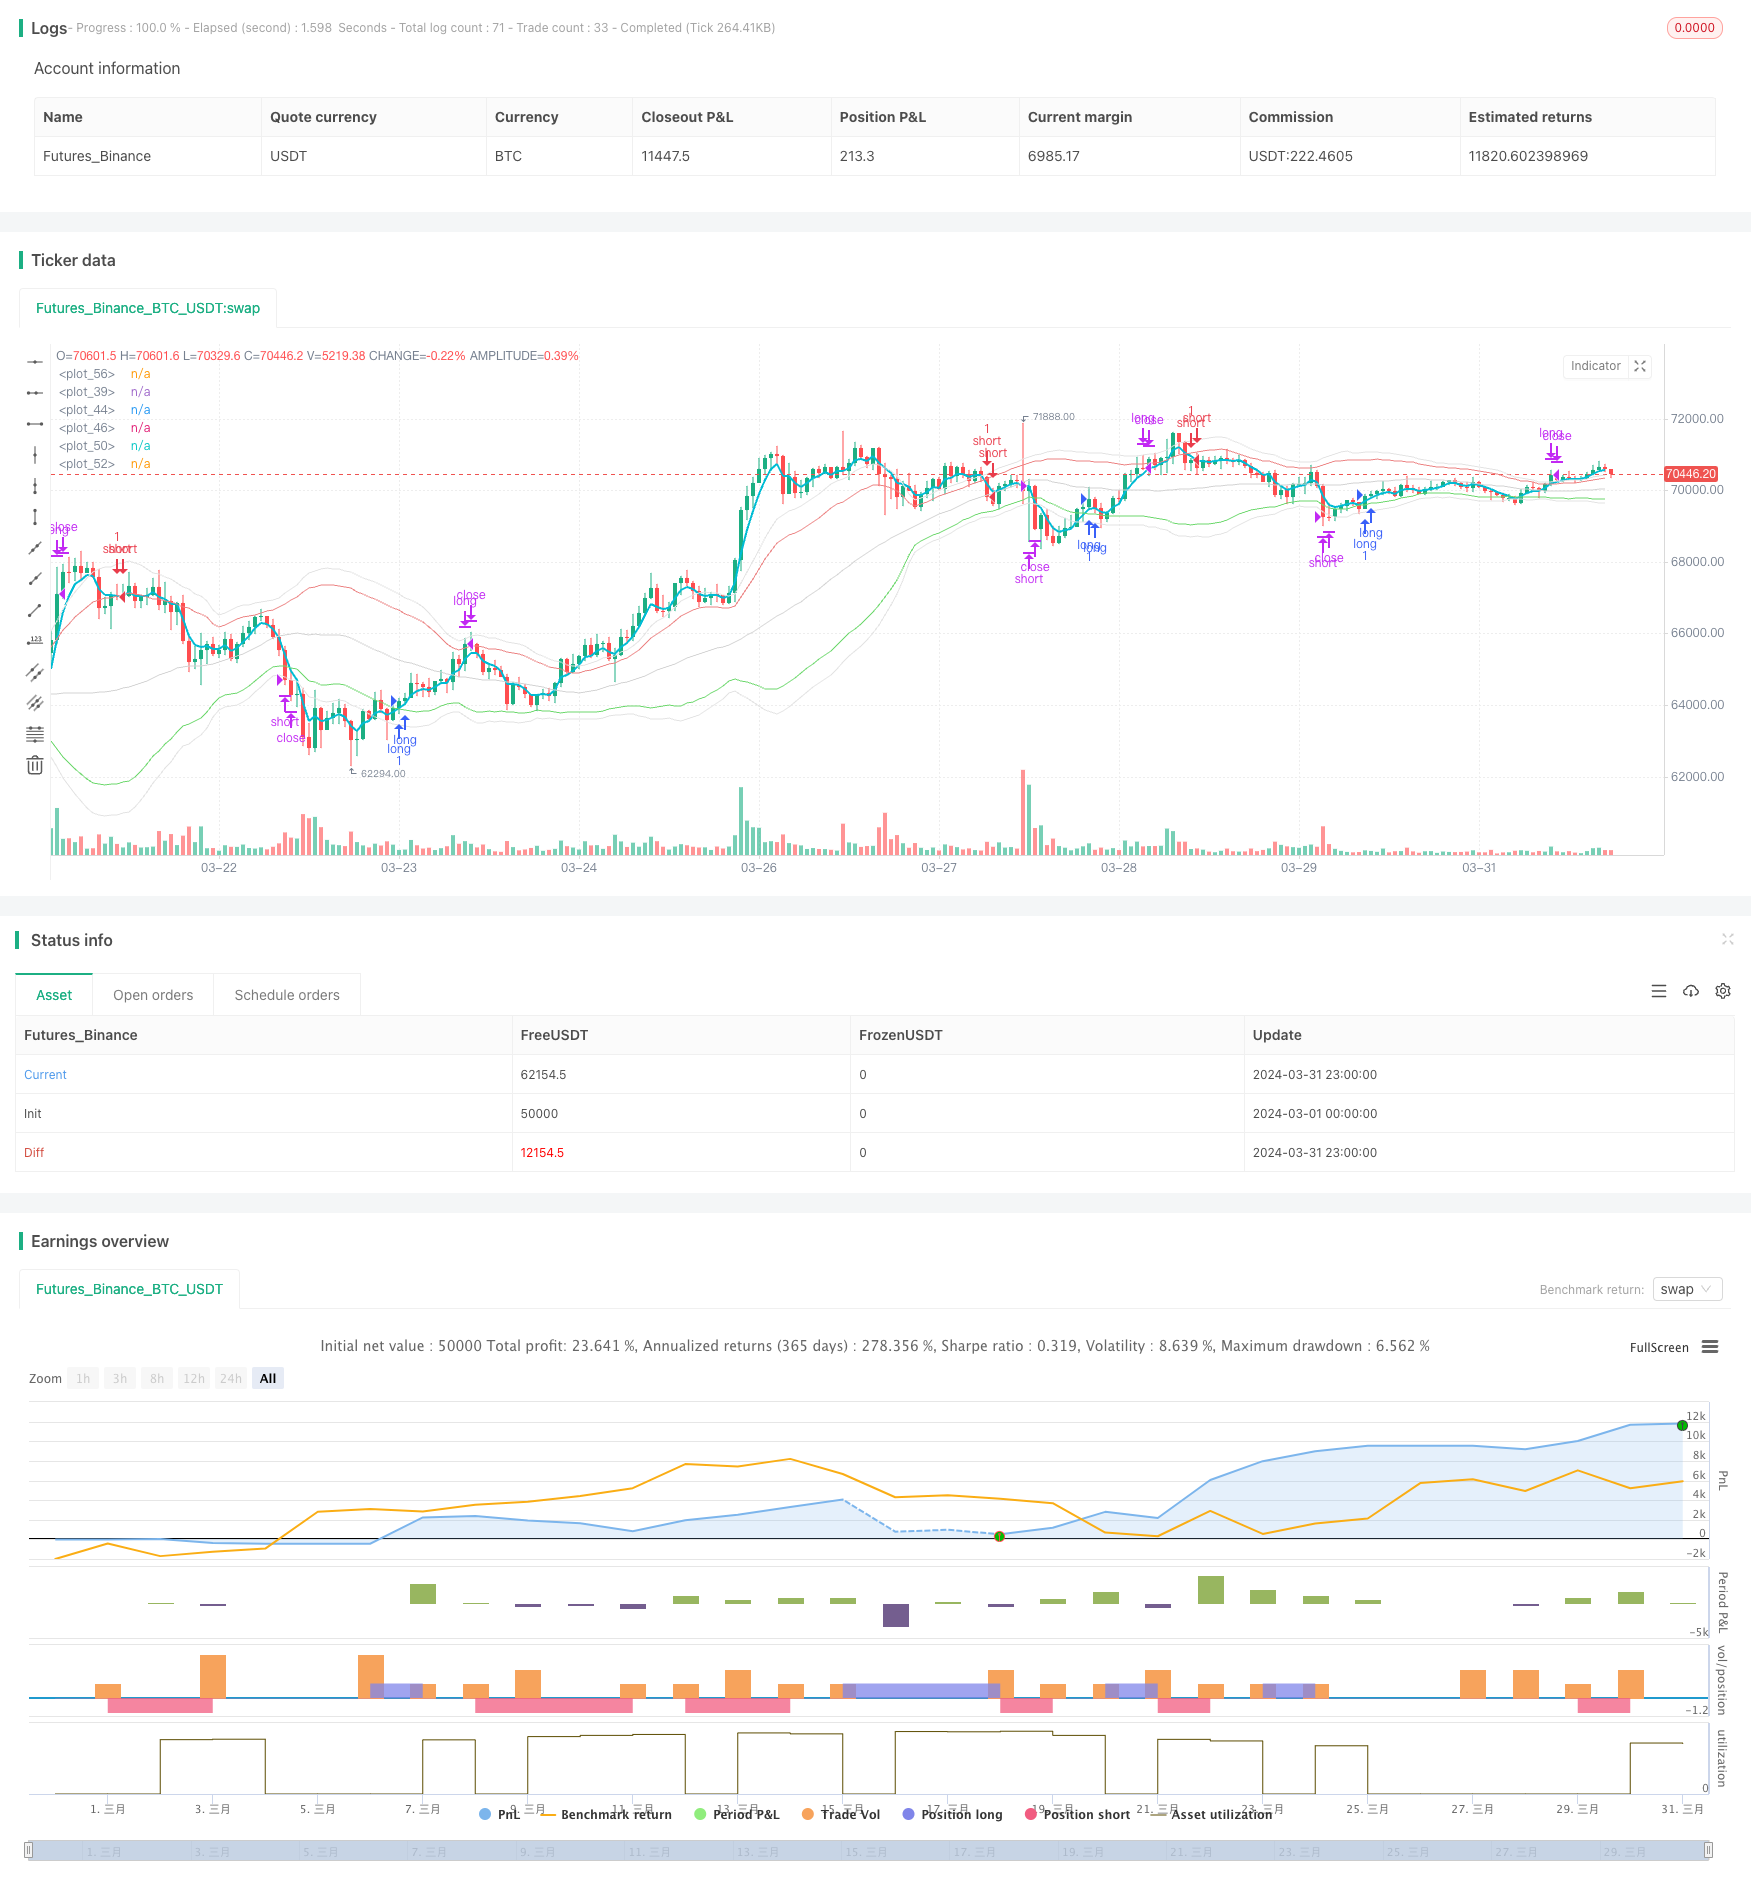
This strategy mainly utilizes moving averages and Bollinger Bands to capture market trends and volatility. It employs three different types of moving averages: Simple Moving Average (SMA), Weighted Moving Average (WMA), and Exponential Moving Average (EMA). At the same time, it uses Bollinger Bands to set price channels, with the upper and lower bands serving as signals for opening and closing positions. When the price breaks through the upper Bollinger Band, it opens a short position; when it breaks through the lower band, it opens a long position. It also sets wider Bollinger Bands as stop-loss levels, closing positions when the price breaches these bands. Overall, this strategy attempts to establish positions promptly when trends emerge and decisively cut losses when risks escalate, aiming to achieve stable returns.
Strategy Principles
- Calculate three moving averages with different periods: slow SMA, fast EMA, and medium WMA, reflecting the long-term, short-term, and medium-term market trends respectively.
- Compute two sets of Bollinger Bands based on price standard deviation: entry Bollinger Bands (with narrower distance between upper and lower bands) and stop-loss Bollinger Bands (with wider distance). Entry bands are used for opening positions, while stop-loss bands are used for closing positions.
- When the fast EMA crosses above the upper entry Bollinger Band, open a short position; when the fast EMA crosses below the lower entry Bollinger Band, open a long position. This implies that the price has deviated significantly from the mean and a trend may emerge.
- Once a position is open, if the price further crosses above the upper stop-loss Bollinger Band, close all long positions; if the price further crosses below the lower stop-loss Bollinger Band, close all short positions. This is to control losses and decisively stop loss once the trend reverses.
- The above process is repeated continuously, allowing the strategy to flexibly adjust positions according to market trends and stop losses in a timely manner, in order to achieve robust returns.
Strategy Advantages
- It considers three moving averages of different speeds, comprehensively capturing market trends at various levels.
- It introduces Bollinger Bands as conditions for opening and closing positions, which can be dynamically adjusted according to market volatility, flexibly adapting to market conditions.
- It sets stop-loss Bollinger Bands to control drawdowns and decisively closes positions when the market fluctuates dramatically, avoiding amplified losses.
- The logic is clear and the rules are simple, easy to implement and optimize.
- It has a wide range of applications and may be effective for various markets and time periods.
Strategy Risks
- In a sideways market, frequent opening and closing of positions may lead to substantial transaction costs, eroding profits.
- At the initial stage of a trend reversal, the strategy may still trade in the direction of the original trend, resulting in certain losses.
- For extreme market conditions, such as rapid price gaps, the stop-loss Bollinger Bands may not effectively control risks.
- Improper parameter selection (such as moving average periods, Bollinger Band widths, etc.) may invalidate the strategy.
- If the market continues to fluctuate, the strategy may not be able to capture significant trend opportunities for an extended period.
Strategy Optimization Directions
- Appropriately increase the parameters of moving average periods and Bollinger Band widths to reduce trading frequency and costs in a sideways market.
- Introduce more technical indicators or market sentiment indicators as filters to improve the accuracy of entry signals and avoid losing trades that may occur at the beginning of a trend.
- Set special rules for extreme market conditions, such as suspending new positions when gaps occur, to control risks.
- Optimize parameters to find the most suitable combination for the current market, enhancing the robustness of the strategy.
- Add position management and capital management rules, such as adjusting positions based on trend strength or profitability, setting overall stop-loss lines, etc., to further control strategy risks.
Summary
The Marina Parfenova School Project Bot is a quantitative trading strategy based on moving averages and Bollinger Bands. It attempts to profit by capturing market trends while controlling drawdowns through Bollinger Band stop-loss lines. The strategy logic is simple and straightforward, with a wide range of applications, and parameters can be flexibly adjusted according to market characteristics. However, in practical application, attention still needs to be paid to issues such as sideways markets, extreme conditions, parameter optimization, etc., and further refinement of capital and position management rules is necessary. Overall, this strategy can serve as a basic quantitative trading framework, which can be continuously optimized and improved upon to achieve more robust trading results.
Parameters
| Name | Default | What it controls |
|---|---|---|
| v_input_int_1 | 50 | Период медленной скользящей средней |
| v_input_int_2 | 4 | Период быстрой скользящей средней |
| v_input_int_3 | 30 | Период среднеквадратического отклонения |
| v_input_float_1 | 1.2 | Коэффициент ширины коридора покупки |
| v_input_float_2 | 1.6 | Коэффициент ширины коридора продажи |
Source Pine Script
/*backtest
start: 2024-03-01 00:00:00
end: 2024-03-31 23:59:59
period: 1h
basePeriod: 15m
exchanges: [{"eid":"Futures_Binance","currency":"BTC_USDT"}]
*/

//@version=5
strategy ("Marina Parfenova School Project Bot", overlay = true)

sma(price, n) =>
    result = 0.0
    for i = 0 to n - 1
        result := result + price [i] / n
    result

wma(price, n) =>
    result = 0.0
    sum_weight = 0.0
    weight = 0.0
    for i = 0 to n - 1
        weight := n - 1
        result := result + price [i]*weight
        sum_weight := sum_weight + weight
    result/sum_weight

ema(price, n) =>
    result = 0.0
    alpha = 2/(n + 1)
    prevResult = price
    if (na(result[1]) == false)
        prevResult := result[1]
    result := alpha * price + (1 - alpha) * prevResult

/// Настройки
n_slow = input.int(50, "Период медленной скользящей средней", step=5)
n_fast = input.int(4, "Период быстрой скользящей средней")
n_deviation = input.int(30, "Период среднеквадратического отклонения", step=5)
k_deviation_open = input.float(1.2, "Коэффициент ширины коридора покупки", step=0.1)
k_deviation_close = input.float(1.6, "Коэффициент ширины коридора продажи", step=0.1)

// ----- Линии индикаторов -----

// Медленная скользящая
sma = sma(close, n_slow)
plot(sma, color=#d3d3d3)

// Линии Боллинджера, обозначающие коридор цены
bollinger_open = k_deviation_open * ta.stdev(close, n_deviation)
open_short_line = sma + bollinger_open
plot(open_short_line, color=#ec8383)
open_long_line = sma - bollinger_open
plot(open_long_line, color=#6dd86d)

bollinger_close = k_deviation_close * ta.stdev(close, n_deviation)
close_short_line = sma + bollinger_close
plot(close_short_line, color=#e3e3e3)
close_long_line = sma - bollinger_close
plot(close_long_line, color=#e3e3e3)

// Быстрая скользящая
ema = ema(close, n_fast)
plot(ema, color = color.aqua, linewidth = 2)

// ----- Сигналы для запуска стратегии -----

// если ema пересекает линию open_short сверху вниз - сигнал на создание ордера в short
if(ema[1] >= open_short_line[1] and ema < open_short_line)
    strategy.entry("short", strategy.short)

// если ema пересекает линию open_long снизу вверх - сигнал на создание ордера в long
if(ema[1] <= open_long_line[1] and ema > open_long_line)
    strategy.entry("long", strategy.long)

// если свеча пересекает верхнюю линию коридора продажи - закрываем все long-ордера
if (high >= close_short_line)
    strategy.close("long")

// если свеча пересекает нижнюю линию коридора продажи - закрываем все short-ордера
if (low <= close_long_line)
strategy.close("short")Published by ChaoZhang on the FMZ strategy square · last modified 2024-04-26. Collected in the Quant Trading Vault. Unvalidated research: re-test with your own data and costs before trusting it.
Build this with AgenKit
A spec is not a trading system. Paste this into your coding agent and AgenKit runs a specialist team — architecture, test-first build, risk gates, review — with paper trading on by default.
/agenkit build a production-grade trading bot with a backtest engine, risk controls and paper trading by default from strategies/Quantitative-Trading-Strategy-Based-on-Moving-Averages-and-Bollinger-Bands.md- npx agenkit install engineering-kit in your project
- Paste the command into your agent and approve each phase
- Get tests, backtest, risk controls and a paper-trading switch
Understand it first
Before you run this, read the lesson behind the idea and how to backtest it honestly. Specs like this one are the survivors of an unknown number of trials; deflate their results accordingly.
Related specs
- ATR and Moving Average Crossover Hybrid StrategyPine Script · Trend following · 1h
- Bollinger Band Moving Average Crossover StrategyPine Script · Trend following · 1h
- Bollinger Bands and EMA Trend Following StrategyPine Script · Trend following · 1h
- Bollinger Bands and RSI Trend Following StrategyPine Script · Trend following · 1h
- Dual Moving Average Crossover Dynamic Position Optimization Strategy with EMA Cross Signal SystemPine Script · Trend following · 1h
- EMA Cross Trend Following Strategy with SMA Stop Loss and Re Entry MechanismPine Script · Trend following · 1h