Strategy vault / Trend following
Quantitative Trading Strategy Based on Supertrend Indicator and Equity Curve Trading
The core idea of this strategy is to combine the Supertrend indicator with equity curve trading. When the Supertrend indicator generates a buy or sell signal, we do not directly execute the trade. Instead, we check…
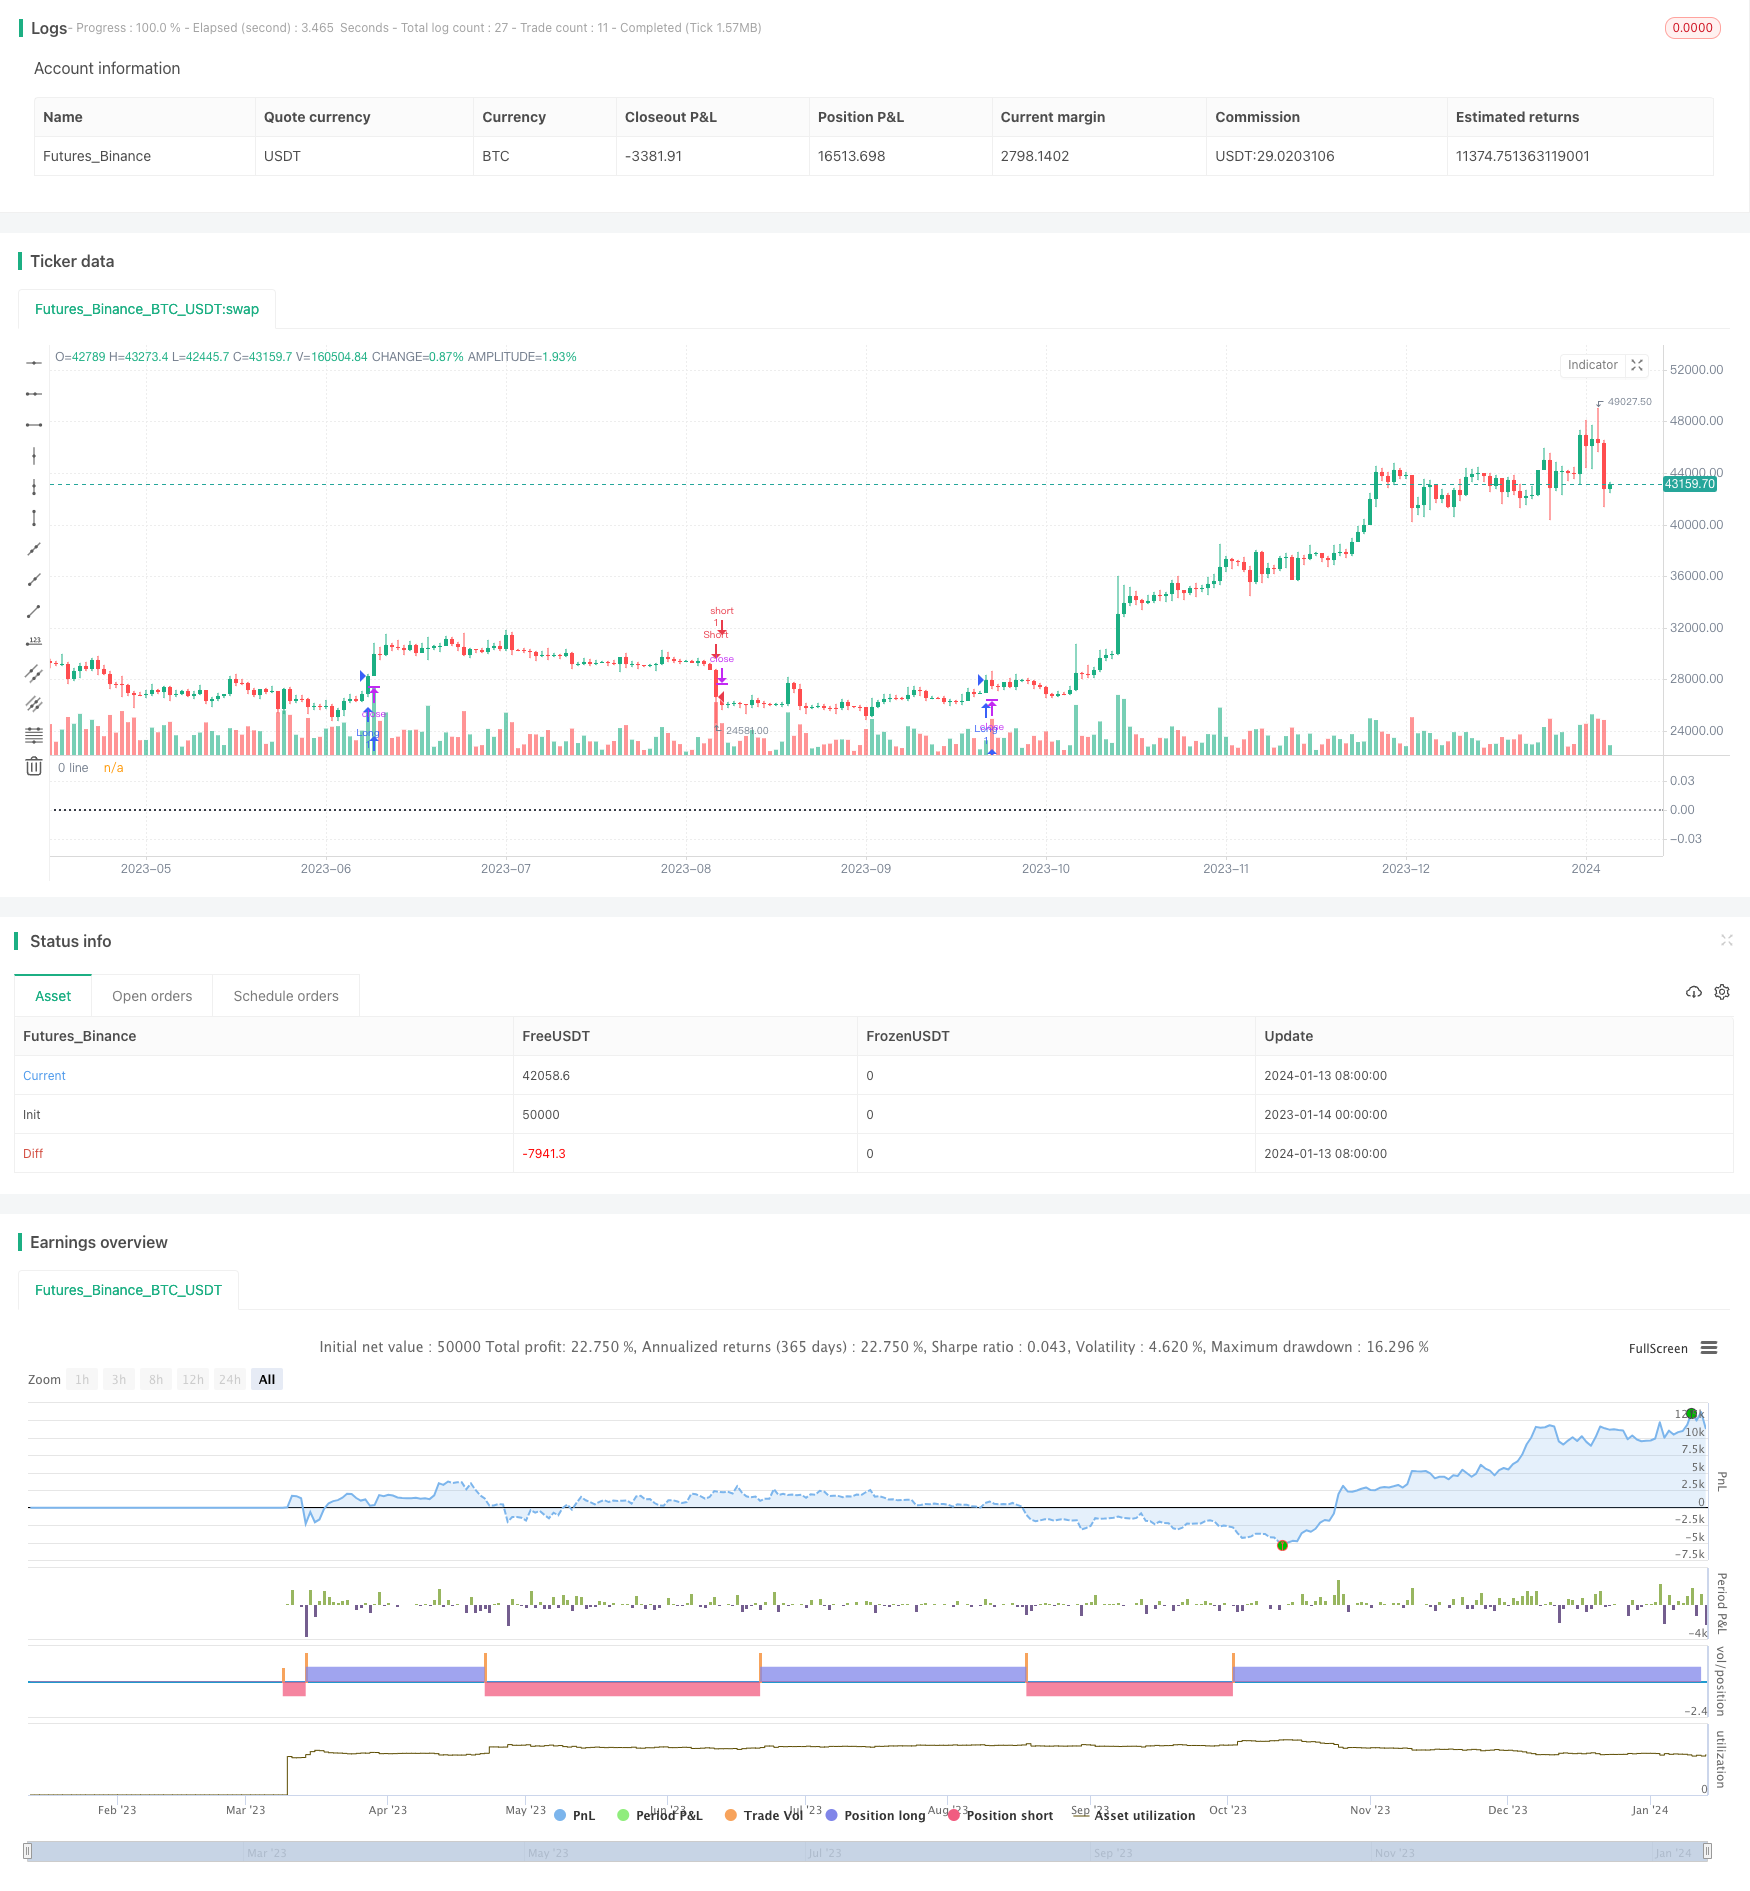
Overview
The core idea of this strategy is to combine the Supertrend indicator with equity curve trading. When the Supertrend indicator generates a buy or sell signal, we do not directly execute the trade. Instead, we check if the current equity curve is below its moving average. We will open positions only when the equity curve is above the moving average. When the equity curve is below the moving average, we will pause trading for the current strategy. This can effectively prevent the expansion of losses.
Strategy Logic
This strategy mainly consists of two parts:
- Supertrend Indicator
- Equity Curve Trading
The calculation formula for the Supertrend indicator is:
Upper Band = Source Price - ATR Multiplier * ATR Lower Band = Source Price + ATR Multiplier * ATR
Where ATR stands for Average True Range. The Supertrend indicator uses the ATR to set the upper and lower bands. A breakout above the upper band stands for a sell signal, while a breakout below the lower band stands for a buy signal.
The idea behind equity curve trading is that we take the moving average of the strategy's equity curve. When the equity curve falls below its moving average, we pause trading for the current strategy and wait for the equity curve to rebound back above the moving average before re-enabling trading.
This strategy combines the two techniques, so that after the Supertrend indicator generates a trading signal, we do not directly enter trades. Instead, we check if the current equity curve is above its moving average. Only when both conditions are met will we open positions. This can effectively mitigate the risks inherent in the Supertrend indicator itself and prevent excessive losses.
Advantages
The main advantages of this strategy are:
It can effectively prevent the risks of the Supertrend indicator. The Supertrend indicator itself cannot effectively curb losses. Equity curve trading makes up for this shortcoming.
When trading becomes unfavorable, it pauses trading to avoid excessive losses. We can resume trading after the market recovers.
It can automatically manage positions without manual intervention. Trading is paused automatically when the equity curve falls below the moving average, and resumed when the equity curve rebounds back above it.
Risks
There are also some risks with this strategy:
Incorrect parameter settings may render equity curve trading ineffective. Appropriate moving average periods need to be selected.
It may fail to adjust positions promptly when market trend changes. This can lead to certain losses.
It may miss good trading opportunities while waiting for the equity curve to rebound.
Counter measures:
Optimize parameters and select the best moving average period.
Incorporate other indicators to judge trend and adjust positions accordingly.
Shorten the duration of suspended trading to lower the probability of missing opportunities.
Optimization Directions
We can optimize the strategy from the following aspects:
Test different parameter combinations to find the optimal ATR period and multiplier.
Try other types of moving averages, like Exponential Moving Average, Hull Moving Average etc.
Add other indicators to determine market trend, and adjust positions when trend changes.
Optimize the moving average period to find the best balance. Too long periods may miss opportunities, while too short may pause too frequently.
Optimize the conditions to pause trading, like setting a stop loss threshold before suspension.
Conclusion
This strategy cleverly combines the Supertrend indicator with equity curve trading, leveraging the strengths of both techniques. The test results show that in most cases, applying equity curve trading actually decreases profitability. As such, this strategy is more suitable for defensive traders. With parameter and logic optimization, it can become a very practical quantitative trading strategy.
Parameters
| Name | Default | What it controls |
|---|---|---|
| v_input_bool_1 | true | Show Original Equity Curve and MA |
| v_input_bool_2 | true | Show Filtered Equity Curve by MA |
| v_input_int_1 | 25 | (?New Equity Curve Settings)EQ EMA len |
| v_input_1 | 10 | (?SuperTrend Settings)ATR Period |
| v_input_2_hl2 | 0 | Source: hl2 | high | low | open | close | hlc3 | hlcc4 | ohlc4 |
| v_input_float_1 | 3 | ATR Multiplier |
| v_input_3 | true | Change ATR Calculation Method ? |
Source Pine Script
/*backtest
start: 2023-01-14 00:00:00
end: 2024-01-14 00:00:00
period: 1d
basePeriod: 1h
exchanges: [{"eid":"Futures_Binance","currency":"BTC_USDT"}]
*/

//@version=5
strategy('Supertrend & Equity curve with EMA', overlay=false, format=format.price, precision=2, initial_capital=100000)

eqlen = input.int(25, "EQ EMA len", group = "New Equity Curve Settings")
shEQandMA = input.bool(true, "Show Original Equity Curve and MA")
shEQfilt = input.bool(true, "Show Filtered Equity Curve by MA")

Periods = input(title='ATR Period', defval=10, group = "SuperTrend Settings")
src = input(hl2, title='Source', group = "SuperTrend Settings")
Multiplier = input.float(title='ATR Multiplier', step=0.1, defval=3.0, group = "SuperTrend Settings")
changeATR = input(title='Change ATR Calculation Method ?', defval=true, group = "SuperTrend Settings")

//SuperTrend Code
atr2 = ta.sma(ta.tr, Periods)
atr = changeATR ? ta.atr(Periods) : atr2
up = src - Multiplier * atr
up1 = nz(up[1], up)
up := close[1] > up1 ? math.max(up, up1) : up
dn = src + Multiplier * atr
dn1 = nz(dn[1], dn)
dn := close[1] < dn1 ? math.min(dn, dn1) : dn
trend = 1
trend := nz(trend[1], trend)
trend := trend == -1 and close > dn1 ? 1 : trend == 1 and close < up1 ? -1 : trend

// Strategy main code
buySignal = trend == 1 and trend[1] == -1
sellSignal = trend == -1 and trend[1] == 1
if buySignal
    strategy.entry('Long', strategy.long)
if sellSignal
    strategy.entry('Short', strategy.short)


//Equity Curve calcs
eq = strategy.netprofit
ch = ta.change(eq)
neq = ch != 0 ? eq : na
mova = ta.ema(neq,eqlen)

// New Equity Curve
var float neweq = 0
var int ttrades = 0
var int wintrades = 0
var int losetrades = 0

switch
    strategy.netprofit == strategy.netprofit[1]  => na
    strategy.netprofit < mova and strategy.netprofit[1] > mova  => neweq := neweq + ch
    strategy.netprofit < mova and strategy.netprofit[1] < mova => na
    strategy.netprofit > mova and strategy.netprofit[1] > mova => neweq := neweq + ch

newch = ta.change(neweq)
switch
    newch == 0 => na
    newch > 0 =>
        wintrades := wintrades +1
        ttrades := ttrades +1
    newch < 0 =>
        losetrades := losetrades +1
        ttrades := ttrades +1

//plot(eq, linewidth = 2)
//plot(mova, color=color.red)
//plot(neweq, color= color.green, linewidth = 3)


//Table
var testTable = table.new(position = position.top_right, columns = 5, rows = 10, bgcolor = color.green, border_width = 1)
table.cell(table_id = testTable, column = 0, row = 0, text = "Strategy: ", bgcolor=color.white)
table.cell(table_id = testTable, column = 1, row = 0, text = "Original: ", bgcolor=color.white)
table.cell(table_id = testTable, column = 2, row = 0, text = "Equity Curve EMA: ", bgcolor=color.white)

table.cell(table_id = testTable, column = 0, row = 1, text = "Total Trades: ", bgcolor=color.white)
table.cell(table_id = testTable, column = 0, row = 2, text = "Win Trades: ", bgcolor=color.white)
table.cell(table_id = testTable, column = 0, row = 3, text = "Lose Trades: ", bgcolor=color.white)
table.cell(table_id = testTable, column = 0, row = 4, text = "Win Rate: ", bgcolor=color.white)
table.cell(table_id = testTable, column = 0, row = 5, text = "Net Profit: ", bgcolor=color.white)

//Equity Curve EMA stat
table.cell(table_id = testTable, column = 2, row = 1, text = str.tostring(ttrades), bgcolor=color.white)
table.cell(table_id = testTable, column = 2, row = 2, text = str.tostring(wintrades), bgcolor=color.white)
table.cell(table_id = testTable, column = 2, row = 3, text = str.tostring(losetrades), bgcolor=color.white)
table.cell(table_id = testTable, column = 2, row = 4, text = str.tostring(math.round(100*wintrades/ttrades,2)), bgcolor=color.white)
table.cell(table_id = testTable, column = 2, row = 5, text = str.tostring(math.round(neweq)), bgcolor=color.white)

//Original Strategy stat
// table.cell(table_id = testTable, column = 1, row = 1, text = str.tostring(strategy.closedtrades), bgcolor=color.white)
// table.cell(table_id = testTable, column = 1, row = 2, text = str.tostring(strategy.wintrades), bgcolor=color.white)
// table.cell(table_id = testTable, column = 1, row = 3, text = str.tostring(strategy.losstrades), bgcolor=color.white)
// table.cell(table_id = testTable, column = 1, row = 4, text = str.tostring(math.round(100*strategy.wintrades/strategy.closedtrades,2)), bgcolor=color.white)
// table.cell(table_id = testTable, column = 1, row = 5, text = str.tostring(math.round(strategy.netprofit)), bgcolor=color.white)


//New Equity curve
var newcurve = array.new_float(0)
var int ida = 0
var bool printEQ = false
if newch !=0
    array.push(newcurve, neweq)
if bar_index > last_bar_index - array.size(newcurve) - 1 - 20  and array.size(newcurve) > 20
    printEQ := true
else
    printEQ := false

plot(printEQ and ida < strategy.closedtrades and shEQfilt ? array.get(newcurve, ida) : na, color=color.green, linewidth = 2)

if printEQ
    ida := ida + 1
if ida >= array.size(newcurve) and printEQ
    ida := array.size(newcurve) -1


//Original Equity curve
var newcurve2 = array.new_float(0)
var int ida2 = 0
var bool printEQ2 = false
if ch !=0
    array.push(newcurve2, eq)
if bar_index > last_bar_index - array.size(newcurve2) - 1 - 20  and array.size(newcurve2) > 20
    printEQ2 := true
else
    printEQ2 := false

plot(printEQ2 and ida2 < strategy.closedtrades and shEQandMA  ? array.get(newcurve2, ida2) : na, color=color.blue, linewidth = 2)

if printEQ2
    ida2 := ida2 + 1
if ida2 >= array.size(newcurve2) and printEQ2
    ida2 := array.size(newcurve2) -1


//Moving Average Array
var marray = array.new_float(0)
if ch
    array.push(marray, mova)

plot(printEQ2 and  array.size(marray) > 40 and shEQandMA ? array.get(marray, ida2-1) : na, color=color.red, linewidth = 1)

hline(0,"0 line", color=color.black, linestyle = hline.style_dotted)


if (last_bar_index-1) and array.size(newcurve2) > 20 and array.size(newcurve) > 20
    l = label.new(bar_index+2, array.get(newcurve2, array.size(newcurve2)-1), "Original Equity Curve", color=color.rgb(33, 149, 243, 85), textcolor = color.black, style = label.style_label_left)
    label.delete(l[1])
    f = label.new(bar_index+2, array.get(newcurve, array.size(newcurve)-1), "Filtered Equity Curve", color=color.rgb(69, 238, 97, 85), textcolor = color.black, style = label.style_label_left)
label.delete(f[1])Published by ChaoZhang on the FMZ strategy square · last modified 2024-01-15. Collected in the Quant Trading Vault. Unvalidated research: re-test with your own data and costs before trusting it.
Build this with AgenKit
A spec is not a trading system. Paste this into your coding agent and AgenKit runs a specialist team — architecture, test-first build, risk gates, review — with paper trading on by default.
/agenkit build a production-grade trading bot with a backtest engine, risk controls and paper trading by default from strategies/Quantitative-Trading-Strategy-Based-on-Supertrend-Indicator-and-Equity-Curve-Trading.md- npx agenkit install engineering-kit in your project
- Paste the command into your agent and approve each phase
- Get tests, backtest, risk controls and a paper-trading switch
Understand it first
Before you run this, read the lesson behind the idea and how to backtest it honestly. Specs like this one are the survivors of an unknown number of trials; deflate their results accordingly.
Related specs
- Multi Indicator Dynamic Trend Following Strategy Based on EMA and SMAPine Script · Trend following · 1d
- Supertrend Advance StrategyPine Script · Trend following · 5m
- Supertrend and Moving Average Crossover StrategyPine Script · Trend following · 2h
- Trend Following Strategy Based on PMax IndicatorPine Script · Trend following · 5m
- Trend Tracking and Short term Trading Strategy Based on ADX IndicatorPine Script · Trend following · 1d
- Triple Supertrend Ichimoku Cloud Quantitative Trading StrategyPine Script · Trend following · 1d