Strategy vault / Machine learning
Rainbow Oscillator Backtesting Strategy
The Rainbow Oscillator backtesting strategy is a quantitative trading strategy based on the Rainbow Oscillator indicator. This strategy judges the trend direction and strength of the market by calculating the…
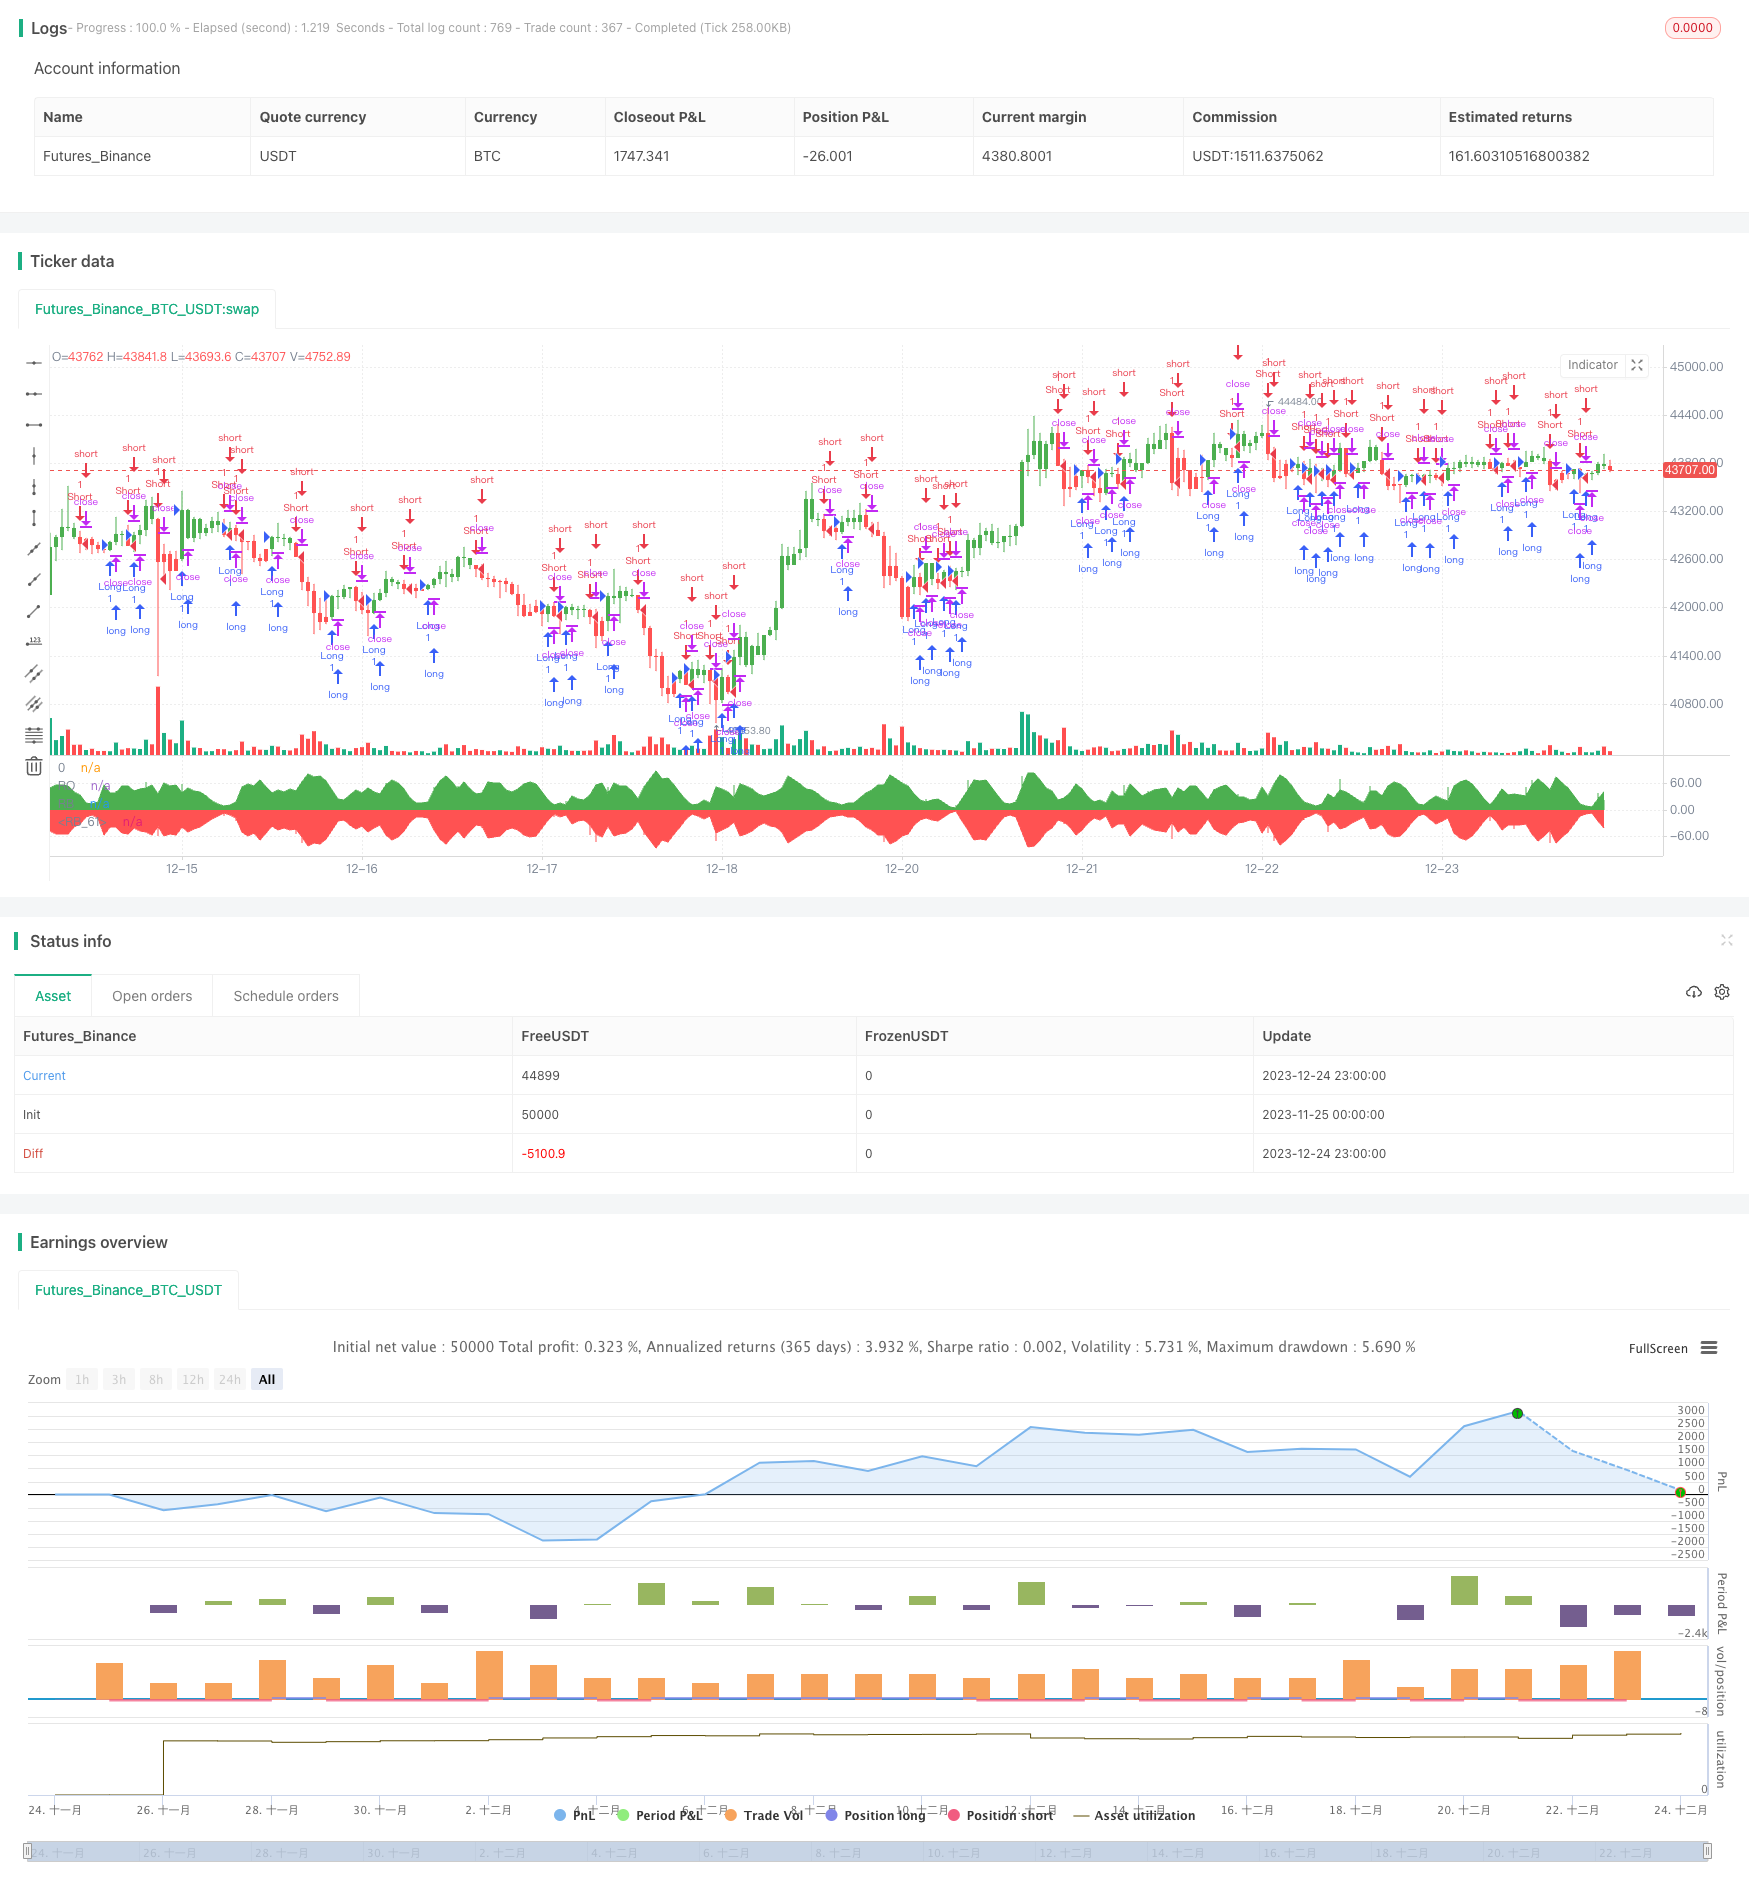
Overview
The Rainbow Oscillator backtesting strategy is a quantitative trading strategy based on the Rainbow Oscillator indicator. This strategy judges the trend direction and strength of the market by calculating the deviation between the price and moving average to determine long and short positions.
Strategy Logic
The core indicator of this strategy is the Rainbow Oscillator (RO), which is calculated as follows:
RO = 100 * ((Close - 10-day Moving Average) / (HHV(High, N) - LLV(Low, N)))
Where the 10-day moving average is the simple moving average of closing prices over the past 10 periods. This indicator reflects the deviation of the price relative to its own moving average. When RO > 0, it means the price is above the moving average, a bullish signal; when RO < 0, it means the price is below the moving average, a bearish signal.
The strategy also calculates an auxiliary indicator - Bandwidth (RB), which is calculated as:
RB = 100 * ((Highest value of moving averages - Lowest value of moving averages) / (HHV(High, N) - LLV(Low, N)))
RB reflects the width between moving averages. The larger the RB, the greater the price fluctuation, and vice versa the price is more stable. The RB indicator can be used to judge the stability of the market.
According to the values of the RO and RB indicators, the strategy judges the degree of price deviation and market stability, and generates trading signals for long and short positions.
Advantages
The advantages of this strategy are:
- Dual indicator judgment avoids the limitations of single indicator judgment.
- Can judge price trends and market stability simultaneously.
- Simple to calculate, easy to understand and implement.
- Visualized indicators form a "rainbow" effect that is intuitive and easy to read.
Risks
There are also some risks with this strategy:
- Improper parameter settings of RO and RB indicators may cause wrong trading signals.
- Dual moving average strategies tend to generate false signals and frequent trading.
- Inappropriate backtesting period and product selection will affect strategy effectiveness.
- Trading costs are not considered, actual results may be poor.
Countermeasures:
- Optimize parameters for RO and RB indicators.
- Add filter conditions to avoid frequent trading.
- Select appropriate backtesting cycle and variety.
- Calculate and consider transaction costs.
Optimization
The strategy can also be optimized in the following ways:
- Add Smooth feature to RO indicator to avoid dramatic fluctuations.
- Add stop loss strategy to control single loss.
- Combine with other indicators for portfolio trading to increase profitability.
- Add machine learning model for prediction and evaluate indicator effectiveness.
- Optimize parameters for different varieties to improve adaptability.
Conclusion
The Rainbow Oscillator backtesting strategy judges market trends and stability by calculating the deviation between prices and moving averages, and uses this information to make long/short trading decisions. This strategy is intuitive, easy to implement, and has some practical value. But there are also some risks that need to be mitigated by optimizing parameters and trading rules to reduce risk and improve real trading performance.
Parameters
| Name | Default | What it controls |
|---|---|---|
| v_input_1 | 2 | Length |
| v_input_2 | 10 | HHV/LLV Lookback |
| v_input_3 | false | Trade reverse |
Source Pine Script
/*backtest
start: 2023-11-25 00:00:00
end: 2023-12-25 00:00:00
period: 1h
basePeriod: 15m
exchanges: [{"eid":"Futures_Binance","currency":"BTC_USDT"}]
*/

//@version=2
////////////////////////////////////////////////////////////
//  Copyright by HPotter v1.0 18/03/2018
// Ever since the people concluded that stock market price movements are not
// random or chaotic, but follow specific trends that can be forecasted, they
// tried to develop different tools or procedures that could help them identify
// those trends. And one of those financial indicators is the Rainbow Oscillator
// Indicator. The Rainbow Oscillator Indicator is relatively new, originally
// introduced in 1997, and it is used to forecast the changes of trend direction.
//
// As market prices go up and down, the oscillator appears as a direction of the
// trend, but also as the safety of the market and the depth of that trend. As
// the rainbow grows in width, the current trend gives signs of continuity, and
// if the value of the oscillator goes beyond 80, the market becomes more and more
// unstable, being prone to a sudden reversal. When prices move towards the rainbow
// and the oscillator becomes more and more flat, the market tends to remain more
// stable and the bandwidth decreases. Still, if the oscillator value goes below 20,
// the market is again, prone to sudden reversals. The safest bandwidth value where
// the market is stable is between 20 and 80, in the Rainbow Oscillator indicator value.
// The depth a certain price has on a chart and into the rainbow can be used to judge
// the strength of the move.
//
// You can change long to short in the Input Settings
// WARNING:
//  - For purpose educate only
//  - This script to change bars colors.
////////////////////////////////////////////////////////////
strategy(title="Rainbow Oscillator Backtest")
Length = input(2, minval=1)
LengthHHLL = input(10, minval=2, title="HHV/LLV Lookback")
reverse = input(false, title="Trade reverse")
xMA1 = sma(close, Length)
xMA2 = sma(xMA1, Length)
xMA3 = sma(xMA2, Length)
xMA4 = sma(xMA3, Length)
xMA5 = sma(xMA4, Length)
xMA6 = sma(xMA5, Length)
xMA7 = sma(xMA6, Length)
xMA8 = sma(xMA7, Length)
xMA9 = sma(xMA8, Length)
xMA10 = sma(xMA9, Length)
xHH = highest(close, LengthHHLL)
xLL = lowest(close, LengthHHLL)
xHHMAs = max(xMA1,max(xMA2,max(xMA3,max(xMA4,max(xMA5,max(xMA6,max(xMA7,max(xMA8,max(xMA9,xMA10)))))))))
xLLMAs = min(xMA1,min(xMA2,min(xMA3,min(xMA4,min(xMA5,min(xMA6,min(xMA7,min(xMA8,min(xMA9,xMA10)))))))))
xRBO = 100 * ((close - ((xMA1+xMA2+xMA3+xMA4+xMA5+xMA6+xMA7+xMA8+xMA9+xMA10) / 10)) / (xHH - xLL))
xRB = 100 * ((xHHMAs - xLLMAs) / (xHH - xLL))
clr = iff(xRBO >= 0, green, red)
pos = iff(xRBO > 0, 1,
       iff(xRBO < 0, -1, nz(pos[1], 0)))
possig = iff(reverse and pos == 1, -1,
          iff(reverse and pos == -1, 1, pos))
if (possig == 1)
    strategy.entry("Long", strategy.long)
if (possig == -1)
    strategy.entry("Short", strategy.short)
barcolor(possig == -1 ? red: possig == 1 ? green : blue )
plot(xRBO, color=clr, title="RO", style= histogram, linewidth=2)
p0 = plot(0, color = gray, title="0")
p1 = plot(xRB, color=green, title="RB")
p2 = plot(-xRB, color=red, title="RB")
fill(p1, p0, color=green)
fill(p2, p0, color=red)Published by ChaoZhang on the FMZ strategy square · last modified 2023-12-26. Collected in the Quant Trading Vault. Unvalidated research: re-test with your own data and costs before trusting it.
Build this with AgenKit
A spec is not a trading system. Paste this into your coding agent and AgenKit runs a specialist team — architecture, test-first build, risk gates, review — with paper trading on by default.
/agenkit build a production-grade trading bot with a backtest engine, risk controls and paper trading by default from strategies/Rainbow-Oscillator-Backtesting-Strategy.md- npx agenkit install engineering-kit in your project
- Paste the command into your agent and approve each phase
- Get tests, backtest, risk controls and a paper-trading switch
Understand it first
Before you run this, read the lesson behind the idea and how to backtest it honestly. Specs like this one are the survivors of an unknown number of trials; deflate their results accordingly.
Related specs
- AI Driven Dynamic Volatility Adaptive Trend Breakout Trading StrategyPine Script · Machine learning · 2d
- AI Powered Volatility Price System Divergence Trading StrategyPine Script · Machine learning · 1h
- Configurable BBRSIAroon Strategy BacktestPine Script · Machine learning · 5m
- Dual Moving Average Matching Strategy Based on Bollinger BandsPine Script · Machine learning · 1h
- Dynamic Weighted Moving Average Trading StrategyPine Script · Machine learning · 1d
- EMA and RSI Quantitative Trading StrategyPine Script · Machine learning · 1h