Strategy vault / Machine learning
Rainbow Oscillator Trading Strategy
The Rainbow Oscillator trading strategy mainly uses multiple smoothed moving averages and oscillation indicators to build a multi-layer oscillation channel and generate clear long/short signals. It belongs to the…
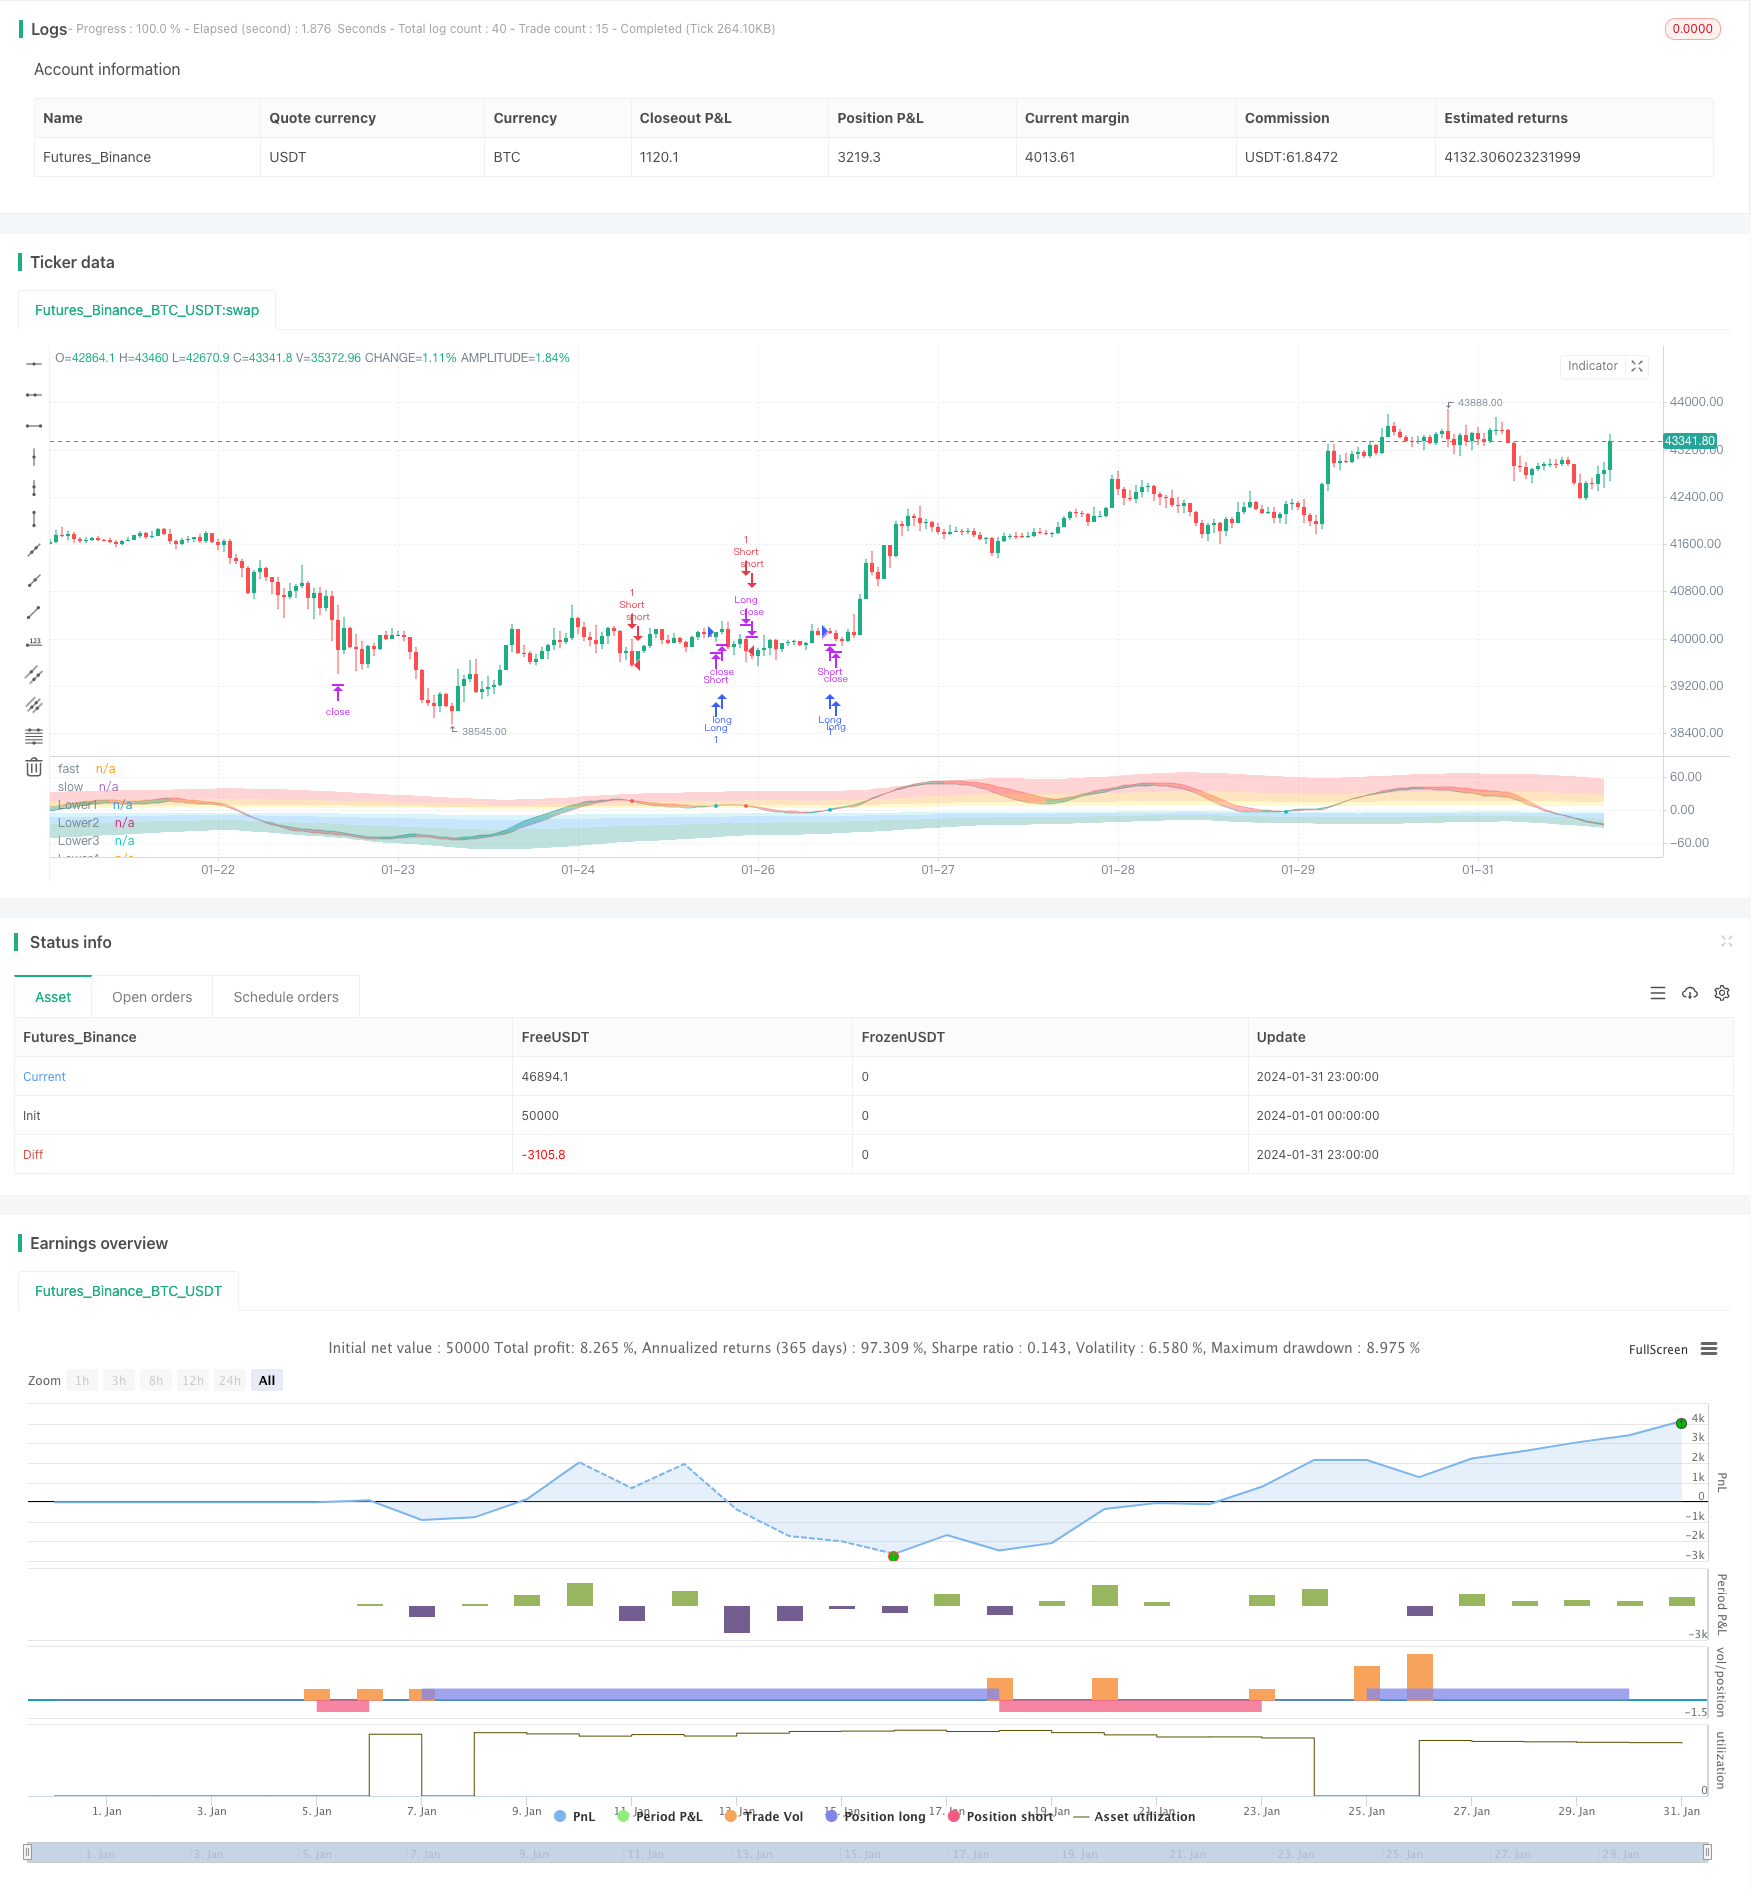
Overview
The Rainbow Oscillator trading strategy mainly uses multiple smoothed moving averages and oscillation indicators to build a multi-layer oscillation channel and generate clear long/short signals. It belongs to the trend-following strategy category. This strategy combines RSI, CCI, Stochastic and MA composite indicators to determine the overall market trend and overbought/oversold areas. It is a multi-factor rating strategy.
Principles
- Calculate the weighted average of RSI, CCI and Stochastic to build a combined oscillation indicator called Magic;
- Apply exponential smoothing to Magic multiple times to generate two lines called sampledMagicFast and sampledMagicSlow;
- sampledMagicFast represents the fast EMA line, sampledMagicSlow represents the slow EMA line;
- A buy signal is generated when sampledMagicFast crosses above sampledMagicSlow;
- A sell signal is generated when sampledMagicFast crosses below sampledMagicSlow;
- Calculate the direction of the last bar's sampledMagicFast relative to previous bar to determine the current trend;
- Determine entry and exit points based on trend direction and crossing situation between sampledMagicFast and sampledMagicSlow.
Advantages
- Combining multiple indicators to determine overall market trend improves signal accuracy;
- Smoothed MA filters out noise effectively;
- Multi-layer oscillation signals provide clear operation guidance;
- Can be configured for trend-following or mean-reversion by enabling/disabling trend filter;
- Customizable overbought/oversold strength for flexibility.
Risks
- Over-smoothed curves may cause missing best entry points;
- Improper overbought/oversold area setting may keep position closed for too long;
- Failure of some factors in the rating model may weaken signals.
Solutions:
- Optimize parameters for appropriate smoothing extent;
- Adjust overbought/oversold area strength to reduce time in flat position;
- Test and weight each indicator by its predictive power.
Optimization Directions
- Dynamically adjust indicator parameters based on market conditions;
- Introduce machine learning methods to auto optimize indicator combinations;
- Add factors like volume and volatility filters to entry signals.
Conclusion
The Rainbow Oscillator strategy combines signals from multiple indicators and uses exponential smoothing to improve stability. It can be configured for both trending and sideways markets, or for specific products. Further improvements can be made by parameter tuning and indicator expansion. Overall this is a clear, easy-to-use strategy.
Parameters
| Name | Default | What it controls |
|---|---|---|
| v_input_bool_1 | true | Use trend filter |
| v_input_float_1 | 0.33 | RSI Weight |
| v_input_float_2 | 0.33 | CCI Weight |
| v_input_float_3 | 0.33 | Stoch Weight |
| v_input_int_1 | 16 | Ocillograph Fast Period |
| v_input_int_2 | 22 | Ocillograph Slow Period |
| v_input_int_3 | 8 | Oscillograph Samples Period |
| v_input_int_4 | 2 | Oscillograph Samples Count |
| v_input_string_1 | 0 | Oscillograph Samples Type: RMA | SMA | EMA | WMA |
| v_input_int_5 | 26 | Level Period |
| v_input_int_6 | false | Level Offset |
| v_input_float_4 | 0.5 | Level Redunant |
| v_input_int_7 | 2 | Level Smooth Samples |
| v_input_string_2 | 0 | Level MA type: RMA | SMA | EMA | WMA |
| v_input_float_5 | 5 | % Take profit |
| v_input_float_6 | 2 | % Stop Loss |
Source Pine Script
// This source code is subject to the terms of the Mozilla Public License 2.0 at https://mozilla.org/MPL/2.0/
// © businessduck

//@version=5
strategy("Rainbow Oscillator [Strategy]", overlay=false, margin_long=100, margin_short=100, initial_capital = 2000)

bool trendFilter = input.bool(true, 'Use trend filter')
float w1 = input.float(0.33, 'RSI Weight', 0, 1, 0.01)
float w2 = input.float(0.33, 'CCI Weight', 0, 1, 0.01)
float w3 = input.float(0.33, 'Stoch Weight', 0, 1, 0.01)
int fastPeriod = input.int(16, 'Ocillograph Fast Period', 4, 60, 1)
int slowPeriod = input.int(22, 'Ocillograph Slow Period', 4, 60, 1)
int oscillographSamplePeriod = input.int(8, 'Oscillograph Samples Period', 1, 30, 1)
int oscillographSamplesCount = input.int(2, 'Oscillograph Samples Count', 0, 4, 1)
string oscillographMAType = input.string("RMA", "Oscillograph Samples Type", options = ["EMA", "SMA", "RMA", "WMA"])
int levelPeriod = input.int(26, 'Level Period', 2, 100)
int levelOffset = input.int(0, 'Level Offset', 0, 200, 10)
float redunant = input.float(0.5, 'Level Redunant', 0, 1, 0.01)
int levelSampleCount = input.int(2, 'Level Smooth Samples', 0, 4, 1)
string levelType = input.string("RMA", "Level MA type", options = ["EMA", "SMA", "RMA", "WMA"])

perc(current, prev) => ((current - prev) / prev) * 100

smooth(value, type, period) =>
    float ma = switch type
        "EMA" => ta.ema(value, period)
        "SMA" => ta.sma(value, period)
        "RMA" => ta.rma(value, period)
        "WMA" => ta.wma(value, period)
        =>
            runtime.error("No matching MA type found.")
            float(na)

getSample(value, samples, type, period) =>
    float ma = switch samples
        0 => value
        1 => smooth(value, type, period)
        2 => smooth(smooth(value, type, period), type, period)
        3 => smooth(smooth(smooth(value, type, period), type, period), type, period)
        4 => smooth(smooth(smooth(smooth(value, type, period), type, period), type, period), type, period)

float takeProfit = input.float(5, "% Take profit", 0.8, 100, step = 0.1)  / 100
float stopLoss = input.float(2, "% Stop Loss", 0.8, 100, step = 0.1) / 100
float magicFast = w2 * ta.cci(close, fastPeriod) + w1 * (ta.rsi(close, fastPeriod) - 50) + w3 * (ta.stoch(close, high, low, fastPeriod) - 50)
float magicSlow = w2 * ta.cci(close, slowPeriod) + w1 * (ta.rsi(close, slowPeriod) - 50) + w3 * (ta.stoch(close, high, low, slowPeriod) - 50)
float sampledMagicFast = getSample(magicFast, oscillographSamplesCount, oscillographMAType, oscillographSamplePeriod)
float sampledMagicSlow = getSample(magicSlow, oscillographSamplesCount, oscillographMAType, oscillographSamplePeriod)
float lastUpperValue = 0
float lastLowerValue = 0

if (magicFast > 0)
    lastUpperValue := math.max(magicFast, magicFast[1])
else
    lastUpperValue := math.max(0, lastUpperValue[1]) * redunant


if (magicFast <= 0)
    lastLowerValue := math.min(magicFast, magicFast[1])
else
    lastLowerValue := math.min(0, lastLowerValue[1]) * redunant

float level1up = getSample( (magicFast >= 0 ? magicFast : lastUpperValue) / 4, levelSampleCount, levelType, levelPeriod) + levelOffset
float level2up = getSample( (magicFast >= 0 ? magicFast : lastUpperValue) / 2, levelSampleCount, levelType, levelPeriod) + levelOffset
float level3up = getSample( magicFast >= 0 ? magicFast : lastUpperValue, levelSampleCount, levelType, levelPeriod) + levelOffset
float level4up = getSample( (magicFast >= 0 ? magicFast : lastUpperValue) * 2, levelSampleCount, levelType, levelPeriod) + levelOffset

float level1low = getSample( (magicFast <= 0 ? magicFast : lastLowerValue) / 4, levelSampleCount, levelType, levelPeriod) - levelOffset
float level2low = getSample( (magicFast <= 0 ? magicFast : lastLowerValue) / 2, levelSampleCount, levelType, levelPeriod) - levelOffset
float level3low = getSample( magicFast <= 0 ? magicFast : lastLowerValue, levelSampleCount, levelType, levelPeriod) - levelOffset
float level4low = getSample( (magicFast <= 0 ? magicFast : lastLowerValue) * 2, levelSampleCount, levelType, levelPeriod) - levelOffset

var transparent = color.new(color.white, 100)
var overbough4Color = color.new(color.red, 75)
var overbough3Color = color.new(color.orange, 75)
var overbough2Color = color.new(color.yellow, 75)

var oversold4Color = color.new(color.teal, 75)
var oversold3Color = color.new(color.blue, 75)
var oversold2Color = color.new(color.aqua, 85)

upperPlotId1 = plot(level1up, 'Upper1', transparent)
upperPlotId2 = plot(level2up, 'Upper2', transparent)
upperPlotId3 = plot(level3up, 'Upper3', transparent)
upperPlotId4 = plot(level4up, 'Upper4', transparent)

fastColor = color.new(color.teal, 60)
slowColor = color.new(color.red, 60)
fastPlotId = plot(sampledMagicFast, 'fast', color = fastColor)
slowPlotId = plot(sampledMagicSlow, 'slow', color = slowColor)

lowerPlotId1 = plot(level1low, 'Lower1', transparent)
lowerPlotId2 = plot(level2low, 'Lower2', transparent)
lowerPlotId3 = plot(level3low, 'Lower3', transparent)
lowerPlotId4 = plot(level4low, 'Lower4', transparent)

fill(upperPlotId4, upperPlotId3, overbough4Color)
fill(upperPlotId3, upperPlotId2, overbough3Color)
fill(upperPlotId2, upperPlotId1, overbough2Color)

fill(lowerPlotId4, lowerPlotId3, oversold4Color)
fill(lowerPlotId3, lowerPlotId2, oversold3Color)
fill(lowerPlotId2, lowerPlotId1, oversold2Color)

upTrend = sampledMagicFast > sampledMagicFast[1]
buySignal = ((upTrend or not trendFilter) and ta.crossunder(sampledMagicSlow, sampledMagicFast)) ? sampledMagicSlow : na
sellSignal = ((not upTrend or not trendFilter) and ta.crossover(sampledMagicSlow, sampledMagicFast)) ? sampledMagicSlow : na
diff = sampledMagicSlow - sampledMagicFast

fill(fastPlotId, slowPlotId, upTrend ? fastColor : slowColor)
plot(buySignal, color = color.aqua, style = plot.style_circles, linewidth = 4)
plot(sellSignal, color = color.red, style = plot.style_circles, linewidth = 4)


// longCondition = upTrend != upTrend[1] and upTrend
long_take_level = strategy.position_avg_price * (1 + takeProfit)
long_stop_level = strategy.position_avg_price * (1 - stopLoss)

short_take_level = strategy.position_avg_price * (1 - takeProfit)
short_stop_level = strategy.position_avg_price * (1 + stopLoss)

strategy.close(id="Long", when=sellSignal, comment = "Exit")
strategy.close(id="Short", when=buySignal, comment = "Exit")

strategy.entry("Long", strategy.long, when=buySignal)
strategy.entry("Short", strategy.short, when=sellSignal)

strategy.exit("Take Profit/ Stop Loss","Long", stop=long_stop_level, limit=long_take_level)
strategy.exit("Take Profit/ Stop Loss","Short", stop=short_stop_level, limit=short_take_level)


// plot(long_stop_level, color=color.red, overlay=true)
// plot(long_take_level, color=color.green)
Published by ChaoZhang on the FMZ strategy square · last modified 2024-02-23. Collected in the Quant Trading Vault. Unvalidated research: re-test with your own data and costs before trusting it.
Build this with AgenKit
A spec is not a trading system. Paste this into your coding agent and AgenKit runs a specialist team — architecture, test-first build, risk gates, review — with paper trading on by default.
/agenkit build a production-grade trading bot with a backtest engine, risk controls and paper trading by default from strategies/Rainbow-Oscillator-Trading-Strategy.md- npx agenkit install engineering-kit in your project
- Paste the command into your agent and approve each phase
- Get tests, backtest, risk controls and a paper-trading switch
Understand it first
Before you run this, read the lesson behind the idea and how to backtest it honestly. Specs like this one are the survivors of an unknown number of trials; deflate their results accordingly.
Related specs
- Triple Moving Average Combined with MACD Quantitative StrategyPine Script · Machine learning · 1d
- Multi indicator Combination StrategyPine Script · Machine learning · 1d
- kNN based Trend Following StrategyPine Script · Machine learning · 1h
- Dual Indicator Stochastic RSI and EMA Trading StrategyPine Script · Machine learning · 1d
- Johns Bitcoin Intraday Trading Strategy Based on Multiple IndicatorsPine Script · Machine learning · 1m
- ADX EFI 50 Moving Average Channel Pullback StrategyPine Script · Machine learning · 1h