Strategy vault / Mean reversion
Random Fisher Transform Temporary Stop Reverse STOCH Indicator Quantitative Strategy
The core idea of this strategy is to combine the Random Fisher Transform and the Temporary Stop Reverse STOCH indicator to make buy and sell decisions. This strategy is suitable for medium-term operations and can…
Overview
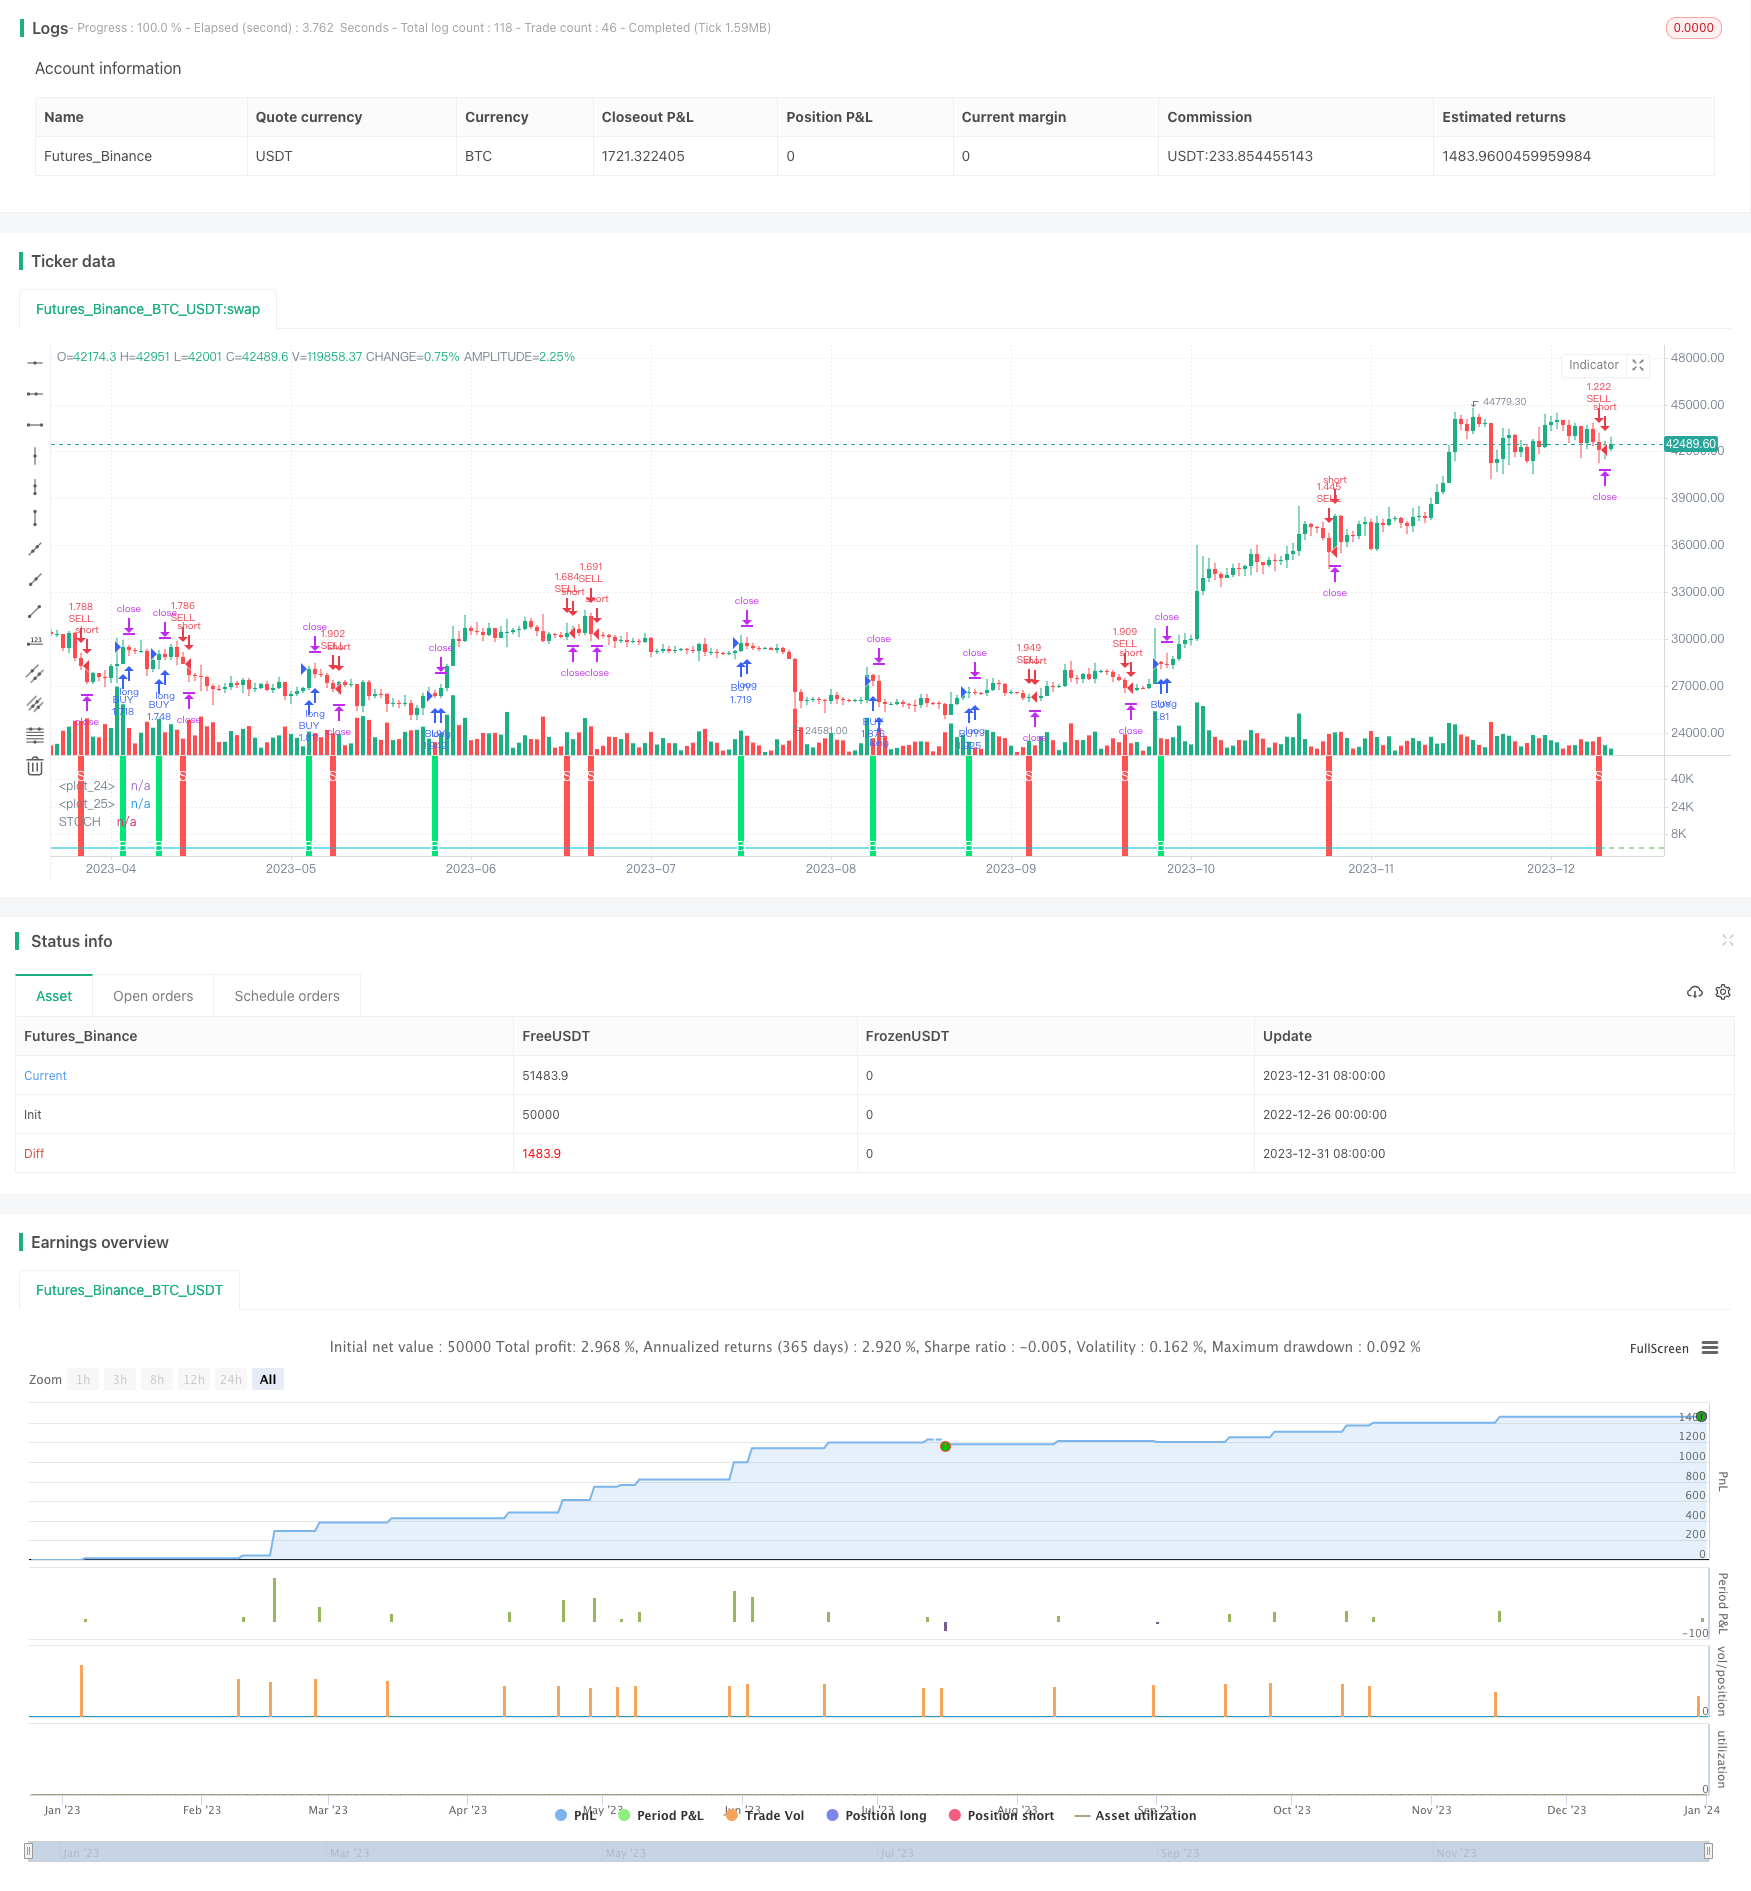
The core idea of this strategy is to combine the Random Fisher Transform and the Temporary Stop Reverse STOCH indicator to make buy and sell decisions. This strategy is suitable for medium-term operations and can generate decent returns in stable market conditions.
Strategy Principle
This strategy first calculates the standard STOCH indicator, then performs a Fisher transform on it to obtain INVLine. When INVLine crosses above the lower threshold dl, a buy signal is generated. When INVLine crosses below the upper threshold ul, a sell signal is generated. At the same time, this strategy also sets a trailing stop mechanism to lock in profits and reduce losses.
Specifically, the core logic of this strategy is:
- Calculate the STOCH indicator: Use the standard formula to calculate the fast STOCH value of stock
- Fisher transform: Perform a Fisher transform on the STOCH value to obtain INVLine
- Generate trading signals: Buy when INVLine crosses above dl, sell when crossing below ul
- Trailing stop: Enable a temporary stop tracking mechanism for timely stop loss
Advantage Analysis
The main advantages of this strategy are:
- The Fisher transform effectively improves the sensitivity of the STOCH indicator and can detect trend reversal opportunities earlier
- The temporary trailing stop mechanism can effectively control risks and lock in profits
- It is suitable for medium-term operations, especially the currently popular high-frequency quantitative trading
- It performs well in stable market conditions with steady returns
Risk Analysis
This strategy also has some risks:
- The STOCH indicator is prone to generating false signals, which may cause unnecessary trading
- The Fisher transform also amplifies the noise of the STOCH indicator, resulting in more false signals
- It is easy to stop loss in oscillating markets and fail to make sustainable profits
- Relatively short holding periods are required to obtain Alpha. Long holdings are not suitable
To mitigate these risks, consider optimizing the following aspects:
- Adjust STOCH parameters to smooth the curve and reduce noise
- Optimize threshold line positions to reduce false trading probabilities
- Add filter conditions to avoid trading in oscillating markets
- Adjust holding time length to match operating cycle
Optimization Directions
The main directions for optimizing this strategy include:
- Optimize parameters of Fisher transform to smooth INVLine curve
- Optimize STOCH period length to find optimal parameter combinations
- Optimize threshold line parameters to reduce false trading probabilities
- Add volume price confirmation to avoid unnecessary trailing stop
- Add intraday breakout filters to reduce false signals in oscillating markets
- Incorporate trend indicators to avoid counter trend trading
Conclusion
This strategy combines the Random Fisher Transform and the STOCH indicator to implement a simple and practical short-term quantitative strategy. Its advantage lies in the high operation frequency, which is suitable for the currently popular high-frequency quantitative trading. At the same time, this strategy also has some common technical indicator strategy risks. Parameters and filter conditions need to be optimized to reduce risks and improve stability. In general, this strategy provides a good idea for simple quantitative trading and is worth further in-depth research.
Parameters
| Name | Default | What it controls |
|---|---|---|
| v_input_1 | 19 | STOCH Length |
| v_input_2 | 4 | Smooth |
| v_input_3 | 0.64 | UP line |
| v_input_4 | -0.62 | DOWN line |
| v_input_5 | true | Use trailing stop |
| v_input_6 | 245 | trailing stop actiation pips |
| v_input_7 | 20 | trailing stop offset pips |
Source Pine Script
/*backtest
start: 2022-12-26 00:00:00
end: 2024-01-01 00:00:00
period: 1d
basePeriod: 1h
exchanges: [{"eid":"Futures_Binance","currency":"BTC_USDT"}]
*/

//@version=3
strategy("IFT Stochastic + Trailing Stop", overlay=false, pyramiding = 0, calc_on_order_fills = false, commission_type =  strategy.commission.percent, commission_value = 0.0454, default_qty_type = strategy.percent_of_equity, default_qty_value = 100)

//INPUTS
stochlength=input(19, "STOCH Length")
wmalength=input(4, title="Smooth")
ul = input(0.64,step=0.01, title="UP line")
dl = input(-0.62,step=0.01, title="DOWN line")
uts = input(true, title="Use trailing stop")
tsi = input(title="trailing stop actiation pips",defval=245)
tso = input(title="trailing stop offset pips",defval=20)

//CALCULATIONS
v1=0.1*(stoch(close, high, low, stochlength)-50)
v2=wma(v1, wmalength)
INVLine=(exp(2*v2)-1)/(exp(2*v2)+1)

//CONDITIONS
sell = crossunder(INVLine,ul)? 1 : 0
buy = crossover(INVLine,dl)? 1 : 0

//PLOTS
plot(INVLine, color=aqua, linewidth=1, title="STOCH")
hline(ul, color=red)
hline(dl, color=green)
bgcolor(sell==1? red : na, transp=30, title = "sell signal")
bgcolor(buy==1? lime : na, transp=30, title = "buy signal")
plotchar(buy==1, title="Buy Signal", char='B', location=location.bottom, color=white, transp=0, offset=0)
plotchar(sell==1, title="Sell Signal", char='S', location=location.top, color=white, transp=0, offset=0)

//STRATEGY
strategy.entry("BUY", strategy.long, when = buy==1)
strategy.entry("SELL", strategy.short, when = sell==1)

if  (uts)
    strategy.entry("BUY", strategy.long, when = buy)
    strategy.entry("SELL", strategy.short, when = sell)
    strategy.exit("Close BUY with TS","BUY", trail_points = tsi, trail_offset = tso)
    strategy.exit("Close SELL with TS","SELL", trail_points = tsi, trail_offset = tso)
Published by ChaoZhang on the FMZ strategy square · last modified 2024-01-02. Collected in the Quant Trading Vault. Unvalidated research: re-test with your own data and costs before trusting it.
Build this with AgenKit
A spec is not a trading system. Paste this into your coding agent and AgenKit runs a specialist team — architecture, test-first build, risk gates, review — with paper trading on by default.
/agenkit build a production-grade trading bot with a backtest engine, risk controls and paper trading by default from strategies/Random-Fisher-Transform-Temporary-Stop-Reverse-STOCH-Indicator-Quantitative-Strategy.md- npx agenkit install engineering-kit in your project
- Paste the command into your agent and approve each phase
- Get tests, backtest, risk controls and a paper-trading switch
Understand it first
Before you run this, read the lesson behind the idea and how to backtest it honestly. Specs like this one are the survivors of an unknown number of trials; deflate their results accordingly.
Related specs
- Adaptive Trading Strategy Combining Dynamic Trend Reversal and Stochastic IndicatorPine Script · Mean reversion · 1d
- Advanced 15 Minute Chart Trading Signal StrategyPine Script · Mean reversion · 3h
- Automated Market Reversal Trading Strategy Based on Stochastic Indicator and Candlestick PatternsPine Script · Mean reversion · 2m
- Bollinger Bands Stochastic RSI Extreme Strategy BBSR Extreme StrategyPine Script · Mean reversion · 1h
- BuySell Strategy depends on AOStochRSIATRPine Script · Mean reversion · 30m
- Byron Serpent Cloud Quant StrategyPine Script · Mean reversion · 1h