Reverse Mean Breakthrough Strategy
The Reverse Mean Breakthrough Strategy is a multi-factor trend reversal strategy. It combines moving average, Bollinger Bands, CCI, RSI and other technical indicators to capture price reversal opportunities from…
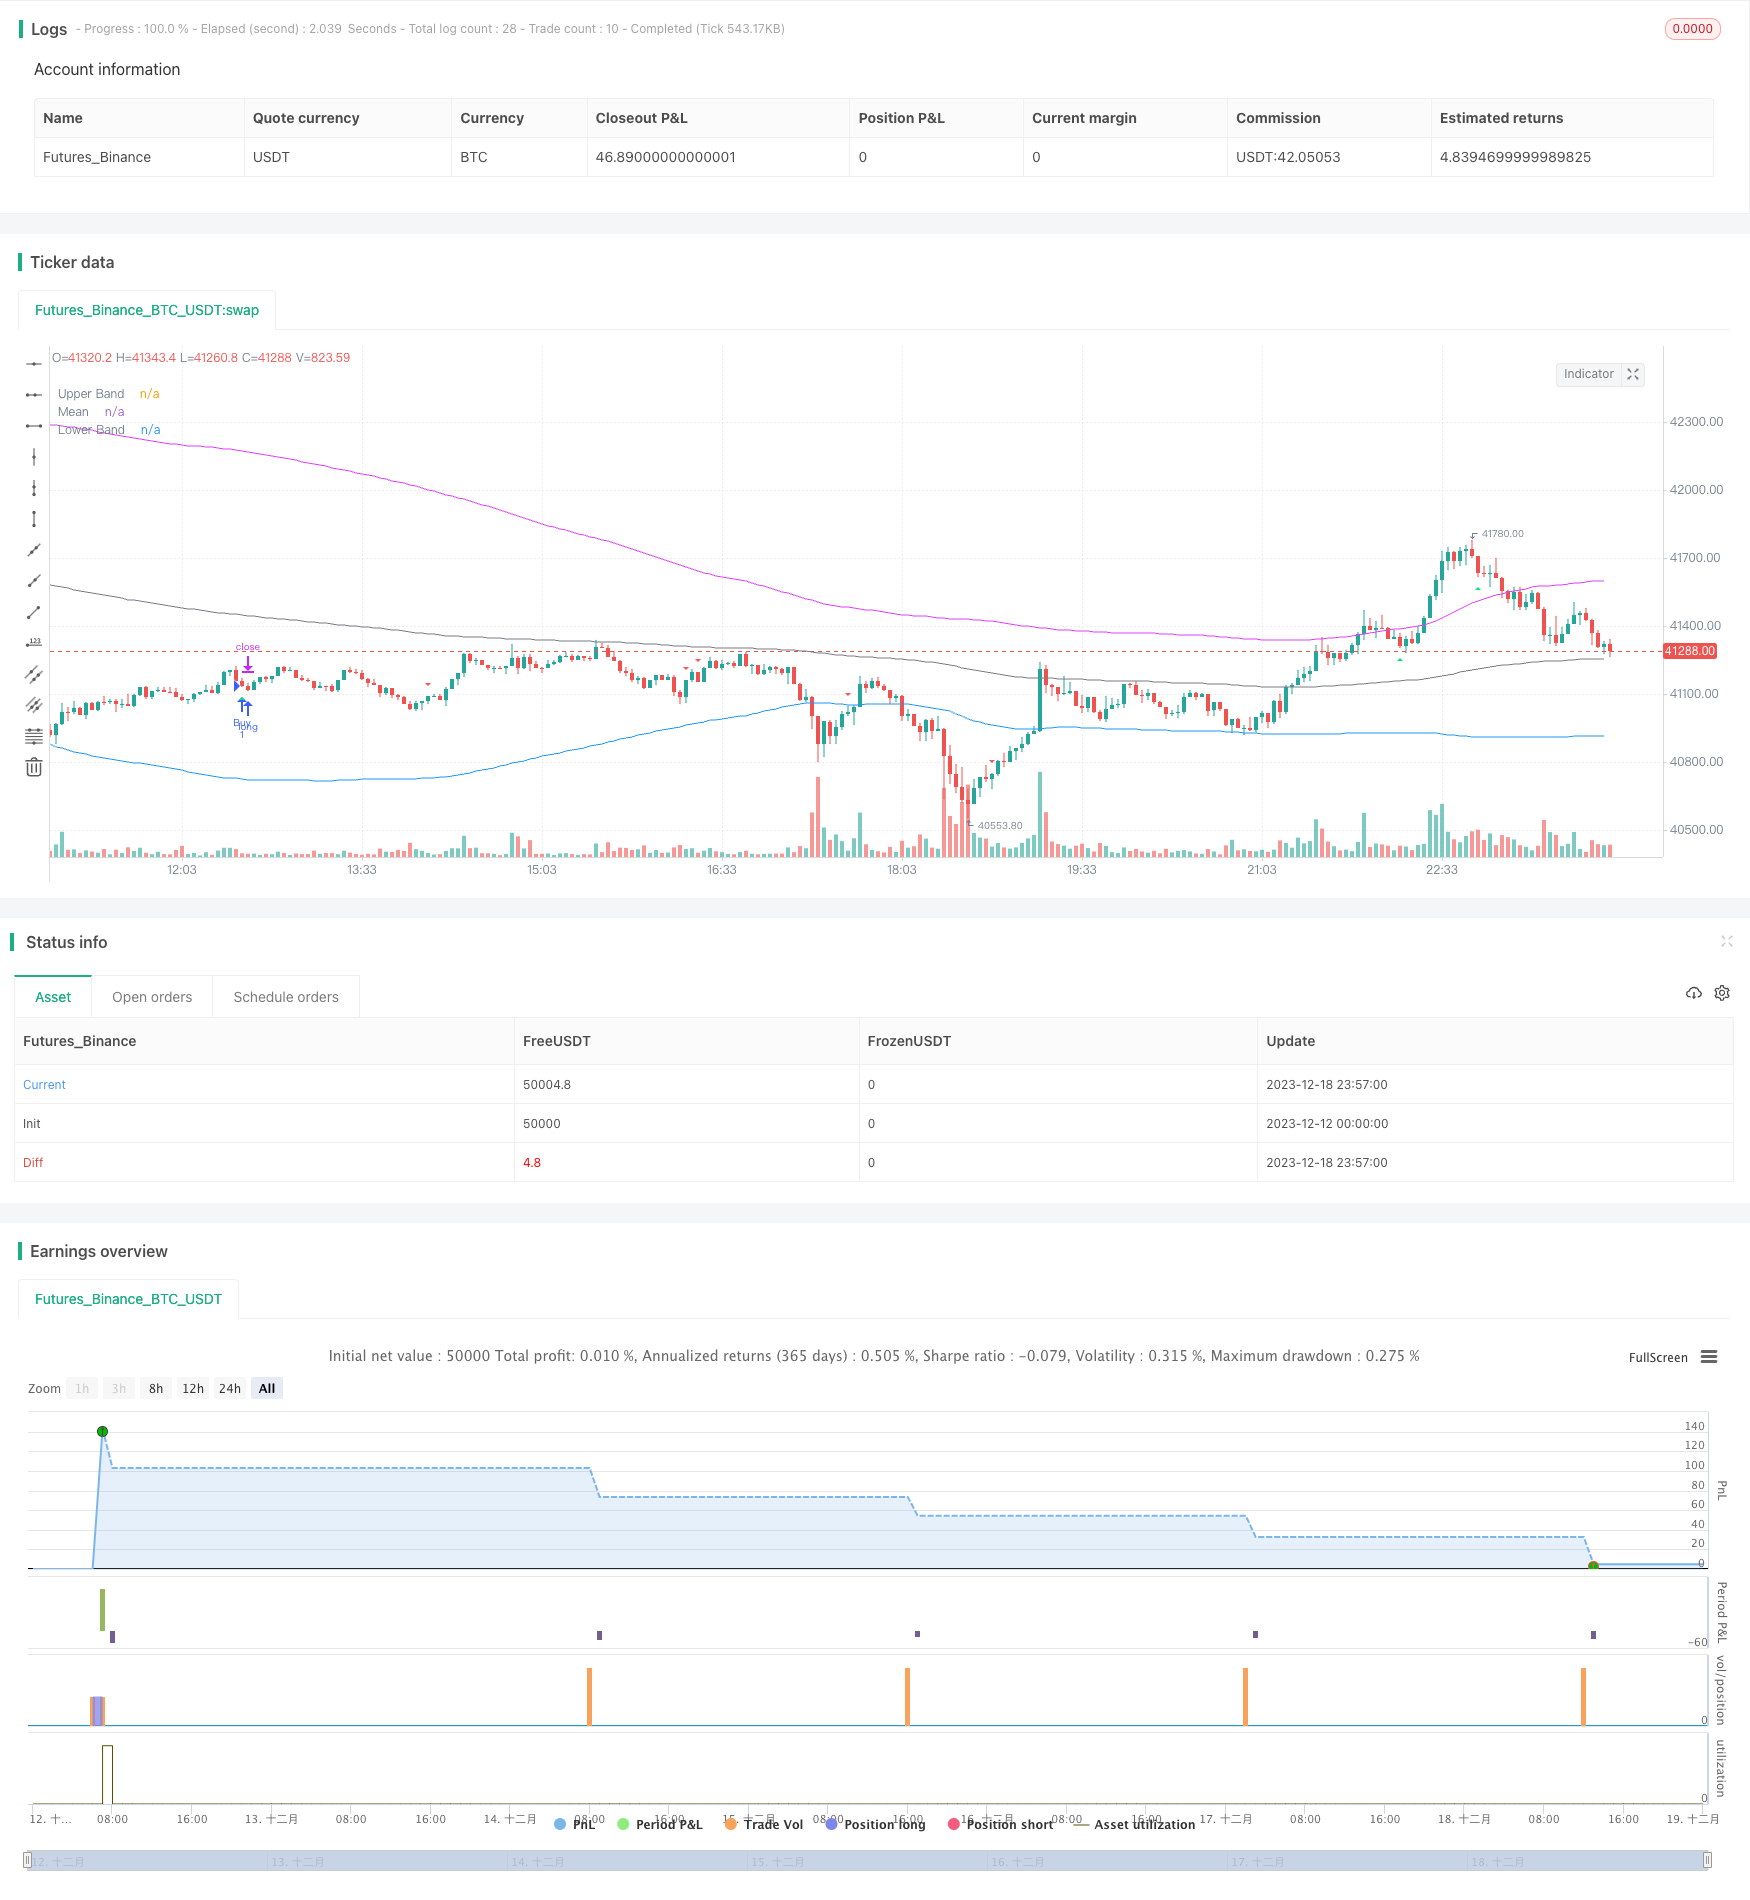
Overview
The Reverse Mean Breakthrough Strategy is a multi-factor trend reversal strategy. It combines moving average, Bollinger Bands, CCI, RSI and other technical indicators to capture price reversal opportunities from overbought and oversold areas. The strategy also incorporates regular divergence analysis to detect inconsistencies between current and previous trends, thus avoiding false breakouts.
Strategy Principle
The core logic of this strategy is to take appropriate short or long positions when prices reverse from overbought or oversold zones. Specifically, the strategy judges reversal opportunities from four aspects:
CCI indicator or momentum indicator issues golden cross dead cross signals to determine overbought or oversold status.
RSI indicator judges whether it is in overbought or oversold zone. Overbought above 65 and oversold below 35.
Use Bollinger Bands upper and lower rail to determine if price deviates from normal range. Prices may reverse when return to normal range.
Detect regular divergence of RSI indicator to avoid chasing false breakouts.
When the above conditions are met, the strategy will take reverse direction entry. And set stop loss to control risk.
Advantage Analysis
The biggest advantage of this strategy is that it combines multiple indicators to determine reversal opportunities with relatively high winning rate. Specifically:
Reliability is higher by using multiple factors. Avoid relying solely on single indicator thus reduce misjudgment.
Trend reversal has larger winning probability. It's a relatively reliable trading method.
Detecting divergence avoids chasing false breakout and reduces systemic risk.
Stop loss mechanism controls risk. Can minimize single ticket loss as much as possible.
Risk Analysis
There are also some risks with this strategy:
Judgment inaccuracies on reversal timing point. Stop loss can be triggered. Expand stop loss range appropriately.
Bollinger Bands parameters set inappropriately, takes normal price action as abnormal. Parameters should cater to market volatility.
Number of trades could be relatively high. Expand CCI etc. judgment range properly to reduce trading frequency.
Long short imbalance. Judge if parameters suit historical data.
Optimization
The strategy can be optimized in the following aspects:
Use machine learning algorithms to automatically optimize parameters. Avoid artificial empirical errors.
Increase shale index, amplitude index etc. to determine overbought & oversold strength.
Add trading volume indicators to determine reversal reliability, e.g. volume, open interest etc.
Incorporate blockchain data to gauge market sentiment. Improve strategy adaptivity.
Introduce adaptive stop loss mechanism based on market volatility.
Summary
The reverse mean breakthrough strategy integrates multiple indicators to determine reversal trades. With proper risk control, it has relatively large winning rate. The strategy is practical with room for further optimization. With proper parameter tuning, it should yield fairly ideal results.
Parameters
| Name | Default | What it controls |
|---|---|---|
| v_input_int_1 | 10 | Stop Loss (in Pips) |
| v_input_string_1 | 0 | Entry Signal Source: CCI | Momentum |
| v_input_int_2 | 10 | CCI/Momentum Length |
| v_input_bool_1 | false | Find Regular Bullish/Bearish Divergence |
| v_input_int_3 | 65 | RSI Overbought Level |
| v_input_int_4 | 35 | RSI Oversold Level |
| v_input_int_5 | 14 | RSI Length |
| v_input_bool_2 | true | Plot Mean Reversion Bands on the chart |
| v_input_1 | 200 | Lookback Period (EMA) |
| v_input_float_1 | 1.6 | Outer Bands Multiplier |
Source Pine Script
/*backtest
start: 2023-12-12 00:00:00
end: 2023-12-19 00:00:00
period: 3m
basePeriod: 1m
exchanges: [{"eid":"Futures_Binance","currency":"BTC_USDT"}]
*/

//@version=5
strategy(title='BroTheJo Strategy', shorttitle='BTJ INV', overlay=true)

// Input settings
stopLossInPips = input.int(10, minval=0, title='Stop Loss (in Pips)')
ccimomCross = input.string('CCI', 'Entry Signal Source', options=['CCI', 'Momentum'])
ccimomLength = input.int(10, minval=1, title='CCI/Momentum Length')
useDivergence = input.bool(false, title='Find Regular Bullish/Bearish Divergence')
rsiOverbought = input.int(65, minval=1, title='RSI Overbought Level')
rsiOversold = input.int(35, minval=1, title='RSI Oversold Level')
rsiLength = input.int(14, minval=1, title='RSI Length')
plotMeanReversion = input.bool(true, 'Plot Mean Reversion Bands on the chart')
emaPeriod = input(200, title='Lookback Period (EMA)')
bandMultiplier = input.float(1.6, title='Outer Bands Multiplier')

// CCI and Momentum calculation
momLength = ccimomCross == 'Momentum' ? ccimomLength : 10
mom = close - close[momLength]
cci = ta.cci(close, ccimomLength)
ccimomCrossUp = ccimomCross == 'Momentum' ? ta.cross(mom, 0) : ta.cross(cci, 0)
ccimomCrossDown = ccimomCross == 'Momentum' ? ta.cross(0, mom) : ta.cross(0, cci)

// RSI calculation
src = close
up = ta.rma(math.max(ta.change(src), 0), rsiLength)
down = ta.rma(-math.min(ta.change(src), 0), rsiLength)
rsi = down == 0 ? 100 : up == 0 ? 0 : 100 - 100 / (1 + up / down)
oversoldAgo = rsi[0] <= rsiOversold or rsi[1] <= rsiOversold or rsi[2] <= rsiOversold or rsi[3] <= rsiOversold
overboughtAgo = rsi[0] >= rsiOverbought or rsi[1] >= rsiOverbought or rsi[2] >= rsiOverbought or rsi[3] >= rsiOverbought

// Regular Divergence Conditions
bullishDivergenceCondition = rsi[0] > rsi[1] and rsi[1] < rsi[2]
bearishDivergenceCondition = rsi[0] < rsi[1] and rsi[1] > rsi[2]

// Mean Reversion Indicator
meanReversion = plotMeanReversion ? ta.ema(close, emaPeriod) : na
stdDev = plotMeanReversion ? ta.stdev(close, emaPeriod) : na
upperBand = plotMeanReversion ? meanReversion + stdDev * bandMultiplier : na
lowerBand = plotMeanReversion ? meanReversion - stdDev * bandMultiplier : na

// Entry Conditions
prevHigh = ta.highest(high, 1)
prevLow = ta.lowest(low, 1)
shortEntryCondition = ccimomCrossUp and oversoldAgo and (not useDivergence or bullishDivergenceCondition) and (prevHigh >= meanReversion) and (prevLow >= meanReversion)
longEntryCondition = ccimomCrossDown and overboughtAgo and (not useDivergence or bearishDivergenceCondition) and (prevHigh <= meanReversion) and (prevLow <= meanReversion)

// Plotting
oldShortEntryCondition = ccimomCrossUp and oversoldAgo and (not useDivergence or bullishDivergenceCondition)
oldLongEntryCondition = ccimomCrossDown and overboughtAgo and (not useDivergence or bearishDivergenceCondition)
plotshape(oldLongEntryCondition, title='BUY', style=shape.triangleup, text='B', location=location.belowbar, color=color.new(color.lime, 0), textcolor=color.new(color.white, 0), size=size.tiny)
plotshape(oldShortEntryCondition, title='SELL', style=shape.triangledown, text='S', location=location.abovebar, color=color.new(color.red, 0), textcolor=color.new(color.white, 0), size=size.tiny)

// Strategy logic
if (longEntryCondition)
    stopLoss = close - stopLossInPips
    strategy.entry("Buy", strategy.long)
    strategy.exit("exit", "Buy", stop=stopLoss)
if (shortEntryCondition)
    stopLoss = close + stopLossInPips
    strategy.entry("Sell", strategy.short)
    strategy.exit("exit", "Sell", stop=stopLoss)

// Close all open positions when outside of bands
closeAll = (high >= upperBand) or (low <= lowerBand)

if (closeAll)
    strategy.close_all("Take Profit/Cut Loss")

// Plotting
plot(upperBand, title='Upper Band', color=color.fuchsia, linewidth=1)
plot(meanReversion, title='Mean', color=color.gray, linewidth=1)
plot(lowerBand, title='Lower Band', color=color.blue, linewidth=1)
Published by ChaoZhang on the FMZ strategy square · last modified 2023-12-20. Collected in the Quant Trading Vault. Unvalidated research: re-test with your own data and costs before trusting it.
Build this with AgenKit
A spec is not a trading system. Paste this into your coding agent and AgenKit runs a specialist team — architecture, test-first build, risk gates, review — with paper trading on by default.
/agenkit build a production-grade trading bot with a backtest engine, risk controls and paper trading by default from strategies/Reverse-Mean-Breakthrough-Strategy.md- npx agenkit install engineering-kit in your project
- Paste the command into your agent and approve each phase
- Get tests, backtest, risk controls and a paper-trading switch
Understand it first
Before you run this, read the lesson behind the idea and how to backtest it honestly. Specs like this one are the survivors of an unknown number of trials; deflate their results accordingly.
Related specs
- MACD Bollinger Turtle Trading StrategyPine Script · Breakout · 1d
- Bollinger Wave StrategyPine Script · Breakout · 1d
- EMA and Bollinger Bands Breakout StrategyPine Script · Breakout · 1h
- Momentum Breakout Mean Reversion StrategyPine Script · Breakout · 1h
- Momentum Breakout Moving Average StrategyPine Script · Breakout · 1d
- Momentum Breakout Trading Strategy 440964Pine Script · Breakout · 5m