Strategy vault / Trend following
RMI Trend Sync Strategy
The RMI Trend Sync strategy effectively combines the strengths of the Relative Momentum Index (RMI) and the Super Trend indicator to realize the integration of momentum analysis and trend judgment. By concurrently…
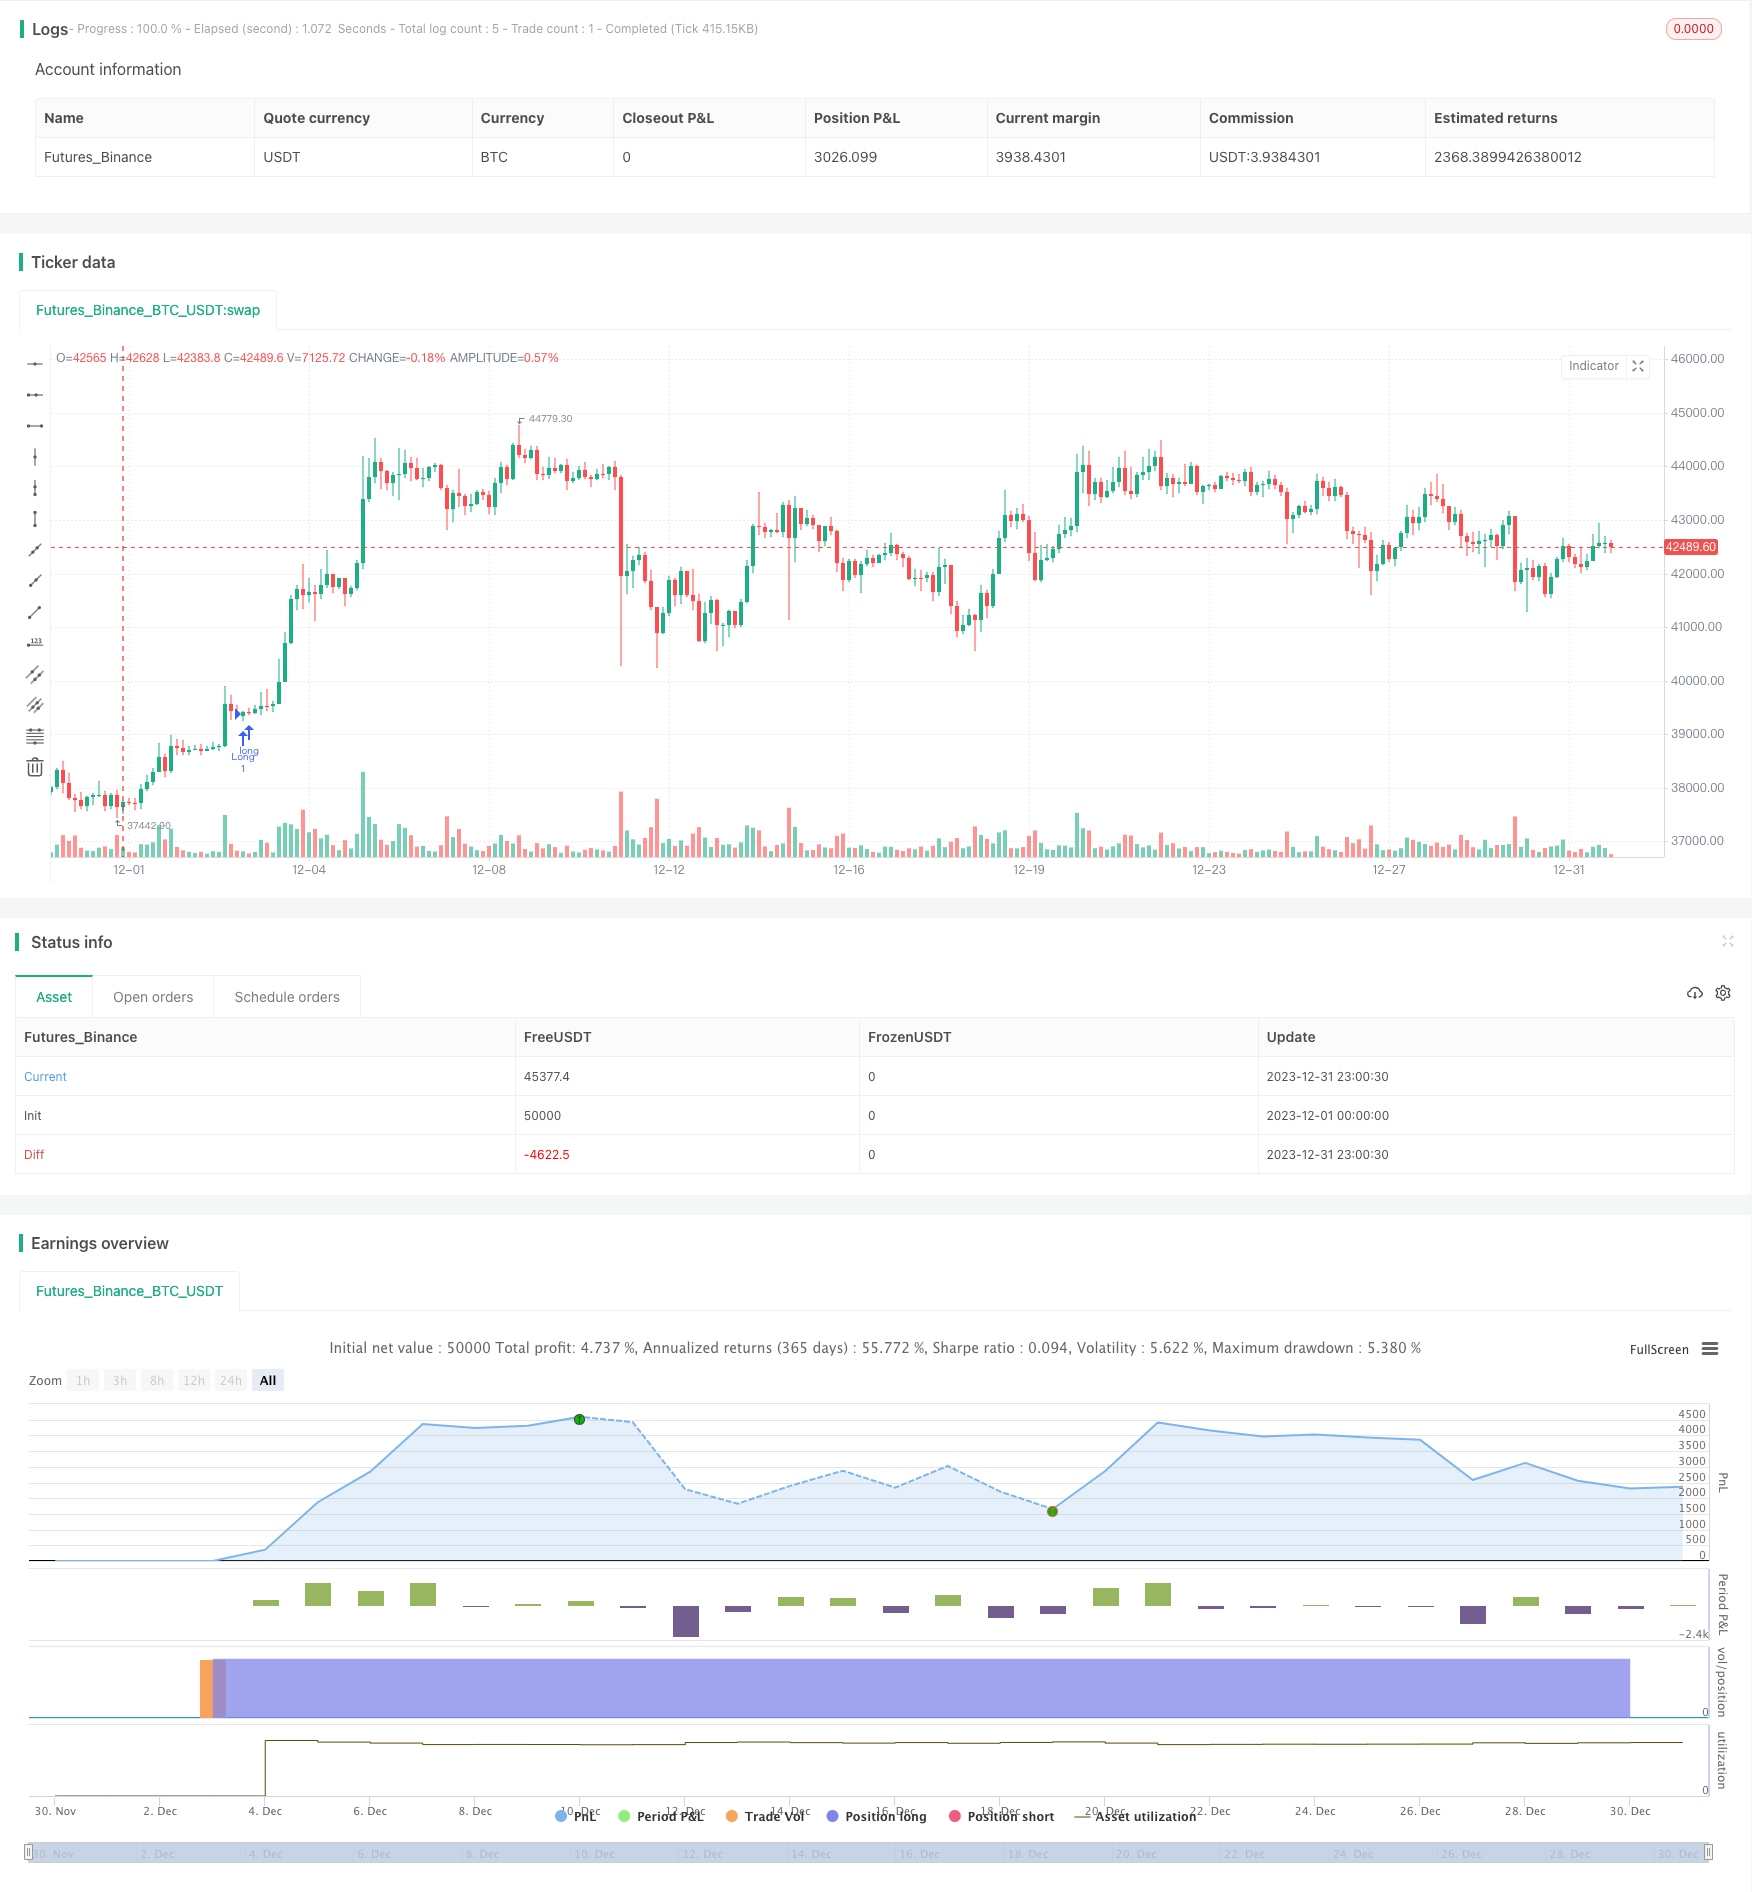
Overview
The RMI Trend Sync strategy effectively combines the strengths of the Relative Momentum Index (RMI) and the Super Trend indicator to realize the integration of momentum analysis and trend judgment. By concurrently monitoring price change trends and market momentum levels, the strategy determines market trends from a more comprehensive perspective.
Strategy Principles
Relative Momentum Index (RMI)
RMI is an enhanced version of the Relative Strength Index (RSI). It incorporates more features of price changes such as directionality and magnitude to more precisely gauge market momentum.
RMI Calculation Method
The RMI calculation method is: first calculate the average gain and average loss over a certain period. Unlike RSI, RMI uses the change between the current closing price and the previous closing price, rather than simple positive and negative growth. Then divide the average gain by the average loss and normalize the value to fit within a 0-100 scale.
Momentum Judgment
This strategy uses the mean value of RMI and MFI to compare with preset positive momentum and negative momentum thresholds to determine the current market momentum level for entry and exit decisions.
Super Trend Indicator
The Super Trend indicator is calculated based on a higher timeframe, which can provide judgments on major trends. It dynamically adjusts parameters based on the true volatility ATR to effectively identify trend reversals.
This strategy also incorporates the Volume Weighted Moving Average (VWMA) to further enhance its capability to detect important trend shifts.
Trading Direction Selection
This strategy allows choosing long, short or two-way trading. This flexibility enables traders to adapt to their market views and risk appetite.
Advantage Analysis
Combining Momentum and Trend Analysis
Compared with strategies relying solely on momentum or trend indicators, this strategy realizes more accurate market trend identification through integrating the strengths of RMI and Super Trend.
Multi-Timeframe Analysis
The application of RMI and Super Trend in different timeframes leads to a more appropriate grasp of both short-term and long-term trends.
Real-time Stop Loss
The real-time stop loss mechanism based on the Super Trend can effectively limit per trade loss.
Flexible Trading Direction
The choice among long, short or two-way trading allows this strategy to adapt to different market environments.
Risk Analysis
Difficult Parameter Optimization
The optimization for parameters like RMI and Super Trend is quite complex. Inappropriate settings may undermine strategy performance.
Stop Loss too Tight
Being overly sensitive to small fluctuations may result in excessive stop loss triggers.
Solution: Appropriately loosen the stop loss range or adopt other volatility-based stop loss methods.
Optimization Directions
Cross Asset Adaptiveness
Expanding applicable assets and identifying parameter optimization directions for different assets, to enable broader replication across more markets.
Dynamic Stop Loss
Incorporate dynamic stop loss mechanisms to better track current swing waves and reduce excessive stop loss caused by minor retracements.
Additional Filter Conditions
Add judgments from more indicators as filter conditions to avoid entering positions without clear signals.
Conclusion
Through the ingenious combination of RMI and Super Trend, this strategy realizes accurate market condition judgments. It also excels in risk control. With in-depth optimization, it is believed that its performance across more assets and timeframes will become increasingly remarkable.
Parameters
| Name | Default | What it controls |
|---|---|---|
| v_input_string_1 | 0 | Select Trading Direction: Both | Short | Long |
| v_input_int_1 | 21 | (?RMI Settings)RMI Length |
| v_input_int_2 | 70 | Positive Momentum Threshold |
| v_input_int_3 | 30 | Negative Momentum Threshold |
| v_input_int_4 | 30 | (?Momentum Settings)Band Length |
| v_input_int_5 | 20 | RWMA Length |
| v_input_int_6 | 10 | (?Super Trend Settings)Super Trend Length |
| v_input_timeframe_1 | 480 | Higher Time Frame |
| v_input_float_1 | 3.5 | Super Trend Factor |
| v_input_string_2 | 0 | MA Source: WMA | EMA | SMA | RMA | VWMA |
| v_input_bool_1 | true | (?Visual Settings)Display Range MA |
| v_input_color_1 | #00bcd4 | Bullish Color |
| v_input_color_2 | #ff5252 | Bearish Color |
Source Pine Script
/*backtest
start: 2023-12-01 00:00:00
end: 2023-12-31 23:59:59
period: 3h
basePeriod: 15m
exchanges: [{"eid":"Futures_Binance","currency":"BTC_USDT"}]
*/

// This source code is subject to the terms of the Mozilla Public License 2.0 at https://mozilla.org/MPL/2.0/
// @ presentTrading

//@version=5
strategy("RMI Trend Sync - Strategy [presentTrading]", shorttitle = "RMI Sync [presentTrading]", overlay=true )

// ---> Inputs --------------
// Add Button for Trading Direction
tradeDirection = input.string("Both", "Select Trading Direction", options=["Long", "Short", "Both"])

// Relative Momentum Index (RMI) Settings
Length = input.int(21, "RMI Length", group = "RMI Settings")
pmom = input.int(70, "Positive Momentum Threshold", group = "RMI Settings")
nmom = input.int(30, "Negative Momentum Threshold", group = "RMI Settings")
bandLength = input.int(30, "Band Length", group = "Momentum Settings")
rwmaLength = input.int(20, "RWMA Length", group = "Momentum Settings")


// Super Trend Settings
len = input.int(10, "Super Trend Length", minval=1, group="Super Trend Settings")
higherTf1 = input.timeframe('480', "Higher Time Frame", group="Super Trend Settings")
factor = input.float(3.5, "Super Trend Factor", step=.1, group="Super Trend Settings")
maSrc = input.string("WMA", "MA Source", options=["SMA", "EMA", "WMA", "RMA", "VWMA"], group="Super Trend Settings")
atr = request.security(syminfo.tickerid, higherTf1, ta.atr(len))
TfClose1 = request.security(syminfo.tickerid, higherTf1, close)

// Visual Settings
filleshow = input.bool(true, "Display Range MA", group = "Visual Settings")
bull = input.color(#00bcd4, "Bullish Color", group = "Visual Settings")
bear = input.color(#ff5252, "Bearish Color", group = "Visual Settings")

// Calculation of Bar Range
barRange = high - low

// RMI and MFI Calculations
upChange = ta.rma(math.max(ta.change(close), 0), Length)
downChange = ta.rma(-math.min(ta.change(close), 0), Length)
rsi = downChange == 0 ? 100 : upChange == 0 ? 0 : 100 - (100 / (1 + upChange / downChange))
mf = ta.mfi(hlc3, Length)
rsiMfi = math.avg(rsi, mf)

// Momentum Conditions
positiveMomentum = rsiMfi[1] < pmom and rsiMfi > pmom and rsiMfi > nmom and ta.change(ta.ema(close,5)) > 0
negativeMomentum = rsiMfi < nmom and ta.change(ta.ema(close,5)) < 0

// Momentum Status
bool positive = positiveMomentum ? true : negativeMomentum ? false : na
bool negative = negativeMomentum ? true : positiveMomentum ? false : na

// Band Calculation
calculateBand(len) =>
    math.min(ta.atr(len) * 0.3, close * (0.3/100)) * 4

band = calculateBand(bandLength)

// Range Weighted Moving Average (RWMA) Calculation
calculateRwma(range_, period) =>
    weight = range_ / math.sum(range_, period)
    sumWeightedClose = math.sum(close * weight, period)
    totalWeight = math.sum(weight, period)
    sumWeightedClose / totalWeight

rwma = calculateRwma(barRange, rwmaLength)
colour = positive ? bull : negative ? bear : na
rwmaAdjusted = positive ? rwma - band : negative ? rwma + band : na

max = rwma + band
min = rwma - band

longCondition       = positive and not positive[1]
shortCondition      = negative and not negative[1]

longExitCondition   = shortCondition
shortExitCondition  = longCondition

// Dynamic Trailing Stop Loss

vwma1 = switch maSrc
    "SMA"  => ta.sma(TfClose1*volume, len) / ta.sma(volume, len)
    "EMA"  => ta.ema(TfClose1*volume, len) / ta.ema(volume, len)
    "WMA"  => ta.wma(TfClose1*volume, len) / ta.wma(volume, len)

upperBand = vwma1 + factor * atr
lowerBand = vwma1 - factor * atr
prevLowerBand = nz(lowerBand[1])
prevUpperBand = nz(upperBand[1])
float superTrend = na
int direction = na
superTrend := direction == -1 ? lowerBand : upperBand

longTrailingStop = superTrend - atr * factor
shortTrailingStop = superTrend + atr * factor

// Strategy Order Execution
if (tradeDirection == "Long" or tradeDirection == "Both")
    strategy.entry("Long", strategy.long, when = longCondition)
    strategy.exit("Exit Long", "Long", when=longExitCondition, stop = longTrailingStop)
if (tradeDirection == "Short" or tradeDirection == "Both")
    strategy.entry("Short", strategy.short, when =shortCondition)
strategy.exit("Exit Short", "Short", when=shortExitCondition, stop = shortTrailingStop)Published by ChaoZhang on the FMZ strategy square · last modified 2024-01-16. Collected in the Quant Trading Vault. Unvalidated research: re-test with your own data and costs before trusting it.
Build this with AgenKit
A spec is not a trading system. Paste this into your coding agent and AgenKit runs a specialist team — architecture, test-first build, risk gates, review — with paper trading on by default.
/agenkit build a production-grade trading bot with a backtest engine, risk controls and paper trading by default from strategies/RMI-Trend-Sync-Strategy.md- npx agenkit install engineering-kit in your project
- Paste the command into your agent and approve each phase
- Get tests, backtest, risk controls and a paper-trading switch
Understand it first
Before you run this, read the lesson behind the idea and how to backtest it honestly. Specs like this one are the survivors of an unknown number of trials; deflate their results accordingly.
Related specs
- Supertrend Advance StrategyPine Script · Trend following · 5m
- Supertrend and Moving Average Crossover StrategyPine Script · Trend following · 2h
- Trend Tracking and Short term Trading Strategy Based on ADX IndicatorPine Script · Trend following · 1d
- Mini Pullback Supertrend StrategyPine Script · Trend following · 1h
- SuperTrend Trailing Stop Strategy Based on Heikin AshiPine Script · Trend following · 4h
- TrendHunter w MF Multi Timeframe Trend StrategyPine Script · Trend following · 1h