Strategy vault / Mean reversion
RSI Bollinger Bands Short term Trading Strategy
This strategy combines the Relative Strength Index (RSI) and Bollinger Bands to construct a short-term trading strategy. It mainly utilizes the buy and sell signals when RSI breaks through the upper or lower…
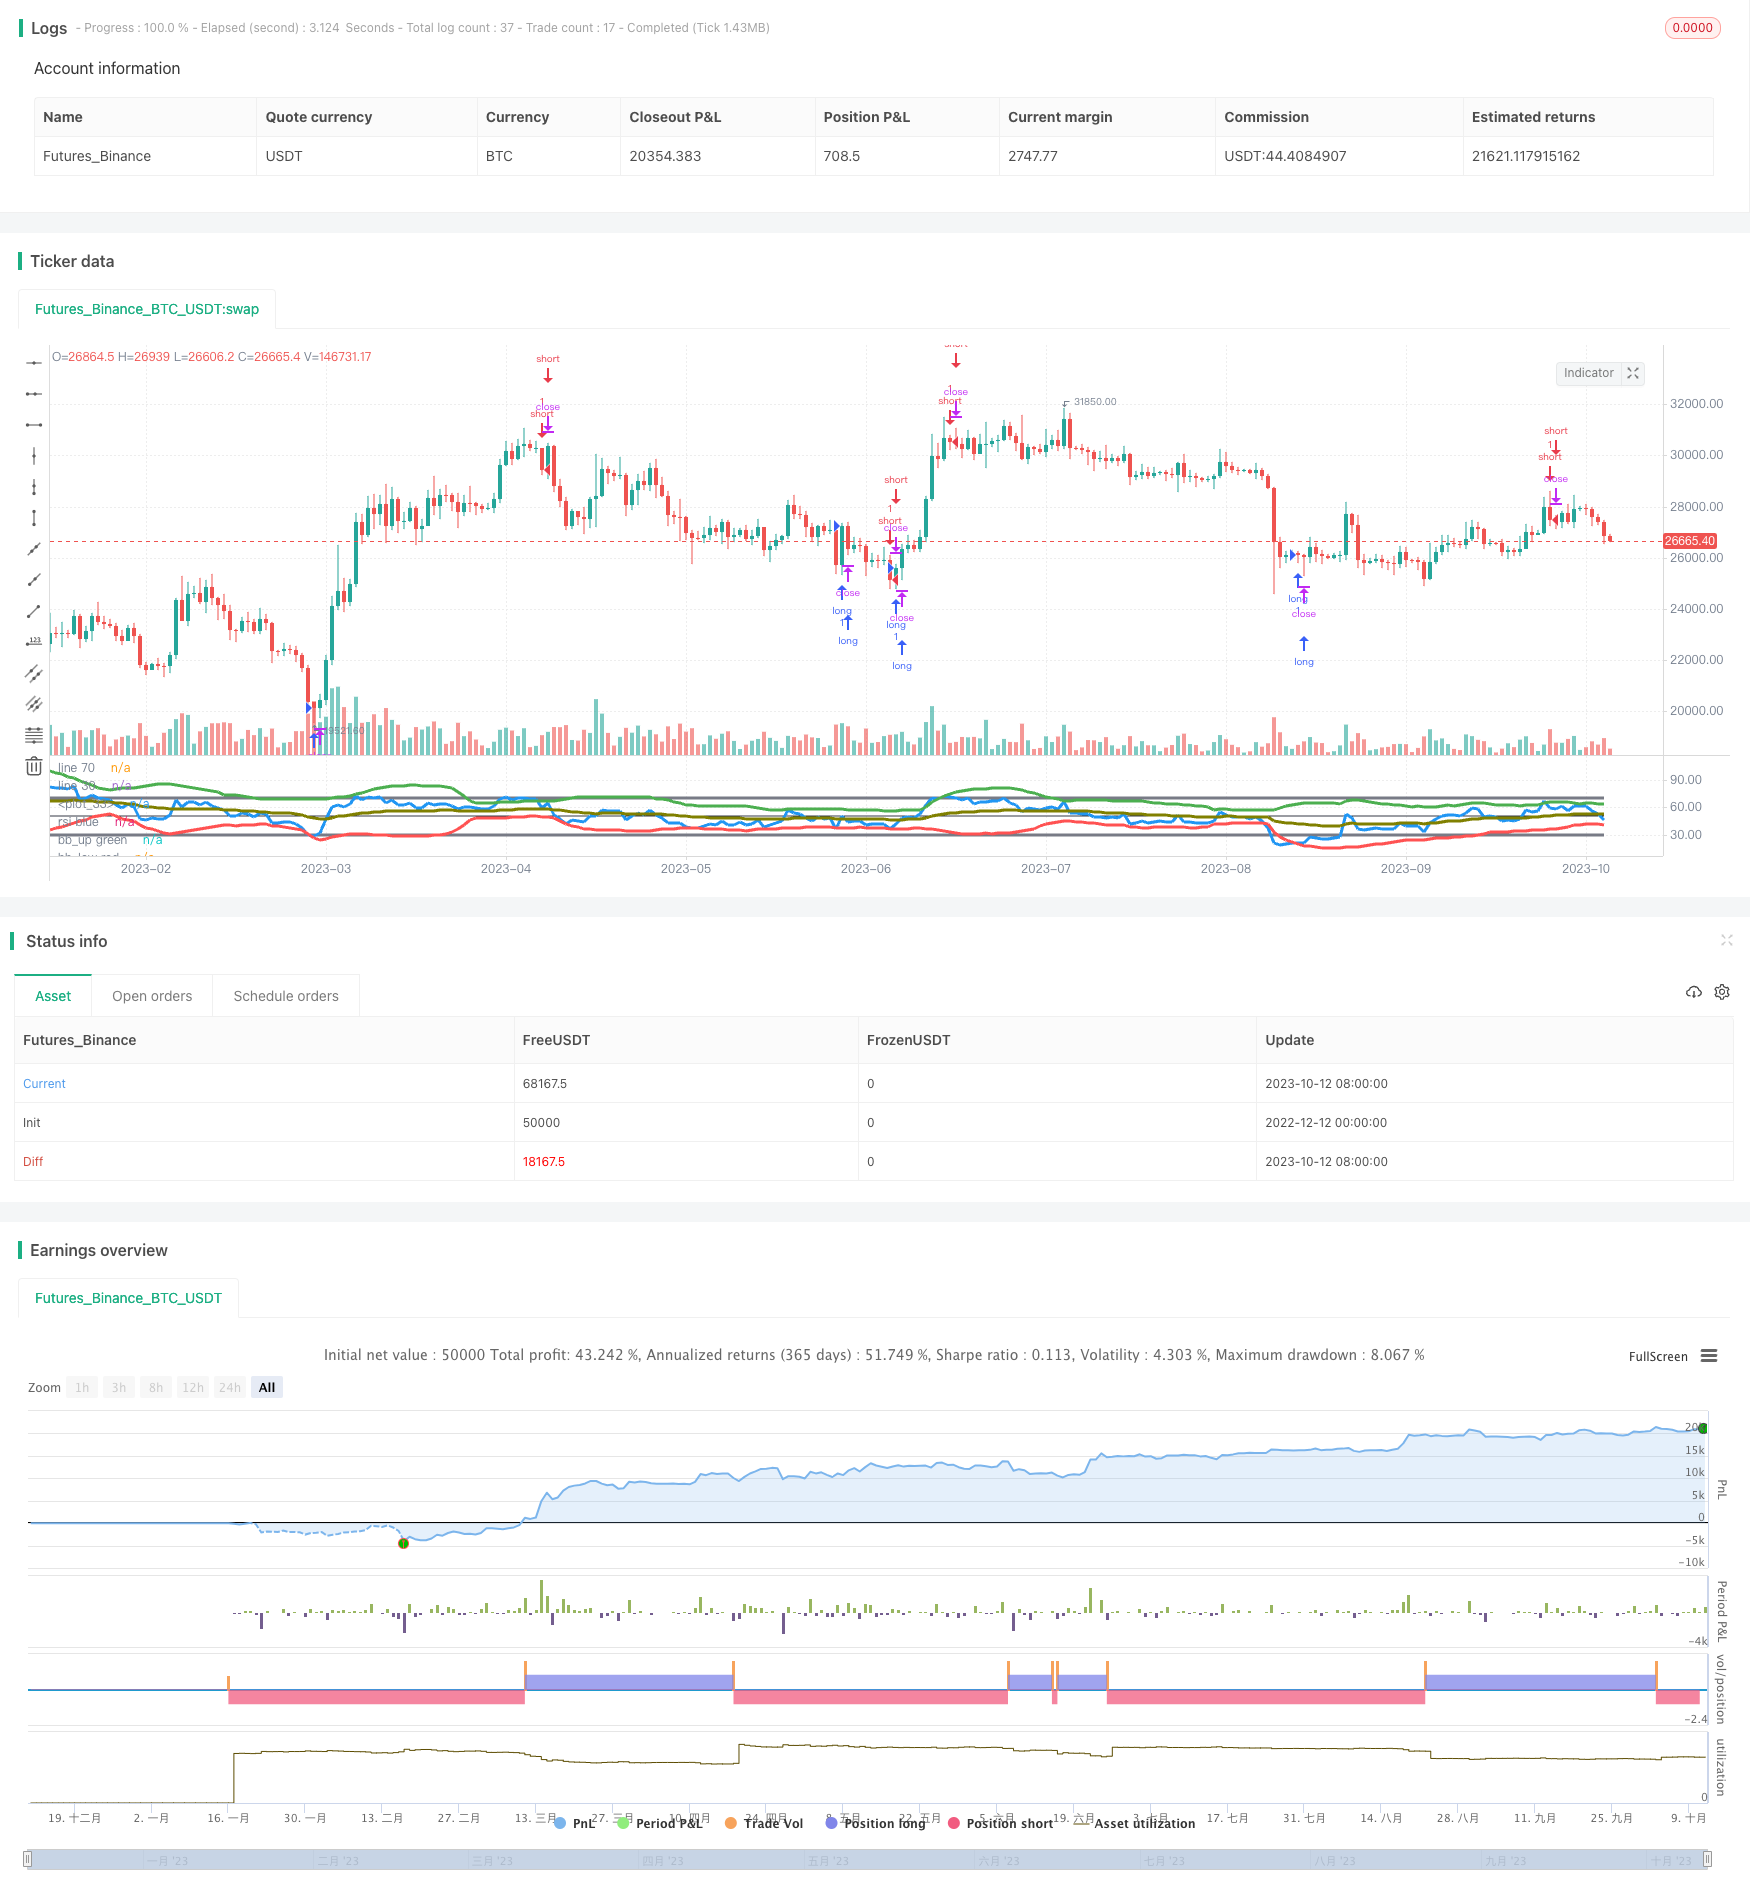
Overview
This strategy combines the Relative Strength Index (RSI) and Bollinger Bands to construct a short-term trading strategy. It mainly utilizes the buy and sell signals when RSI breaks through the upper or lower Bollinger Bands. Meanwhile, a stop loss mechanism is included to effectively control risks.
Strategy Logic
- Calculate the RSI indicator with a 14-period parameter.
- Calculate the Bollinger Midband using the weighted moving average of RSI, with a period set to 25.
- Calculate the Upper Band and Lower Band of Bollinger Bands. The Upper Band is the Midband plus the amplitude, while the Lower Band is the Midband minus the amplitude. The amplitude is set to 20 times the RSI standard deviation.
- Go long when RSI breaks through the Lower Band, and go short when RSI breaks through the Upper Band.
- Set a stop loss mechanism that if the price drops below 6% of the long entry price, close the long position.
Advantage Analysis
This strategy combines the strengths of both RSI and Bollinger Bands for short-term trading. The main advantages are:
- RSI can effectively determine overbought and oversold scenarios. Combining Bollinger Bands adds accuracy to the trading signals.
- Bollinger Bands are dynamic to automatically adjust the range based on market volatility.
- The stop loss setting is reasonable with 6% tolerance for normal fluctuations while controlling losses.
Risk Analysis
Potential risks of this strategy includes:
- RSI has lagging characteristics and may miss fast reversal opportunities.
- Incorrect Bollinger Bands parameter or drastic market swings can cause bad signals.
- Stop loss parameter set unwisely may lead to unnecessary losses.
Solutions:
- Consider combining with other indicators like KDJ for comprehensive judgment.
- Dynamically optimize parameters for different markets.
- Backtest and optimize stop loss parameter for best setting.
Optimization Directions
There is room for further optimization:
- Change fixed stop loss to dynamic trailing stop loss according to price fluctuation.
- Add Bollinger Band Width Index rules to pause trading when Bands expand or contract too much.
- Combine volume indicators like Chaikin Money Flow for better confirmation.
Summary
In summary, this is a relatively stable and reliable short-term trading strategy. By combining the strengths of overbought-oversold judgment of RSI and the adaptive range of Bollinger Bands, it forms an advantageous short-term system. With parameter tuning and logic refinement, this strategy can achieve consistent profits.
Parameters
| Name | Default | What it controls |
|---|---|---|
| v_input_1 | 14 | len_rsi |
| v_input_2 | 25 | len_bb |
| v_input_3 | 20 | mul10 |
| v_input_4 | 94 | stop loss rate |
Source Pine Script
/*backtest
start: 2022-12-12 00:00:00
end: 2023-10-13 00:00:00
period: 1d
basePeriod: 1h
exchanges: [{"eid":"Futures_Binance","currency":"BTC_USDT"}]
*/

//@version=3
strategy("rsi+bb st", shorttitle="rsibb st 0.3")

len_rsi=input(14)
len_bb = input(25)
mul10 = input(20.0)
mul=mul10/10
sl100 = input(94.0, title='stop loss rate')
sl=sl100/100

lw = 3

vwma_e(src, len) =>
    ema(src*volume, len)/ema(volume,len)

rsi = rsi(close, len_rsi)
plot(rsi, color=blue, title= 'rsi blue', linewidth=lw)
plot(70, color=gray, title='line 70', linewidth=lw)
plot(30, color=gray, title='line 30', linewidth=lw)

bbg = stdev(rsi, len_bb)*mul
bbc = vwma_e(rsi, len_bb)
//bbc=ema(rsi,len_bb)
ratio = 0.6
bbc := bbc*ratio + 50*(1-ratio)

bbu = bbc+bbg
bbl = bbc-bbg
plot(bbu, color=green, title='bb_up green', linewidth=lw)
plot(bbl, color=red, title='bb_low red', linewidth=lw)
plot(bbc, color=#808000ff, title='bb center', linewidth=lw)

plot(50, color=black)

lc = crossover(rsi, bbl) //or crossover(rsi, bbc)
sc = crossunder(rsi, bbu)

last_pos = 0*close
if lc
    last_pos := 1
else
    last_pos := last_pos[1]
if sc
    last_pos := 2

last_price = 0*close
if last_pos[1] !=1 and last_pos == 1
    last_price := close
else
    last_price := last_price[1]

if last_pos==1 and close < last_price*sl
    lc:=false
    sc:=true
    last_pos:=2

if (lc)
    strategy.entry("long", strategy.long)

if (sc)
strategy.entry("short", strategy.short)Published by ChaoZhang on the FMZ strategy square · last modified 2023-12-19. Collected in the Quant Trading Vault. Unvalidated research: re-test with your own data and costs before trusting it.
Build this with AgenKit
A spec is not a trading system. Paste this into your coding agent and AgenKit runs a specialist team — architecture, test-first build, risk gates, review — with paper trading on by default.
/agenkit build a production-grade trading bot with a backtest engine, risk controls and paper trading by default from strategies/RSI-Bollinger-Bands-Short-term-Trading-Strategy.md- npx agenkit install engineering-kit in your project
- Paste the command into your agent and approve each phase
- Get tests, backtest, risk controls and a paper-trading switch
Understand it first
Before you run this, read the lesson behind the idea and how to backtest it honestly. Specs like this one are the survivors of an unknown number of trials; deflate their results accordingly.
Related specs
- Advanced 15 Minute Chart Trading Signal StrategyPine Script · Mean reversion · 3h
- Advanced Quantitative Trading Strategy Combining RSI Divergence and Moving AveragesPine Script · Mean reversion · 1h
- Momentum Reversal Trend Tracking StrategyPine Script · Mean reversion
- Reversal RSI Trend Tracking ETF Trading StrategyPine Script · Mean reversion · 3m
- Reversal Trading Strategy with Bollinger Bands RSI ADX and ATRPine Script · Mean reversion · 1h
- Bollinger Bands RSI EMA Double Trading StrategyPine Script · Mean reversion · 3m