RSI Dual track Breakthrough Strategy
The strategy is named "RSI Dual-track Breakthrough Strategy". It utilizes the dual tracks of the RSI indicator for judgment to achieve the goal of buy low and sell high. When the RSI indicator falls below the set…
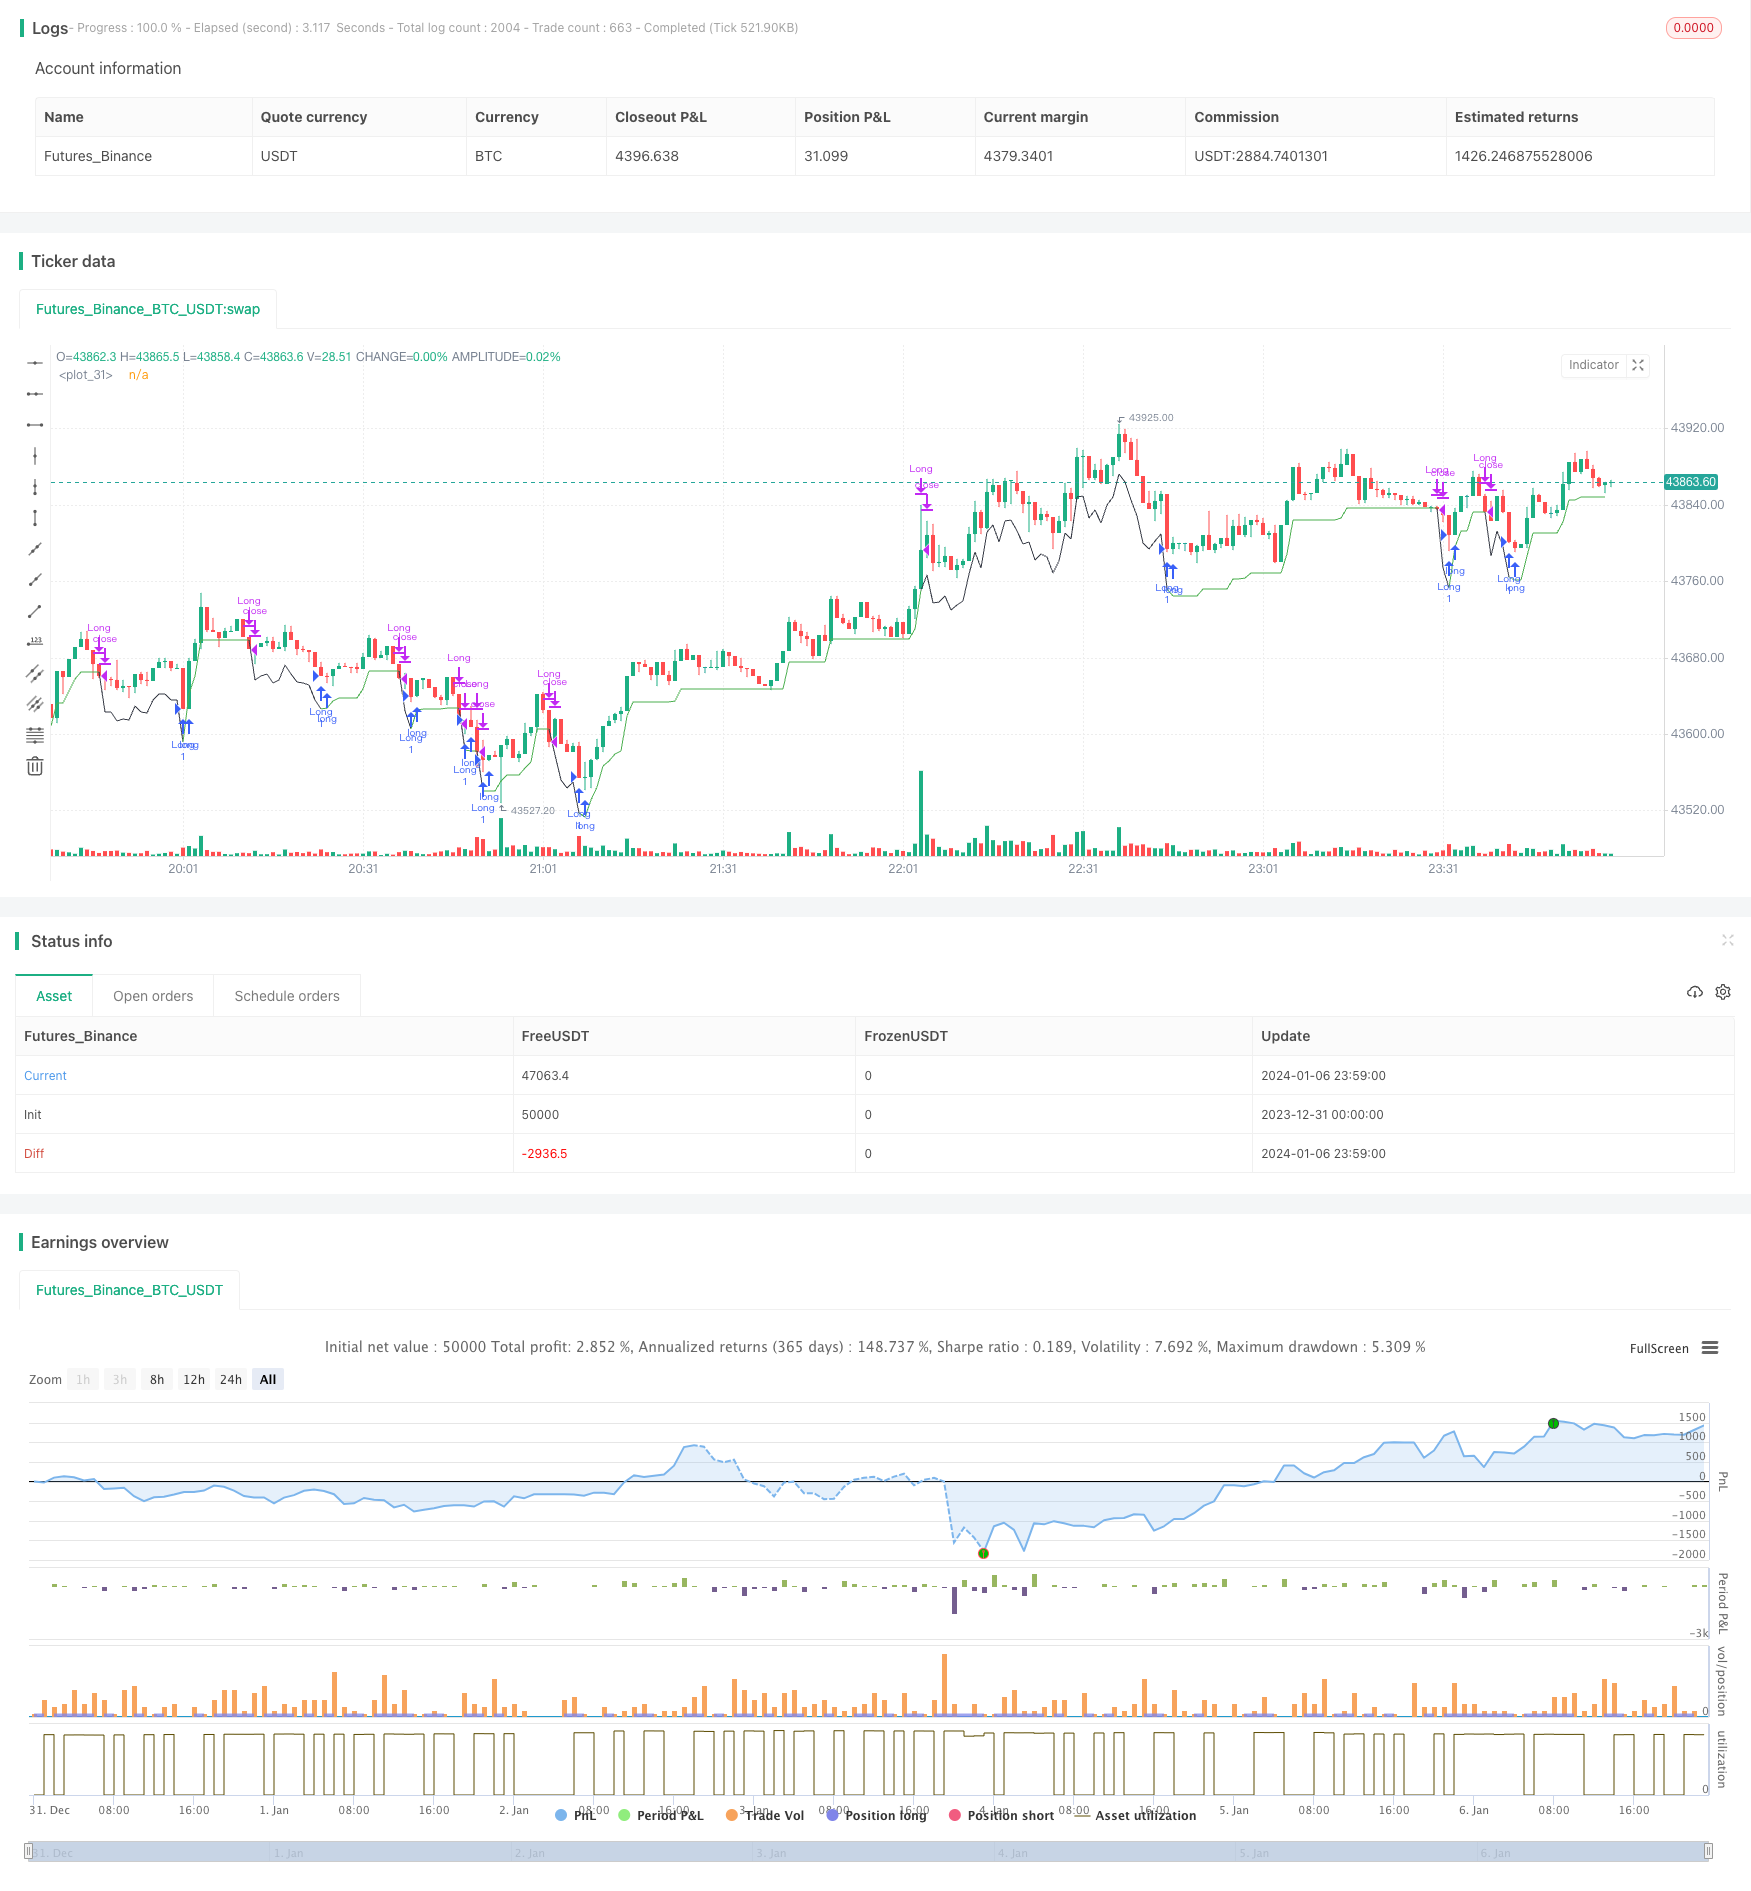
Overview
The strategy is named "RSI Dual-track Breakthrough Strategy". It utilizes the dual tracks of the RSI indicator for judgment to achieve the goal of buy low and sell high. When the RSI indicator falls below the set lower track (default 40), it is considered as a buy signal. At this time, if RSI10 is less than RSI14, it further confirms the buy; When the RSI indicator rises above the set upper track (default 70), it is considered as a sell signal. At this time, if RSI10 is greater than RSI14, it further confirms the sell. The strategy also sets the mechanisms of moving stop loss and take profit.
Strategy Principle
The core logic of this strategy is to use the dual tracks of the RSI indicator for judgment. The RSI indicator is generally set to 14 periods, representing the strength and weakness of the stock in recent 14 days. This strategy adds RSI10 as an auxiliary judgment indicator.
When the RSI14 breaks below the 40 track, it is believed that the stock price has broken through the weak side and there may be a chance of support rebound. At this time, if RSI10 is less than RSI14, it means that the short-term trend is still downward, which can further confirm the sell signal. So when "RSI14 <= 40 and RSI10 <RSI14" is met, a buy signal is generated.
When RSI14 breaks above the 70 track, it is believed that the stock price has entered a short-term strong area and there may be a chance for a pullback adjustment. At this time, if RSI10 is greater than RSI14, it means the short-term trend continues upward, which can further confirm the buy signal. So when "RSI14 >= 70 and RSI10> RSI14" is met, a sell signal is generated.
Thus, the combination judgment of RSI14 and RSI10 constitutes the core logic of the dual-track strategy.
Advantages of the Strategy
- The combination judgment of dual RSI indicators can capture trading signals more accurately
- The adoption of moving stop loss mechanism can cut the loss timely and control the maximum drawdown
- The setting of take profit exit mechanism allows exiting when reaching the target profit, avoiding profiteering retracement
Risks of the Strategy
- RSI indicator is prone to generate false signals and losses can not be completely avoided
- If stop loss point is set too close it may be taken out soon, if set too big it's hard to control risks
- In abnormal market conditions like gap, it may also lead to losses
To fully utilize this strategy, RSI parameters can be adjusted properly, stop loss position should be strictly controlled, avoid over-frequent operations, and pursue steady profitability.
Directions of Strategy Optimization
- Consider incorporating other indicators for combination validation, like KDJ, MACD etc.
- Set RSI parameters respectively based on the characteristics of different products
- Set dynamic stop loss based on indicators like ATR to adjust stop position timely
- Optimize RSI parameters automatically through machine learning techniques
Summary
This strategy makes judgment based on the dual-track idea of RSI and filters out some noisy signals to some extent. But no single indicator strategies can be perfect, RSI indicator is prone to mislead and should be viewed cautiously. This strategy incorporates moving stop loss and take profit mechanisms to control risks, which is essential. Future optimizations could be continued to make strategy parameters and stop loss methods more intelligent and dynamic.
Parameters
| Name | Default | What it controls |
|---|---|---|
| v_input_1 | timestamp(01 Jan 2015 13:30 +0000) | Backtest Start Time |
| v_input_2 | false | Exit when Risk:Reward met |
| v_input_3 | 3 | Risk:[Reward] (i.e. 3) for exit |
| v_input_4 | true | Use trailing stop loss |
| v_input_5 | 2 | ATR multiplier for stop loss |
| v_input_6 | 40 | RSI entry |
| v_input_7 | 70 | RSI exit |
Source Pine Script
/*backtest
start: 2023-12-31 00:00:00
end: 2024-01-07 00:00:00
period: 1m
basePeriod: 1m
exchanges: [{"eid":"Futures_Binance","currency":"BTC_USDT"}]
*/

// This source code is subject to the terms of the Mozilla Public License 2.0 at https://mozilla.org/MPL/2.0/
// © DojiEmoji

//@version=4
strategy("[KL] RSI 14 + 10 Strategy",overlay=true)

backtest_timeframe_start = input(defval = timestamp("01 Jan 2015 13:30 +0000"), title = "Backtest Start Time", type = input.time)
//backtest_timeframe_end = input(defval = timestamp("19 Mar 2021 19:30 +0000"), title = "Backtest End Time", type = input.time)
TARGET_PROFIT_MODE = input(false,title="Exit when Risk:Reward met")
REWARD_RATIO = input(3,title="Risk:[Reward] (i.e. 3) for exit")
// Trailing stop loss {
TSL_ON = input(true,title="Use trailing stop loss")
var entry_price = float(0)
ATR_multi_len = 26
ATR_multi = input(2, "ATR multiplier for stop loss")
ATR_buffer = atr(ATR_multi_len) * ATR_multi
plotchar(ATR_buffer, "ATR Buffer", "", location = location.top)
risk_reward_buffer = (atr(ATR_multi_len) * ATR_multi) * REWARD_RATIO
take_profit_long = low > entry_price + risk_reward_buffer
take_profit_short = low < entry_price - risk_reward_buffer
var bar_count = 0 //number of bars since entry
var trailing_SL_buffer = float(0)
var stop_loss_price = float(0)
stop_loss_price := max(stop_loss_price, close - trailing_SL_buffer)
// plot TSL line
trail_profit_line_color = color.green
showLine = strategy.position_size == 0
if showLine
    trail_profit_line_color := color.black
    stop_loss_price := close - trailing_SL_buffer
plot(stop_loss_price,color=trail_profit_line_color)
// }
// RSI
RSI_LOW = input(40,title="RSI entry")
RSI_HIGH = input(70,title="RSI exit")
rsi14 = rsi(close, 14)
rsi10 = rsi(close, 10)

if true// and time <= backtest_timeframe_end
    buy_condition = rsi14 <= RSI_LOW and rsi10 < rsi14
    exit_condition = rsi14 >= RSI_HIGH and rsi10 > rsi14
    //ENTRY:
    if strategy.position_size == 0 and buy_condition
        entry_price := close
        trailing_SL_buffer := ATR_buffer
        stop_loss_price := close - ATR_buffer
        strategy.entry("Long",strategy.long, comment="buy")
        bar_count := 0
    else if strategy.position_size > 0
        bar_count := bar_count + 1

    //EXIT:
    // Case (A) hits trailing stop
    if TSL_ON and strategy.position_size > 0 and close <= stop_loss_price
        if close > entry_price
            strategy.close("Long", comment="take profit [trailing]")
            stop_loss_price := 0
        else if close <= entry_price and bar_count
            strategy.close("Long", comment="stop loss")
            stop_loss_price := 0
        bar_count := 0
    // Case (B) take targeted profit relative to risk
    if strategy.position_size > 0 and TARGET_PROFIT_MODE
        if take_profit_long
            strategy.close("Long", comment="take profits [risk:reward]")
            stop_loss_price := 0
        bar_count := 0
    // Case (C)
    if strategy.position_size > 0 and exit_condition
        if take_profit_long
            strategy.close("Long", comment="exit[rsi]")
            stop_loss_price := 0
        bar_count := 0
Published by ChaoZhang on the FMZ strategy square · last modified 2024-01-08. Collected in the Quant Trading Vault. Unvalidated research: re-test with your own data and costs before trusting it.
Build this with AgenKit
A spec is not a trading system. Paste this into your coding agent and AgenKit runs a specialist team — architecture, test-first build, risk gates, review — with paper trading on by default.
/agenkit build a production-grade trading bot with a backtest engine, risk controls and paper trading by default from strategies/RSI-Dual-track-Breakthrough-Strategy.md- npx agenkit install engineering-kit in your project
- Paste the command into your agent and approve each phase
- Get tests, backtest, risk controls and a paper-trading switch
Understand it first
Before you run this, read the lesson behind the idea and how to backtest it honestly. Specs like this one are the survivors of an unknown number of trials; deflate their results accordingly.
Related specs
- Dual MA Momentum Breakout StrategyPine Script · Breakout · 1h
- Dynamic Stop Loss Strategy Adaptive to ATR FluctuationsPine Script · Breakout · 1h
- EMA and Bollinger Bands Breakout StrategyPine Script · Breakout · 1h
- MA Trendline Breakthrough StrategyPine Script · Breakout · 1d
- Momentum Breakout Moving Average StrategyPine Script · Breakout · 1d
- Momentum Breakout Trading Strategy 440964Pine Script · Breakout · 5m