Strategy vault / Trend following
RSI EMA Crossover Strategy
This strategy utilizes the principle of exponential moving average (EMA) crossovers, combined with the RSI indicator, to determine trend direction for entries and exits.
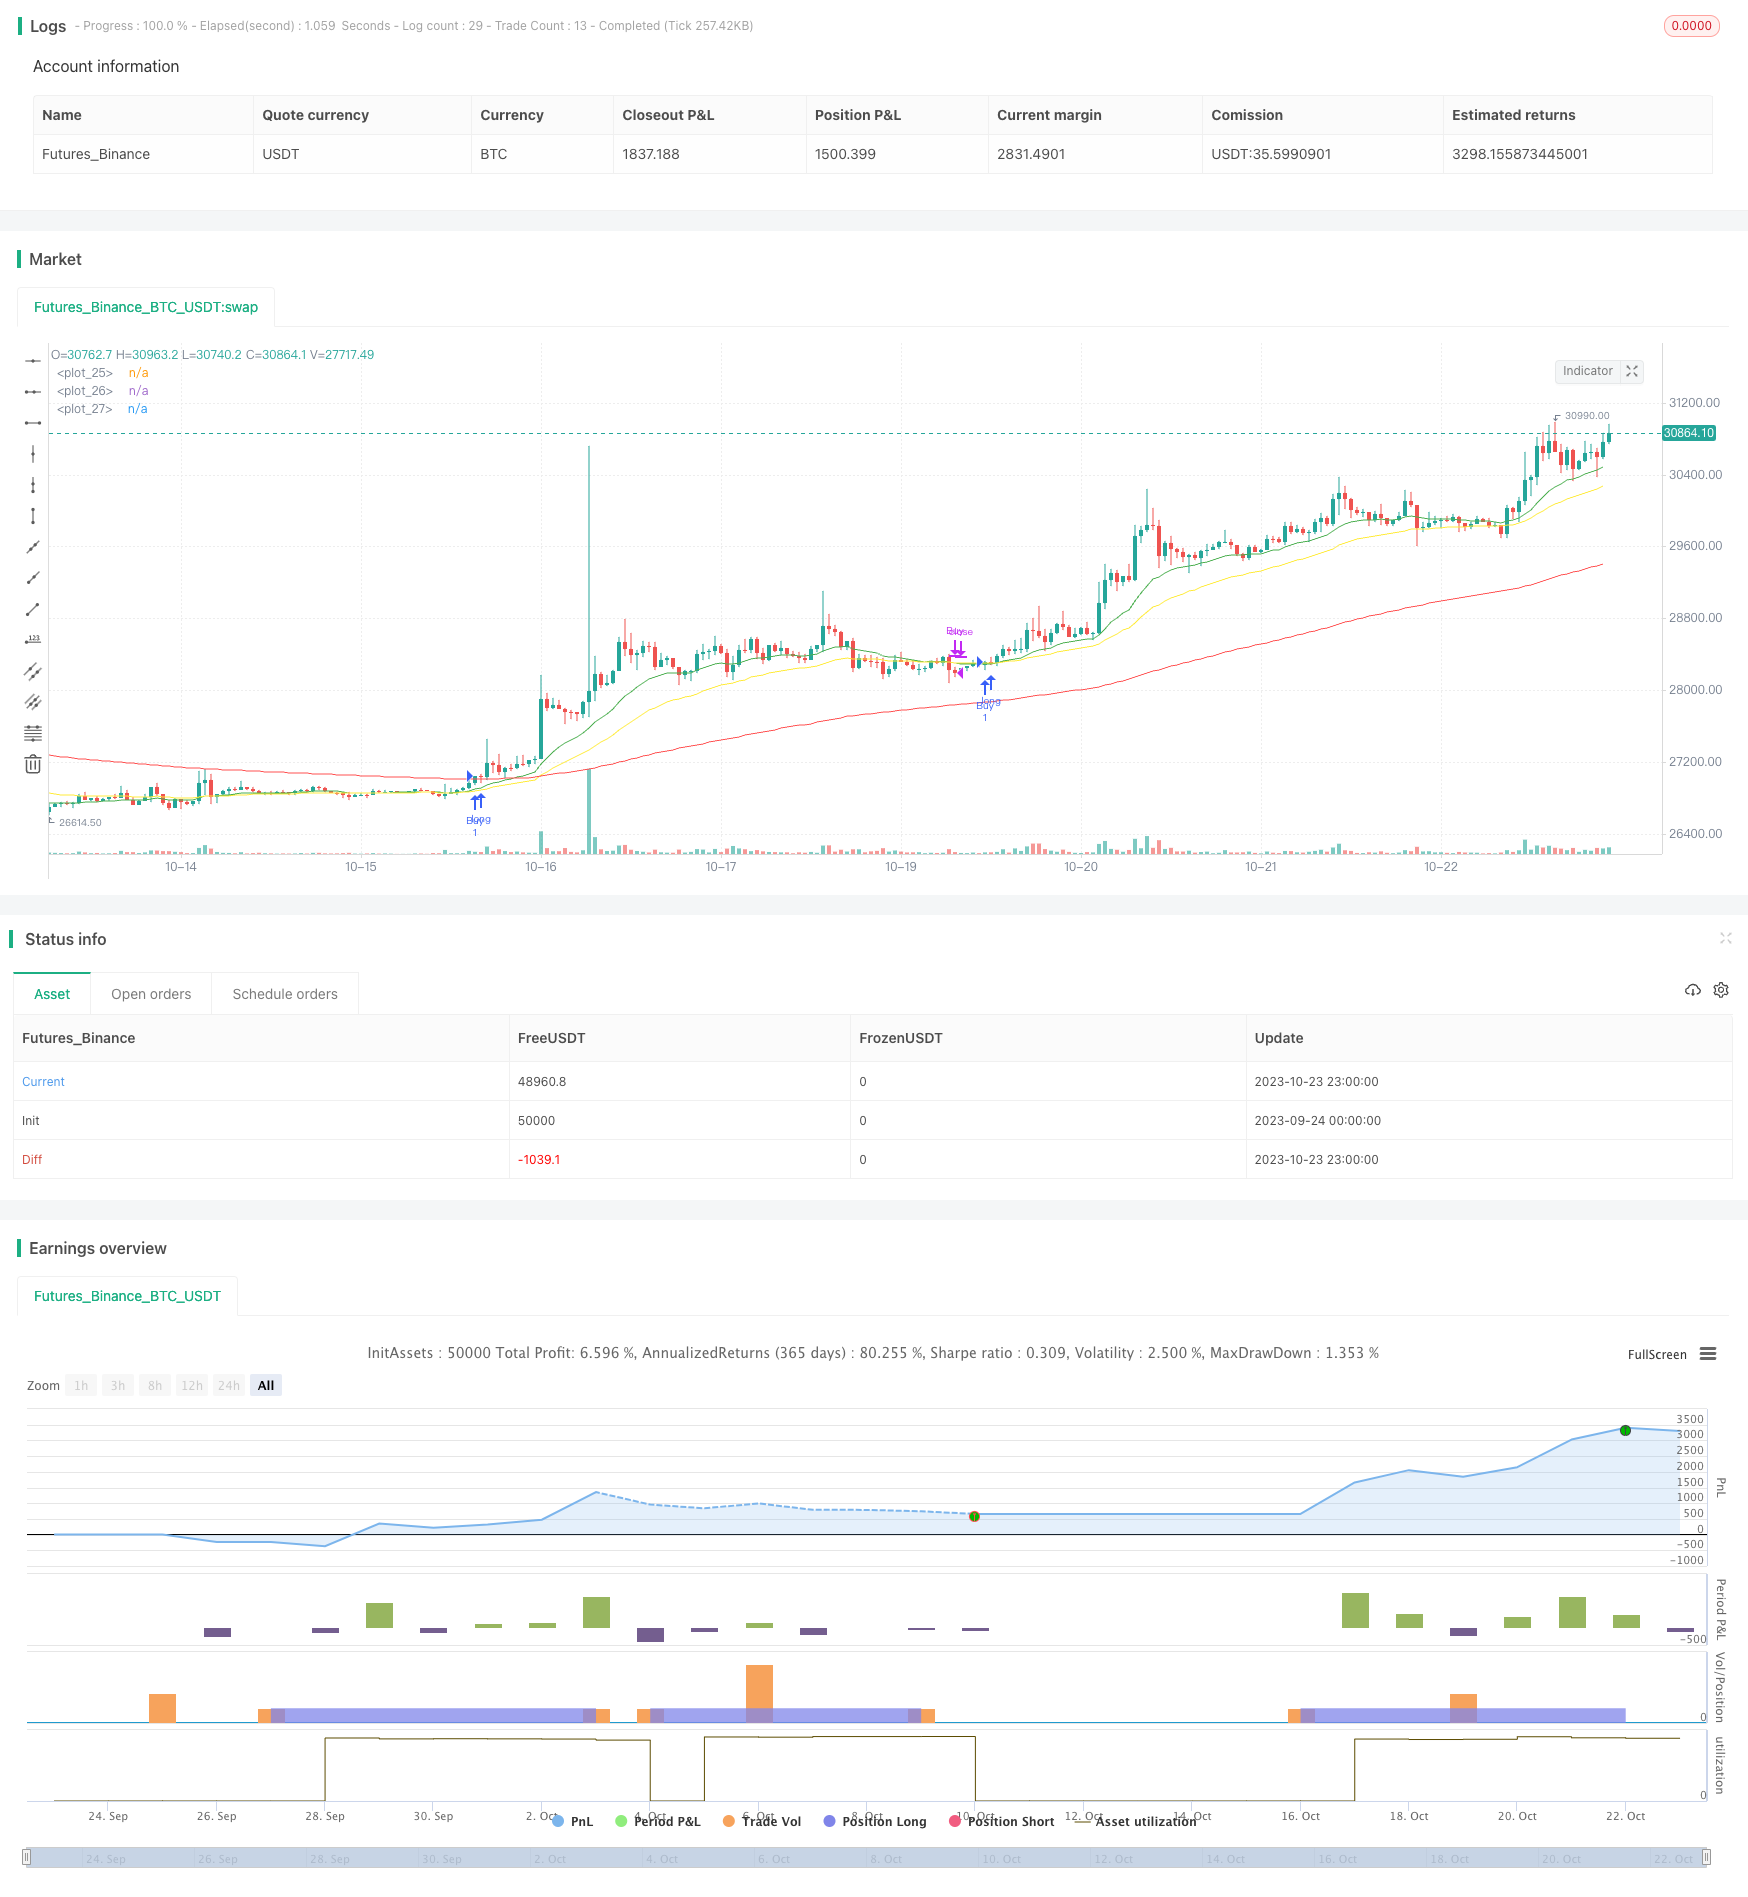
Overview
This strategy utilizes the principle of exponential moving average (EMA) crossovers, combined with the RSI indicator, to determine trend direction for entries and exits.
Strategy Logic
The strategy uses 3 EMA lines with different periods - fast, medium and slow lines. A buy signal is generated when the fast EMA crosses above the medium EMA, and a sell signal is generated when the fast EMA crosses below the medium EMA.
The strategy also incorporates the RSI indicator to gauge overbought and oversold conditions. The RSI calculates a ratio of average up days to average down days over a period to show the relative strength of an asset. Values above the overbought threshold signal overbought conditions, while values below the oversold threshold signal oversold conditions.
The buy conditions for the strategy are:
- Price crossing above fast, medium and slow EMA lines
- RSI crossing above the oversold threshold
The sell conditions are:
- Fast EMA crossing below medium EMA
- RSI crossing below the medium line
Using EMA crossovers to determine trend direction combined with RSI to identify short-term reversal opportunities, this strategy makes use of both trend following and mean reversion concepts.
Advantage Analysis
This strategy combines EMA crossovers and RSI to gauge both trend and overbought/oversold levels, filtering out false breakouts and noisy trades. Using 3 EMA lines gives a clear trend bias.
The RSI settings allow the strategy to time entries and exits at advantageous overbought/oversold areas.
The requirement for price to break all 3 EMA lines before entering trades helps avoid being whipsawed.
Risk Analysis
Like all backtested strategies, this strategy faces the risk of backtest overfitting. Changing market conditions in live trading may render the optimized parameters unsuitable.
In ranging markets, the strategy may generate false signals and suffer losses.
Poor RSI parameter tuning may lead to missed opportunities or false signals.
Enhancement Opportunities
Consider adding validation on higher timeframes to avoid noise.
Wait for retest of EMA lines before entering trades to validate signal.
Incorporate other indicators like MACD, Bollinger Bands for combined signal confirmation.
Use machine learning to optimize parameters for robustness.
Consider adding stop loss to exit uncertain trends quickly.
Conclusion
This strategy combines EMA crossovers and RSI to identify trend while taking advantage of short-term reversals. It utilizes both trend following and mean reversion concepts efficiently. There is scope for optimization via signal validation, parameter tuning, stop losses etc. But backtest overfitting needs to be considered, and live performance should be evaluated. Overall, this serves as a useful reference for learning, but requires further validation in live markets.
Parameters
| Name | Default | What it controls |
|---|---|---|
| v_input_int_1 | 26 | Rsi Lenght |
| v_input_int_2 | 30 | Rsi OVS line |
| v_input_int_3 | 70 | Rsi OVB line |
| v_input_int_4 | 42 | Rsi Medium line |
| v_input_int_5 | 17 | EMA Fast |
| v_input_int_6 | 35 | EMA Medium |
| v_input_int_7 | 142 | EMA Slow |
| v_input_int_8 | 2011 | Start Year |
| v_input_int_9 | true | Start Month |
| v_input_int_10 | true | Start Day |
| v_input_int_11 | 2025 | End Year |
| v_input_int_12 | true | End Month |
| v_input_int_13 | true | End Day |
Source Pine Script
/*backtest
start: 2023-09-24 00:00:00
end: 2023-10-24 00:00:00
period: 1h
basePeriod: 15m
exchanges: [{"eid":"Futures_Binance","currency":"BTC_USDT"}]
*/

// This source code is subject to the terms of the Mozilla Public License 2.0 at https://mozilla.org/MPL/2.0/
// © chadsadachai

//@version=5
strategy("EMA Cross V1", overlay= true)

//rsi
length = input.int(title = "Rsi Lenght" , defval=26 , minval=1, maxval=50)
overS = input.int(title = "Rsi OVS line" , defval=30 , minval=1, maxval=40)
overB = input.int(title = "Rsi OVB line" , defval=70 , minval=1, maxval=100)
mLine = input.int(title = "Rsi Medium line" , defval=42 , minval=1, maxval=60)
price = close
vrsi = ta.rsi(price, length)
co = vrsi >= mLine and vrsi < overB
cu = ta.crossunder(vrsi, overB)
//ema
F = input.int(title = "EMA Fast" , defval=17 , minval=1, maxval=50)
M = input.int(title = "EMA Medium" , defval=35, minval=1, maxval=100)
S = input.int(title = "EMA Slow" , defval=142, minval=1, maxval=200)
emaF = ta.ema(price , F)
emaM = ta.ema(price , M)
emaS = ta.ema(price , S)

//plot
plot(emaF , color = color.green , linewidth=1)
plot(emaM , color = color.yellow , linewidth=1)
plot(emaS , color = color.red , linewidth=1)

//Time Stamp
start = timestamp(input.int(title = "Start Year" , defval=2011 , minval=2011, maxval=2025), input.int(title = "Start Month" , defval=1 , minval=1, maxval=12), input.int(title = "Start Day" , defval=1 , minval=1, maxval=31), 0, 0)
end = timestamp(input.int(title = "End Year" , defval=2025 , minval=2011, maxval=2025), input.int(title = "End Month" , defval=1 , minval=1, maxval=12), input.int(title = "End Day" , defval=1 , minval=1, maxval=31), 0, 0)
// years = input.int(title = "Year" , defval=2018 , minval=2011, maxval=2025)
// months = input.int(title = "Month" , defval=1 , minval=1, maxval=12)
// days = input.int(title = "Day" , defval=1 , minval=1, maxval=31)

//longCondition Default
// longCondition1 = EMA_Fast >= EMA_Slow and EMA_Fast >= EMA_Medium//ta.crossover(EMA_Fast, EMA_Slow)  EMA_Fast > EMA_Slow and EMA_Medium > EMA_Slow
// longCondition3 = price >= EMA_Medium and price > EMA_Slow
// longCondition2 = vrsi >= overSold and vrsi <= overBought

//longCondition & shortCondition ETHUSD
// 1.price > emaF > emaM > emaS
// 2.rsi overcross overS
longC1 = price > emaF and price > emaM and price > emaS
// longC1 = ta.crossover(emaF, emaM)
longC2 = if longC1
    co
// shortC1 = EMA_Fast < EMA_Medium //and EMA_Fast < EMA_Slow and EMA_Medium < EMA_Slow //and cu
// shortC2 = overBought > vrsi //and vrsi < overBought //overSold < vrsi and vrsi < mediumLine

// exitLong Condition
// 1.price < emaF < emaM < emaS
// 2.rsi overcross mediumLine
exitLong1 = ta.crossunder(emaF, emaM) //or emaF < emaM//and price < emaM and price < emaF
exitLong2 = ta.crossunder(vrsi,mLine)
//exitLong3 = price < emaM
//strategy.entry
if time >=start and time <=end
    strategy.entry("Buy", strategy.long , when = longC1 and longC2)

// if(exitLong1 or exitLong2)
strategy.close("Buy" , when = exitLong1 or exitLong2)

// exitShort1 = EMA_Fast > EMA_Medium
// //exitShort2 = ta.crossover(vrsi , mediumLine)
// exitShort2 = ta.crossunder (vrsi,mediumLine)
// strategy.close("Short" , when = exitShort1 or exitShort2)
// //shortCondition = cu


// //if (shortCondition1 and shortCondition2)
//     //strategy.entry("My Short Entry Id", strategy.short)
Published by ChaoZhang on the FMZ strategy square · last modified 2023-10-25. Collected in the Quant Trading Vault. Unvalidated research: re-test with your own data and costs before trusting it.
Build this with AgenKit
A spec is not a trading system. Paste this into your coding agent and AgenKit runs a specialist team — architecture, test-first build, risk gates, review — with paper trading on by default.
/agenkit build a production-grade trading bot with a backtest engine, risk controls and paper trading by default from strategies/RSI-EMA-Crossover-Strategy.md- npx agenkit install engineering-kit in your project
- Paste the command into your agent and approve each phase
- Get tests, backtest, risk controls and a paper-trading switch
Understand it first
Before you run this, read the lesson behind the idea and how to backtest it honestly. Specs like this one are the survivors of an unknown number of trials; deflate their results accordingly.
Related specs
- Bollinger Bands and RSI Trend Following StrategyPine Script · Trend following · 1h
- EMA and RSI Trend Trading StrategyPine Script · Trend following · 1d
- Incremental Order Size Fibonacci Retracement Trend Following StrategyPine Script · Trend following · 1d
- Multi Indicator Trend Following Strategy with Dynamic Risk ManagementPine Script · Trend following · 2h
- Dynamic Moving Average Trend Crossover StrategyPine Script · Trend following · 1d
- Multi Technical Indicator Moving Average Crossover Trend Following Quantitative Trading StrategyPine Script · Trend following · 1h