Strategy vault / Trend following
RSI Rising Crypto Trending Strategy
The RSI Rising Crypto Trending Strategy is a trend trading strategy designed for longer timeframes (4h+) in crypto and stock markets. It utilizes RSI to identify rising and falling trends combined with Bollinger…
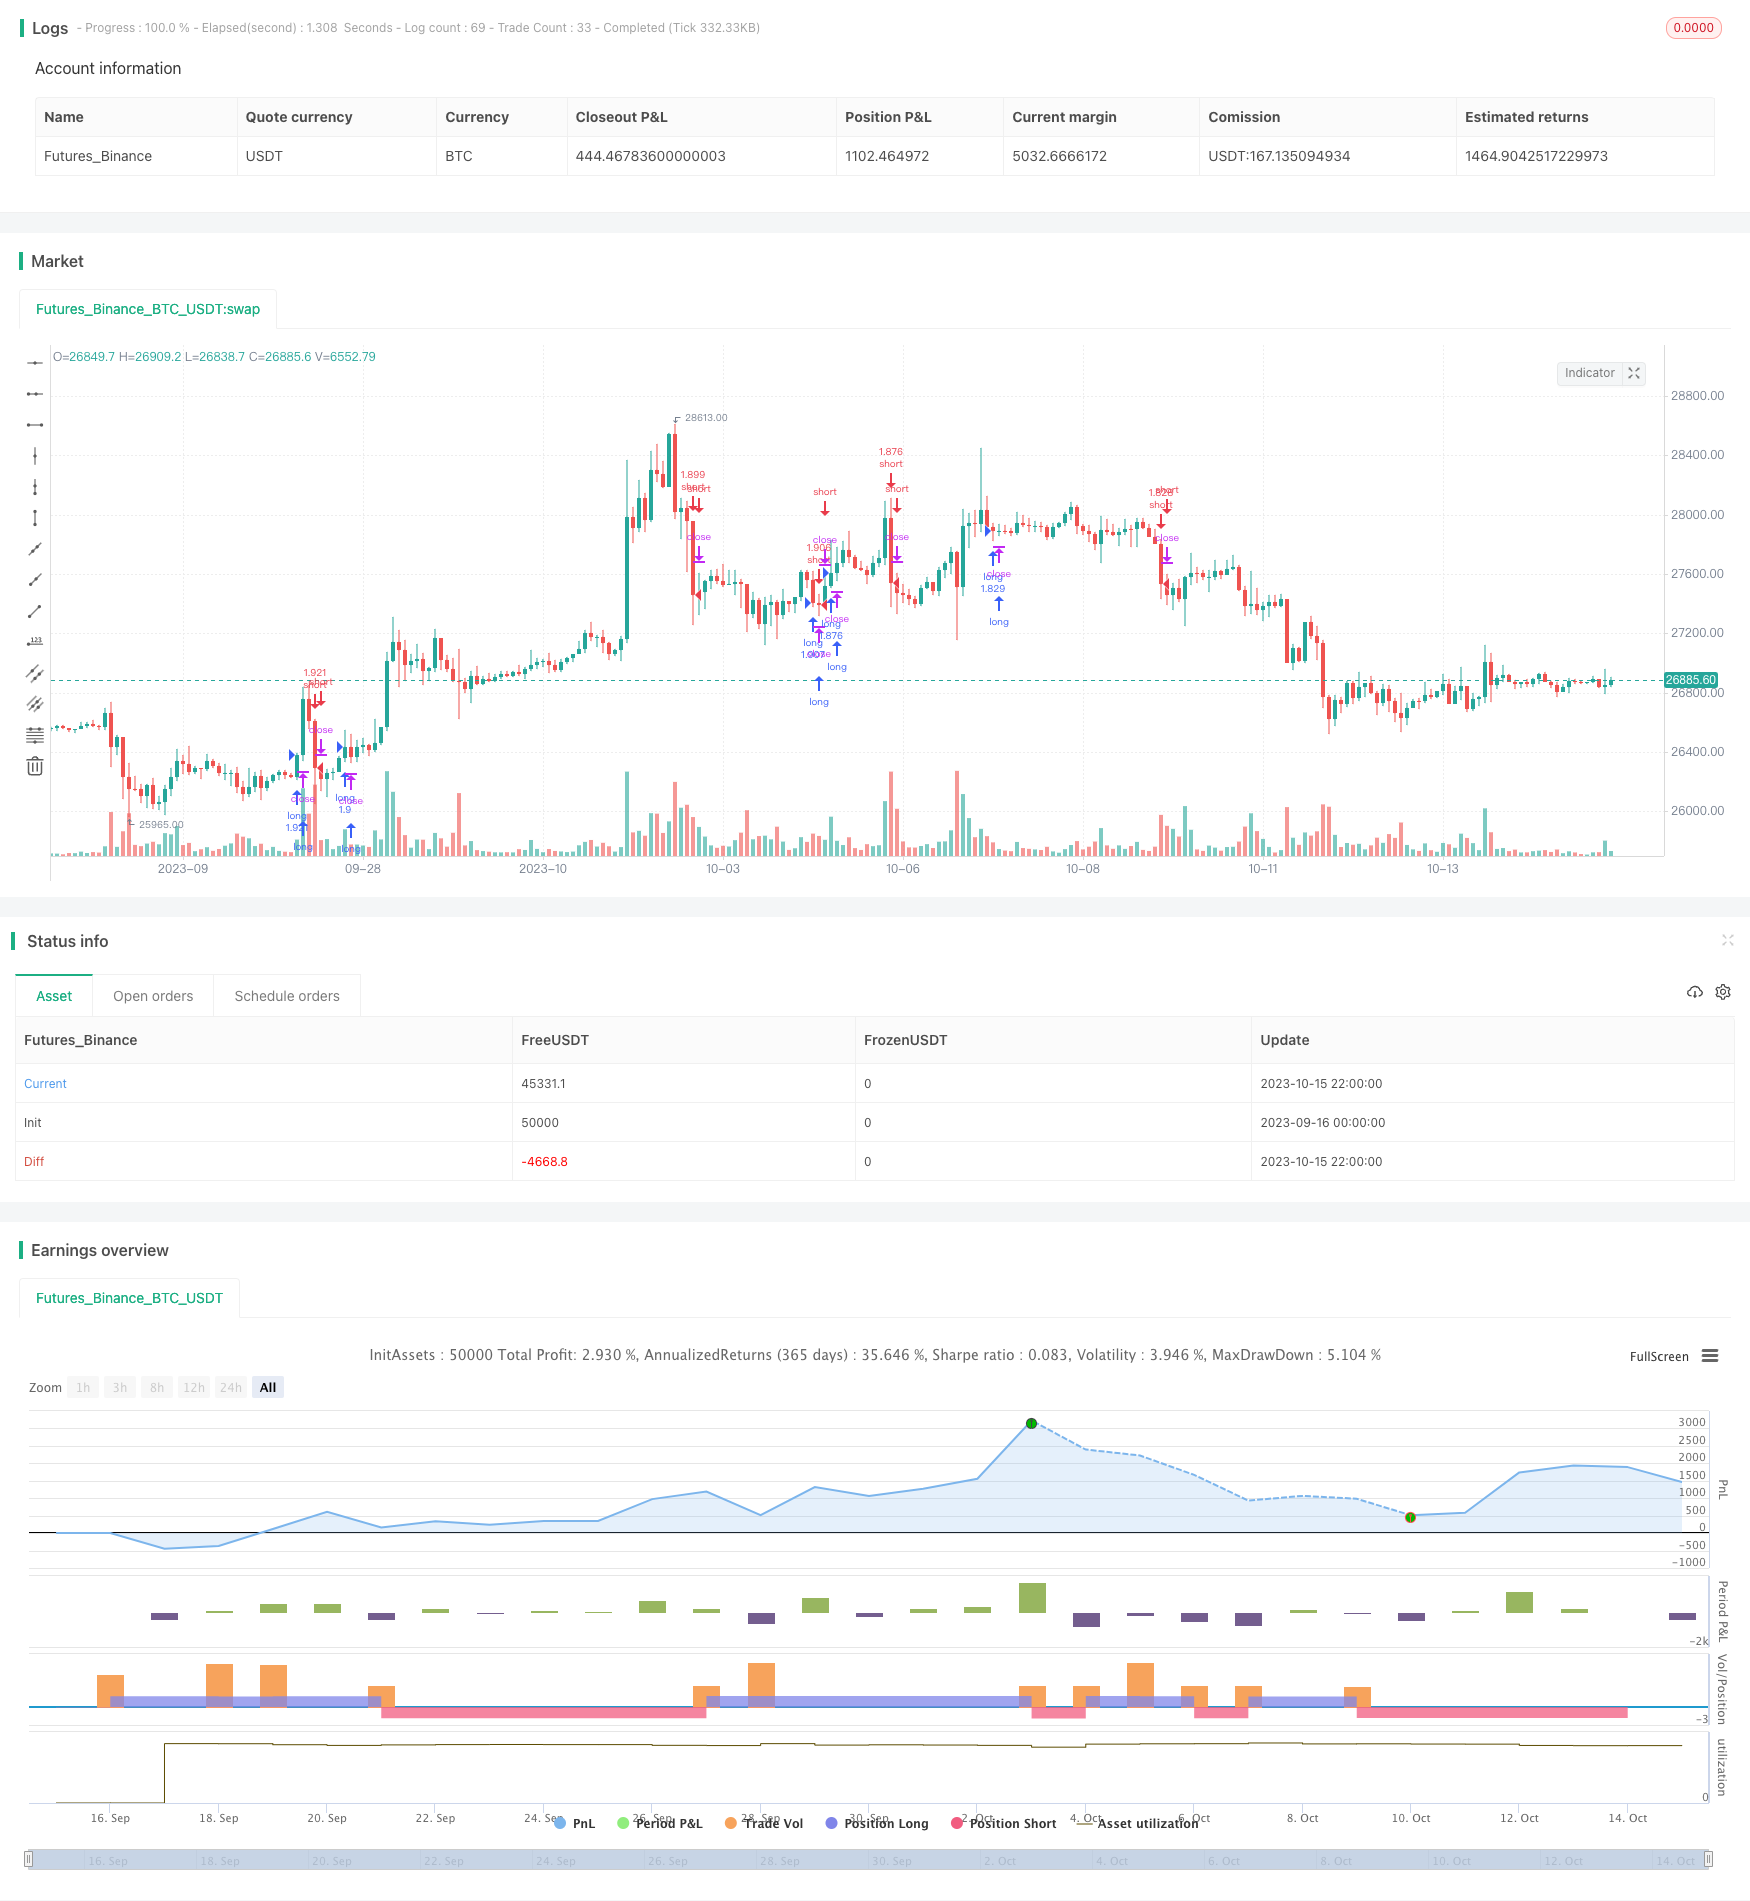
Overview
The RSI Rising Crypto Trending Strategy is a trend trading strategy designed for longer timeframes (4h+) in crypto and stock markets.
It utilizes RSI to identify rising and falling trends combined with Bollinger Bands and ROC to avoid trading in sideways markets. From tests, it appears to work better trading crypto against crypto rather than against fiat.
Strategy Logic
The strategy uses the following indicators:
- RSI - To identify rising/falling trends
- Bollinger Bands - To identify sideways markets
- ROC - To confirm trend direction
The specific trading rules are:
Entry Rules
Long entry: RSI rising AND not sideways market per BB and ROC Short entry: RSI falling AND not sideways market per BB and ROC
Exit Rules
Exit when opposite signal is triggered
Advantage Analysis
- Captures trend turning points early using RSI
- Avoids getting trapped in sideways markets using BB
- ROC confirms trend direction for more robust signals
- Good for longer timeframe trades and capturing trends
- Better for crypto/crypto pairs to avoid fiat exposure
Risk Analysis
- No stop loss so high risk of large losses
- Poor BB and ROC parameters could lead to missed trades or bad signals
- Purely technical so misses major black swan events
Increase stop loss, optimize BB/ROC parameters, and incorporate fundamental analysis.
Enhancement Opportunities
Some ways this strategy could be improved:
Add stop loss for risk management and setting maximum loss per trade.
Optimize BB and ROC parameters through backtesting to find best settings.
Incorporate additional indicators like MACD, KD for multi-indicator signal reliability.
Build a liquidity model to pause trading during volatility spikes to avoid traps.
Use machine learning to automatically optimize parameters and signal weighting.
Incorporate on-chain data like exchange liquidity and fund flows for greater adaptability.
Summary
The RSI Rising Crypto Trend Strategy captures longer timeframe crypto trends using RSI plus BB and ROC. The advantage is quickly catching trend reversals and avoiding traps. The weaknesses are no stop loss and parameter dependency. Enhancements like stop loss, optimization, machine learning can make it more robust.
Parameters
| Name | Default | What it controls |
|---|---|---|
| v_input_1 | true | From Day |
| v_input_2 | true | From Month |
| v_input_3 | 2010 | From Year |
| v_input_4 | 31 | To Day |
| v_input_5 | 12 | To Month |
| v_input_6 | 2021 | To Year |
| v_input_7 | 19 | periods |
| v_input_8 | 14 | RSI Length |
| v_input_9_low | 0 | Source: low | high | close | open | hl2 | hlc3 | hlcc4 | ohlc4 |
Source Pine Script
/*backtest
start: 2023-09-16 00:00:00
end: 2023-10-16 00:00:00
period: 2h
basePeriod: 15m
exchanges: [{"eid":"Futures_Binance","currency":"BTC_USDT"}]
*/

// This source code is subject to the terms of the Mozilla Public License 2.0 at https://mozilla.org/MPL/2.0/
// © exlux99

//@version=4
strategy(title = "RSI Rising", overlay = true, initial_capital = 100, default_qty_type= strategy.percent_of_equity, default_qty_value = 100, slippage=0,commission_type=strategy.commission.percent,commission_value=0.03)

/////////////////////
source          = close
bb_length       = 20
bb_mult         = 1.0
basis           = sma(source, bb_length)
dev             = bb_mult * stdev(source, bb_length)
upperx           = basis + dev
lowerx           = basis - dev
bbr             = (source - lowerx)/(upperx - lowerx)
bbr_len         = 21
bbr_std         = stdev(bbr, bbr_len)
bbr_std_thresh  = 0.1
is_sideways     = (bbr > 0.0 and bbr < 1.0) and bbr_std <= bbr_std_thresh


////////////////
fromDay = input(defval = 1, title = "From Day", minval = 1, maxval = 31)
fromMonth = input(defval = 1, title = "From Month", minval = 1, maxval = 12)
fromYear = input(defval = 2010, title = "From Year", minval = 1970)
 //monday and session
// To Date Inputs
toDay = input(defval = 31, title = "To Day", minval = 1, maxval = 31)
toMonth = input(defval = 12, title = "To Month", minval = 1, maxval = 12)
toYear = input(defval = 2021, title = "To Year", minval = 1970)

startDate = timestamp(fromYear, fromMonth, fromDay, 00, 00)
finishDate = timestamp(toYear, toMonth, toDay, 00, 00)
time_cond = true


sourcex = close
length = 2
pcntChange = 1

roc = 100 * (sourcex - sourcex[length])/sourcex[length]
emaroc = ema(roc, length/2)
isMoving() => emaroc > (pcntChange / 2) or emaroc < (0 - (pcntChange / 2))


periods = input(19)
smooth = input(14, title="RSI Length" )
src = input(low, title="Source" )


rsiClose = rsi(ema(src, periods), smooth)
long=rising(rsiClose,2) and not is_sideways and isMoving()
short=not rising(rsiClose,2) and not is_sideways and isMoving()


if(time_cond)
    strategy.entry('long',1,when=long)
    strategy.entry('short',0,when=short)
Published by ChaoZhang on the FMZ strategy square · last modified 2023-10-17. Collected in the Quant Trading Vault. Unvalidated research: re-test with your own data and costs before trusting it.
Build this with AgenKit
A spec is not a trading system. Paste this into your coding agent and AgenKit runs a specialist team — architecture, test-first build, risk gates, review — with paper trading on by default.
/agenkit build a production-grade trading bot with a backtest engine, risk controls and paper trading by default from strategies/RSI-Rising-Crypto-Trending-Strategy.md- npx agenkit install engineering-kit in your project
- Paste the command into your agent and approve each phase
- Get tests, backtest, risk controls and a paper-trading switch
Understand it first
Before you run this, read the lesson behind the idea and how to backtest it honestly. Specs like this one are the survivors of an unknown number of trials; deflate their results accordingly.
Related specs
- Bollinger Bands and RSI Trend Following StrategyPine Script · Trend following · 1h
- EMA and RSI Trend Trading StrategyPine Script · Trend following · 1d
- Multi Indicator Trend Following Strategy with Dynamic Risk ManagementPine Script · Trend following · 2h
- Dynamic Moving Average Trend Crossover StrategyPine Script · Trend following · 1d
- Multi Technical Indicator Moving Average Crossover Trend Following Quantitative Trading StrategyPine Script · Trend following · 1h
- Moving Vegas Channel Crossover StrategyPine Script · Trend following · 1d