Strategy vault / Mean reversion
RSI Trend Reversal Strategy
The RSI Trend Reversal Strategy is a quantitative trading strategy based on the Relative Strength Index (RSI) and Average True Range (ATR). It dynamically adjusts the take profit and stop loss (TP/SL) levels to adapt…
Overview
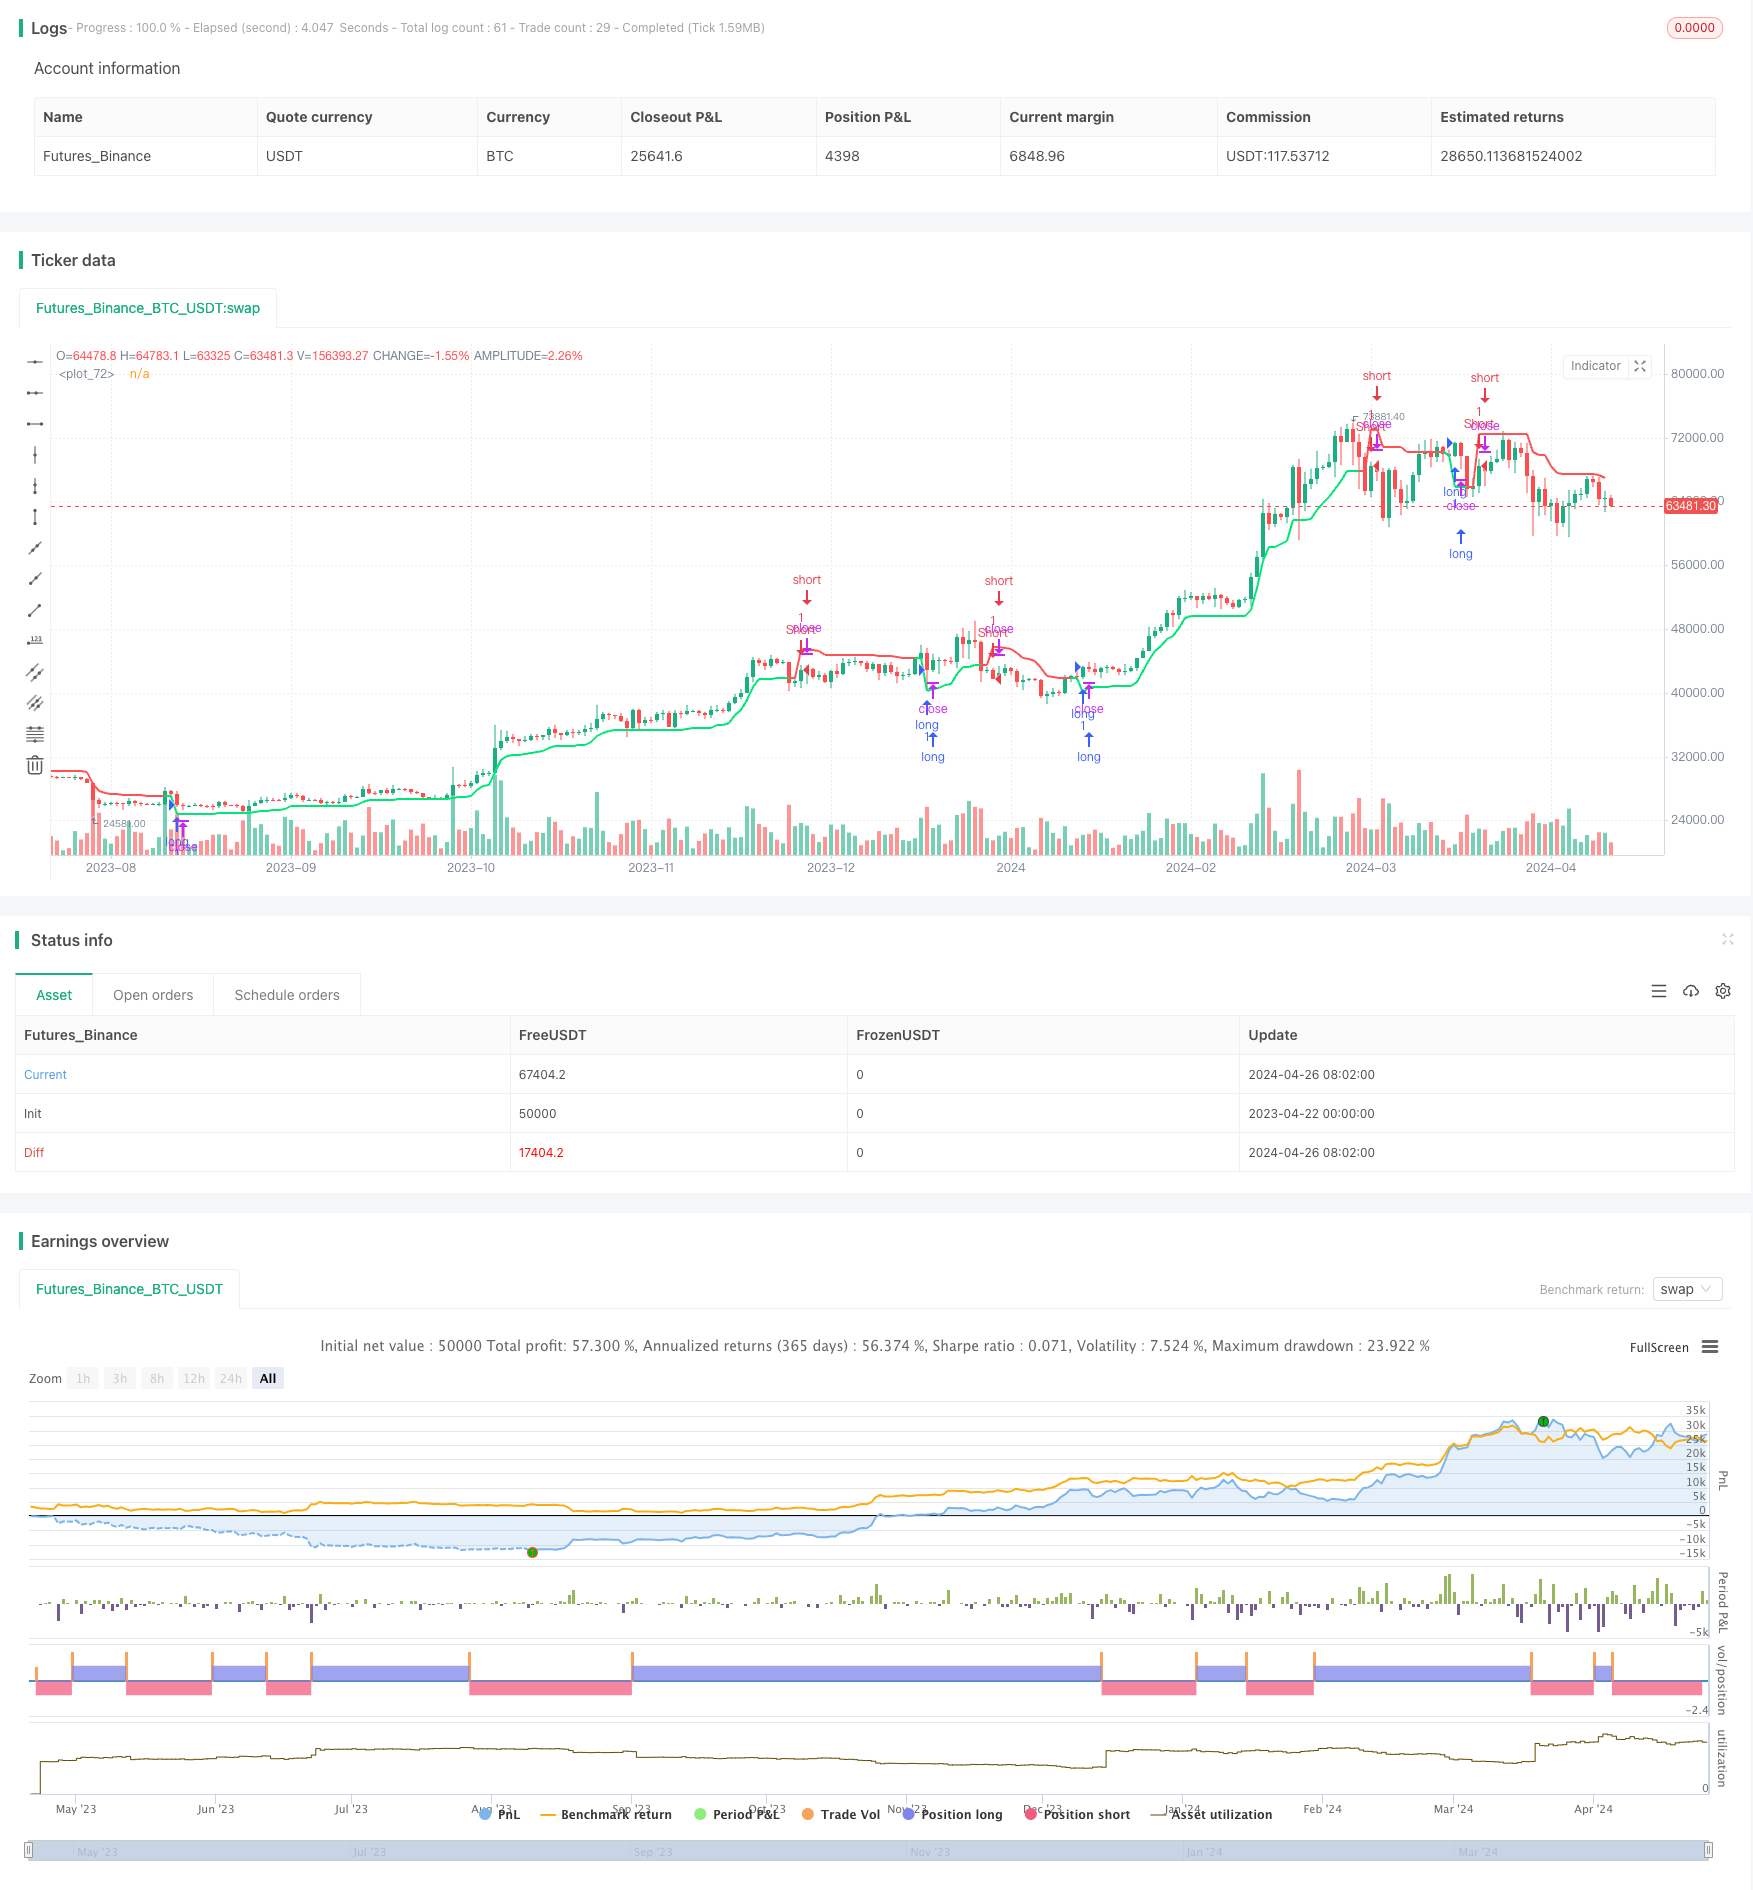
The RSI Trend Reversal Strategy is a quantitative trading strategy based on the Relative Strength Index (RSI) and Average True Range (ATR). It dynamically adjusts the take profit and stop loss (TP/SL) levels to adapt to rapid market fluctuations and capture trend reversal opportunities. The strategy centers around the RSI, combined with ATR to measure volatility, and constructs two adaptive dynamic bands as the basis for opening and closing positions. This strategy can be used independently or as a take profit and stop loss module for other strategies. It has been well-tested on 15-minute data of stocks such as Tesla (TSLA), Apple (AAPL), and Nvidia (NVDA).
Strategy Principle
The core of the RSI Trend Reversal Strategy lies in the construction of dynamic TP/SL bands. First, it uses custom highest_custom and lowest_custom functions to find the highest and lowest prices since the last crossover, forming the basis of the bands. Then, it calculates the RSI and ATR with a length specified by the user and performs the following calculations:
- Lower Band = Highest Price × [1 - (ATR/Price + 1/(RSI Lower Band × multiplier))]
- Upper Band = Lowest Price × [1 + (ATR/Price + 1/(RSI Upper Band × multiplier))]
Here, multiplier is a user-defined band expansion factor. If the price breaks above the upper band, it goes long; if it breaks below the lower band, it goes short. The colors of these two bands also change according to the position of the price relative to the bands, making it easy to observe.
Strategy Advantages
- High adaptability: The TP/SL bands can automatically adjust based on price volatility, promptly responding to market changes.
- Adjustable parameters: By adjusting parameters such as length and multiplier, the sensitivity of the strategy can be flexibly controlled.
- Clear logic: The code structure is reasonable and easy to understand and develop further.
- Wide applicability: It can be used independently as a strategy or add TP/SL functionality to other strategies.
- Computational efficiency: By using custom functions like highest_custom, it avoids the massive repetitive calculations caused by using series types.
Strategy Risks
- Improper parameter selection may bring additional risks. For example, a small length may lead to frequent trading, and a large multiplier may lead to overly loose stop losses.
- Performance may be poor in specific market conditions, such as frequent consolidation and false breakouts in a volatile market, which may result in more losing trades.
- The strategy itself does not have a trend judgment function and needs to be used in combination with other signals.
Strategy Optimization Directions
- Consider adding trend indicators, such as moving averages, to only trade at reversal points in the direction of the major trend.
- Optimize parameters to find the best combination of length, multiplier, etc.
- Combine with other technical indicators or market sentiment indicators to improve the accuracy of entry and exit points.
- Add position management to strictly control the risk exposure of each trade.
Summary
The RSI Trend Reversal Strategy utilizes RSI and ATR to construct adaptive bands that can dynamically adjust TP/SL points and promptly respond to market changes. The strategy has clear logic, wide applicability, and can be a powerful tool for quantitative traders. However, in practical use, attention still needs to be paid to parameter selection and risk control, and it is recommended to use it in combination with other indicator signals to improve overall performance. The strategy has further room for optimization, such as adding trend filters and parameter optimization. Overall, the RSI Trend Reversal Strategy provides a simple yet effective approach to quantitative trading.
Parameters
| Name | Default | What it controls |
|---|---|---|
| v_input_int_1 | 8 | Lenght |
| v_input_float_1 | 1.5 | Multiplier |
| v_input_int_2 | true | Delay to prevent idealization |
| v_input_float_2 | 10 | Minimum Difference |
| v_input_source_1_close | 0 | Source Input: close | high | low | open | hl2 | hlc3 | hlcc4 | ohlc4 |
Source Pine Script
/*backtest
start: 2023-04-22 00:00:00
end: 2024-04-27 00:00:00
period: 1d
basePeriod: 1h
exchanges: [{"eid":"Futures_Binance","currency":"BTC_USDT"}]
*/

//@version=5
strategy("RSI Trend Reversal", overlay=true, max_bars_back = 4999, calc_on_every_tick = false)


//INPUTS
rsi_length = input.int(title = "Lenght", defval = 8)
rsi_mult = input.float(title = "Multiplier", defval = 1.5, step = .05)
lookback = input.int(title = "Delay to prevent idealization", defval = 1)
sltp = input.float(title = "Minimum Difference", defval = 10)
src = input.source(title = "Source Input", defval = close)

//PARAMETERS INITILIZATION
hclose = request.security(ticker.heikinashi(syminfo.tickerid), timeframe.period, src)
//FUNCTION INITILIZATION
highest_custom(src, length) =>
    x = src
    for i = 0 to length
        if src[i] > x
            x := src[i]
    x
lowest_custom(src, length) =>
    x = src
    for i = 0 to length
        if src[i] < x
            x := src[i]
    x
rsilev(src, length, mult, sltp) =>
    sl = (100 - sltp) / 100
    tp = (100 + sltp) / 100
    var bool crossup = na
    var bool crossdown = na
    var float dir = na
    dir_change = ta.change(dir)
    var float BearGuy = 0
    BullGuy = ta.barssince(crossup or crossdown)
    if na(BullGuy)
        BearGuy += 1
    else
        BearGuy := BullGuy
    var float upper = na
    var float lower = na
    rsilower = ta.rsi(src, length)
    rsiupper = math.abs(ta.rsi(src, length) - 100)
    atr = ta.atr(length) / src
    lower := highest_custom(math.max(highest_custom(highest_custom(src, BearGuy) * (1 - (atr + ((1 / (rsilower) * mult)))), BearGuy), src * sl), BearGuy)
    upper := lowest_custom(math.min(lowest_custom(lowest_custom(src, BearGuy) * (1 + (atr + ((1 / (rsiupper) * mult)))), BearGuy), src * tp), BearGuy)
    var float thresh = na
    if na(thresh)
        thresh := lower
    if na(dir)
        dir := 1
    if crossdown
        dir := -1
    if crossup
        dir := 1
    if dir == 1
        thresh := lower
    if dir == -1
        thresh := upper
    crossup := ta.crossover(src, thresh)
    crossdown := ta.crossunder(src, thresh)
    thresh

rsiclose = rsilev(hclose, rsi_length, rsi_mult, sltp)

//PLOTTING
var color col = color.lime
if hclose > rsiclose
    col := color.lime
if hclose < rsiclose
    col := color.red
plot(rsiclose, linewidth = 2, color = col)

//STRATEGY
buy = ta.crossover(hclose, rsiclose)
sell = ta.crossunder(hclose, rsiclose)

if buy[lookback]
    strategy.entry("long", strategy.long)
if sell[lookback]
strategy.entry("Short", strategy.short)Published by ChaoZhang on the FMZ strategy square · last modified 2024-04-28. Collected in the Quant Trading Vault. Unvalidated research: re-test with your own data and costs before trusting it.
Build this with AgenKit
A spec is not a trading system. Paste this into your coding agent and AgenKit runs a specialist team — architecture, test-first build, risk gates, review — with paper trading on by default.
/agenkit build a production-grade trading bot with a backtest engine, risk controls and paper trading by default from strategies/RSI-Trend-Reversal-Strategy.md- npx agenkit install engineering-kit in your project
- Paste the command into your agent and approve each phase
- Get tests, backtest, risk controls and a paper-trading switch
Understand it first
Before you run this, read the lesson behind the idea and how to backtest it honestly. Specs like this one are the survivors of an unknown number of trials; deflate their results accordingly.
Related specs
- ATR and EMA based Dynamic Take Profit and Stop Loss Adaptive StrategyPine Script · Mean reversion · 1h
- VAWSI and Trend Persistence Reversal Strategy with Dynamic Length Calculation Multi Indicator Analysis SystemPine Script · Mean reversion · 1h
- Advanced Fibonacci Retracement Trend Following and Reversal Trading StrategyPine Script · Mean reversion · 3h
- Advanced Momentum EMA Trend Following with RSI Overbought Oversold Trading StrategyPine Script · Mean reversion · 1d
- Advanced Strategy with Volume and Price Pullback Multiple Take ProfitPine Script · Mean reversion · 1h
- BuySell Strategy depends on AOStochRSIATRPine Script · Mean reversion · 30m