Strategy vault / Mean reversion
RSI2 Strategy Intraday Reversal Win Rate Backtest
This strategy is based on the oversold signal of the Relative Strength Index (RSI) indicator, buying at the intraday low and then setting a fixed percentage of take-profit and stop-loss to backtest the probability of…
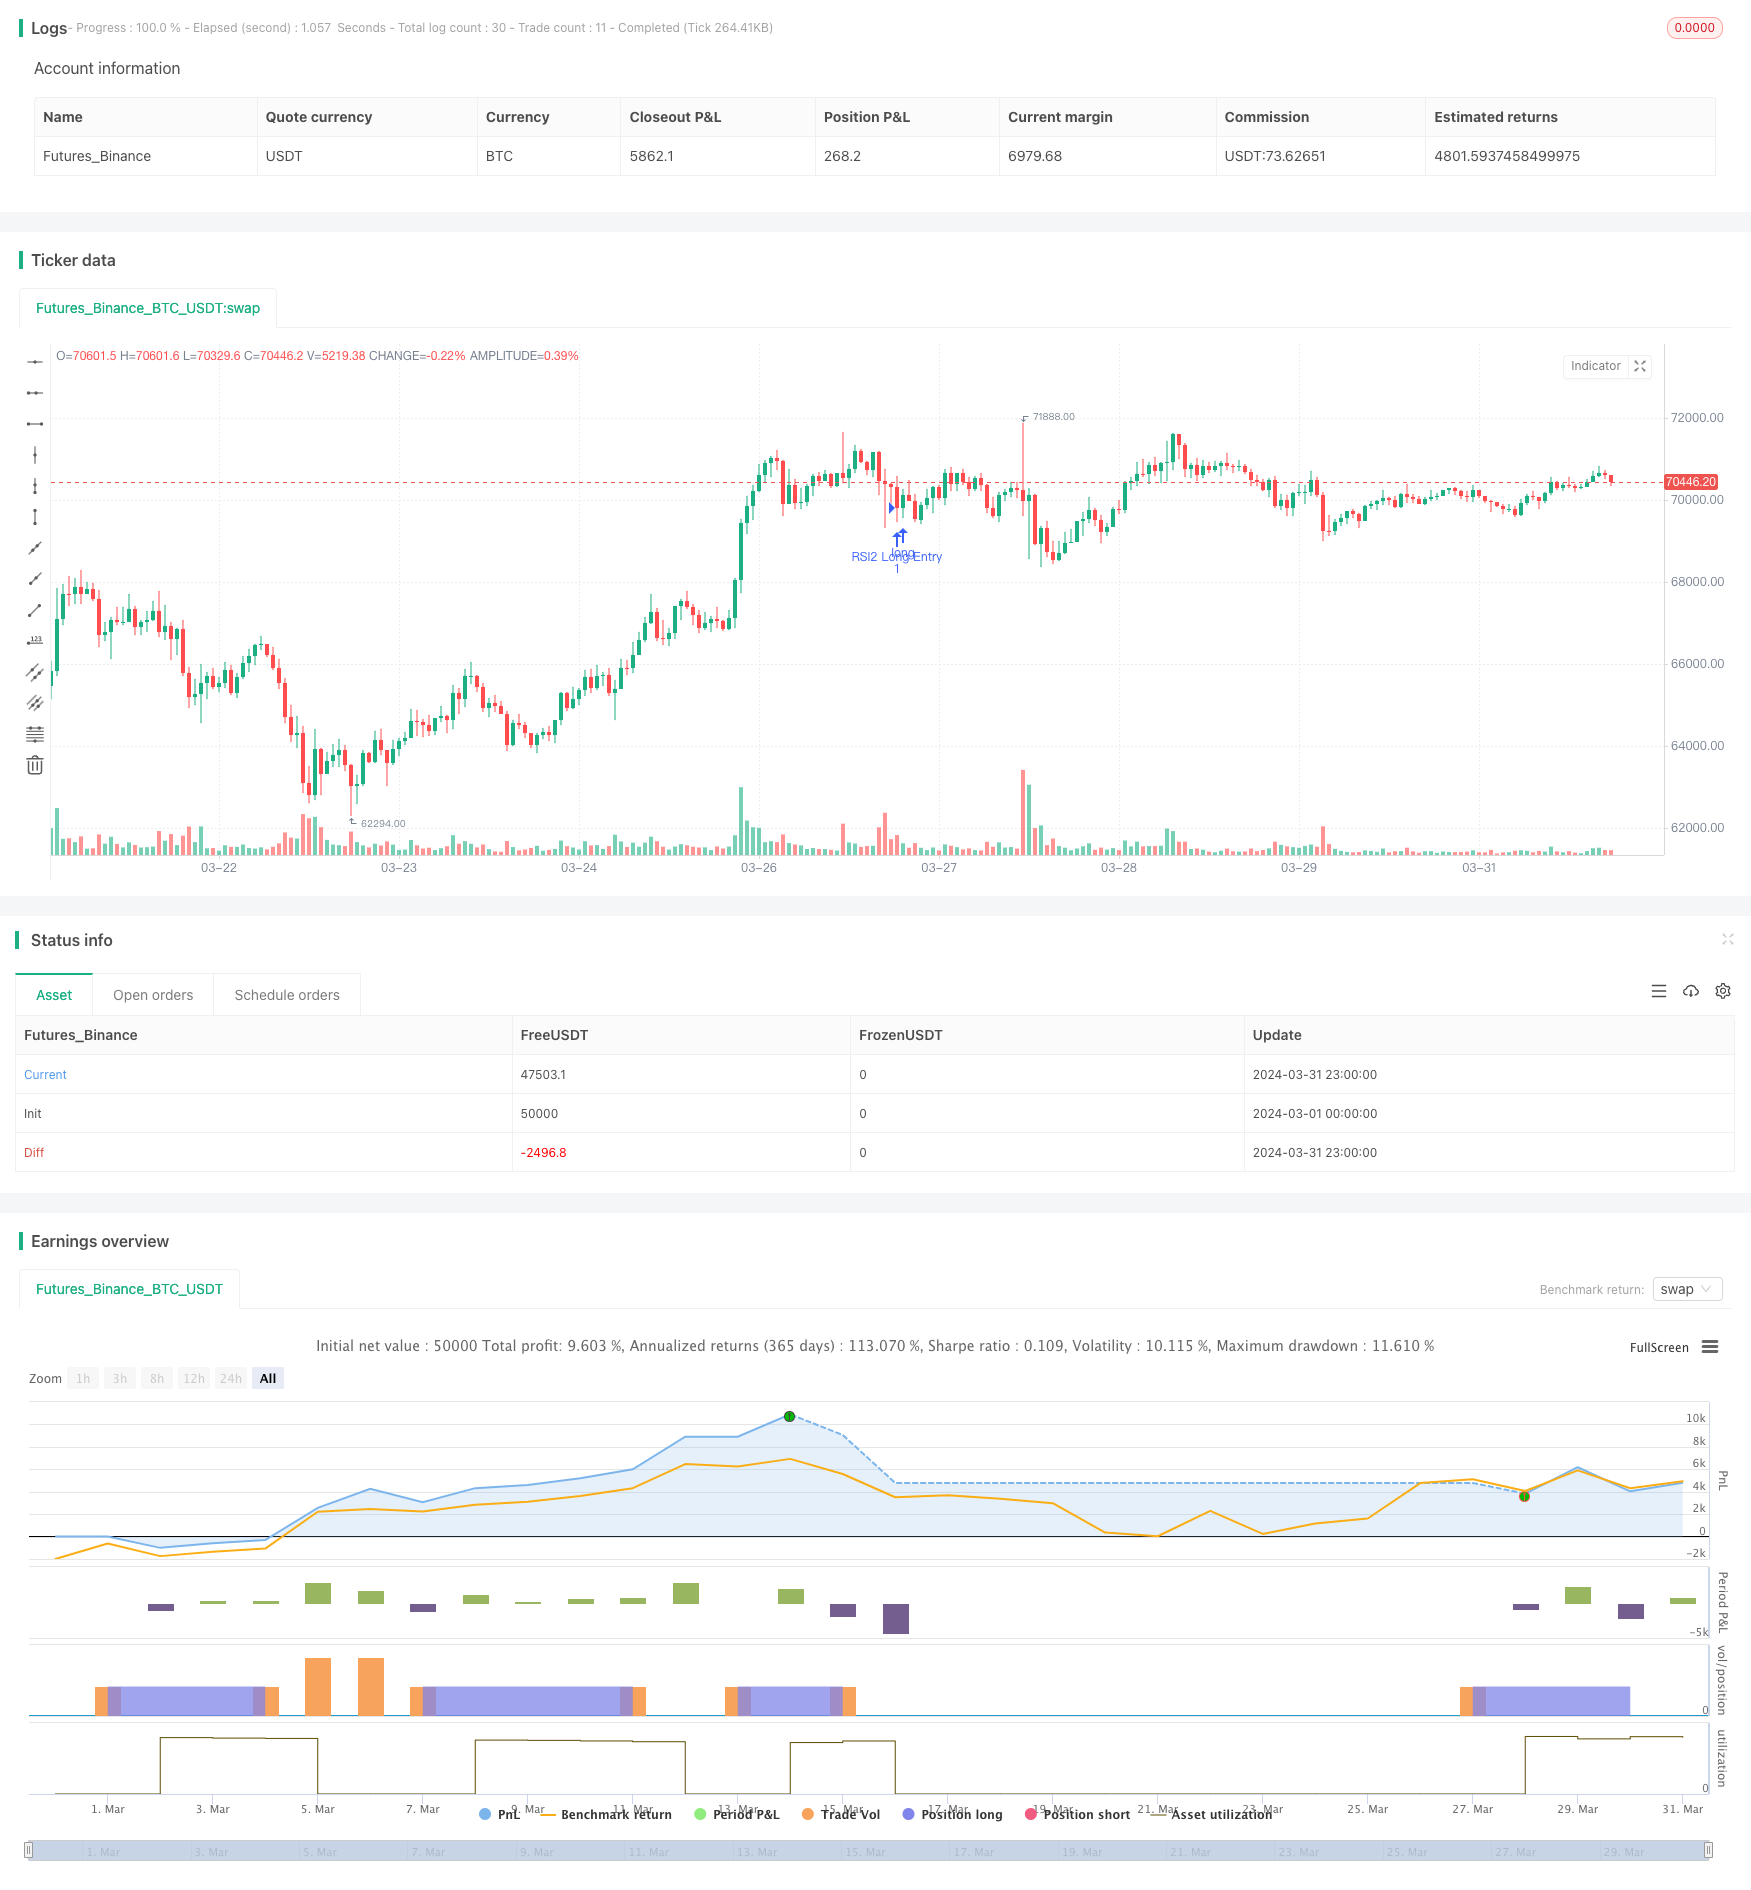
Overview
This strategy is based on the oversold signal of the Relative Strength Index (RSI) indicator, buying at the intraday low and then setting a fixed percentage of take-profit and stop-loss to backtest the probability of the strategy hitting the take-profit and stop-loss. The main idea is to take advantage of the reversal opportunity when the RSI indicator is oversold, enter at the intraday low, and seek short-term profits brought by the reversal. At the same time, it uses a moving average to filter the trend and only goes long when the price is above the moving average.
Strategy Principle
- Calculate the 2-period RSI indicator and the 200-period simple moving average
- When the closing price is higher than the moving average and the RSI is lower than the oversold threshold (default 10), buy at the opening of the next trading day
- Record the lowest price of the day of buying as the entry price
- Calculate 6% take-profit price and 3% stop-loss price based on the entry price
- On the next trading day, if the take-profit price is hit, close the position for profit; if the stop-loss price is hit, close the position for loss
- Count the number of take-profits and stop-losses, and calculate the win rate of the strategy within the set period
Advantage Analysis
- Buy at intraday low to capture the reversal gains after the RSI indicator oversold
- Fixed percentage take-profit and stop-loss to control single transaction risk
- Use long-cycle moving average to filter and reduce counter-trend trading
- Simple and easy to use, flexible parameter settings, suitable for short-term traders
Risk Analysis
- RSI oversold does not guarantee a necessary reversal, the market may continue to fall under extreme conditions
- Fixed percentage take-profit and stop-loss may not cover transaction costs
- The entry point is based on the intraday lowest price, which is difficult to buy precisely at the lowest point in actual operation
- Lack of trend judgment, simply relying on overbought and oversold signals, the return ratio may not be high
Optimization Direction
- Use adaptive take-profit and stop-loss, dynamically adjust according to indicators such as price volatility
- Add trend confirmation indicators, such as MACD, DMI, etc., to avoid counter-trend trading
- Optimize entry points, such as using variable distance turtle trading rules
- Increase position management to improve capital utilization and return rate
- Combine with other short-cycle indicators to improve signal confirmation, such as Bollinger Bands, KDJ, etc.
Summary
The RSI2 strategy attempts to capture intraday reversal opportunities after the RSI indicator is oversold, and controls risk by setting a fixed percentage of take-profit and stop-loss, while using a long-period moving average to filter counter-trend signals. The strategy is simple and suitable for short-term speculative traders. However, it also has certain limitations, such as lack of trend judgment, difficulty in accurately buying at the lowest point, and fixed take-profit and stop-loss limits the profit potential. In the future, this strategy can be improved from aspects such as dynamic take-profit and stop-loss, combining trend indicators, optimizing entry points, and strengthening position management to enhance the systematicness and robustness, and better adapt to the changing market environment.
Parameters
| Name | Default | What it controls |
|---|---|---|
| v_input_int_1 | 2 | (?Indicators)RSI Length |
| v_input_float_1 | 10 | RSI Oversold |
| v_input_float_2 | 90 | RSI OverBrought |
| v_input_float_3 | 3 | Max Loss Percent |
| v_input_float_4 | 6 | Target Percent |
Source Pine Script
/*backtest
start: 2024-03-01 00:00:00
end: 2024-03-31 23:59:59
period: 1h
basePeriod: 15m
exchanges: [{"eid":"Futures_Binance","currency":"BTC_USDT"}]
*/

// This Pine Script™ code is subject to the terms of the Mozilla Public License 2.0 at https://mozilla.org/MPL/2.0/
// © rajk1987

//@version=5
strategy("RSI2 strategy Raj", overlay=true, margin_long=100, margin_short=100)

rsi_len = input.int( 2, title = "RSI Length",     group = "Indicators")
rsi_os  = input.float(10, title = "RSI Oversold", group = "Indicators")
rsi_ob  = input.float(90, title = "RSI OverBrought",   group = "Indicators")
max_los = input.float(3,title = "Max Loss Percent", group = "Indicators")
tar_per = input.float(6,title = "Target Percent",group = "Indicators")

//Get the rsi value of the stock
rsi = ta.rsi(close, rsi_len)
sma = ta.sma(close,200)
var ent_dat = 0
var tar = 0.0
var los = 0.0
var bp = 0.0

if ((close > sma) and (rsi < rsi_os))
    strategy.entry("RSI2 Long Entry", strategy.long,1)
    ent_dat := time(timeframe = timeframe.period)

if(ent_dat == time(timeframe = timeframe.period))
    bp := low //high/2 + low/2
    tar := bp * (1 + (tar_per/100))
    los := bp * (1 - (max_los/100))

if (time(timeframe = timeframe.period) > ent_dat)
    strategy.exit("RSI2 Exit", "RSI2 Long Entry",qty = 1, limit = tar, stop = los, comment_profit = "P", comment_loss = "L")

//plot(rsi,"RSI")
//plot(bp,"BP")
//plot(tar,"TAR")
//plot(los,"LOS")
Published by ChaoZhang on the FMZ strategy square · last modified 2024-04-29. Collected in the Quant Trading Vault. Unvalidated research: re-test with your own data and costs before trusting it.
Build this with AgenKit
A spec is not a trading system. Paste this into your coding agent and AgenKit runs a specialist team — architecture, test-first build, risk gates, review — with paper trading on by default.
/agenkit build a production-grade trading bot with a backtest engine, risk controls and paper trading by default from strategies/RSI2-Strategy-Intraday-Reversal-Win-Rate-Backtest.md- npx agenkit install engineering-kit in your project
- Paste the command into your agent and approve each phase
- Get tests, backtest, risk controls and a paper-trading switch
Understand it first
Before you run this, read the lesson behind the idea and how to backtest it honestly. Specs like this one are the survivors of an unknown number of trials; deflate their results accordingly.
Related specs
- Intraday Single Candle Indicator Combo Short Term Trading StrategyPine Script · Mean reversion · 1d
- Johnys BOTPine Script · Mean reversion · 4h
- Multi factor Quantitative Trading Strategy 440526Pine Script · Mean reversion · 4h
- Advanced 15 Minute Chart Trading Signal StrategyPine Script · Mean reversion · 3h
- Multi Indicator Reversal Point Capture Trading StrategyPine Script · Mean reversion · 1d
- Reversal Trading Strategy with Bollinger Bands RSI ADX and ATRPine Script · Mean reversion · 1h