Strategy vault / Machine learning
SAR Alternating Timeframe Trading Strategy
This strategy is based on the alternating operations of the SAR indicator across different timeframes. The strategy calculates the SAR indicator in 15-minute, daily, weekly and monthly timeframes, and trades in the…
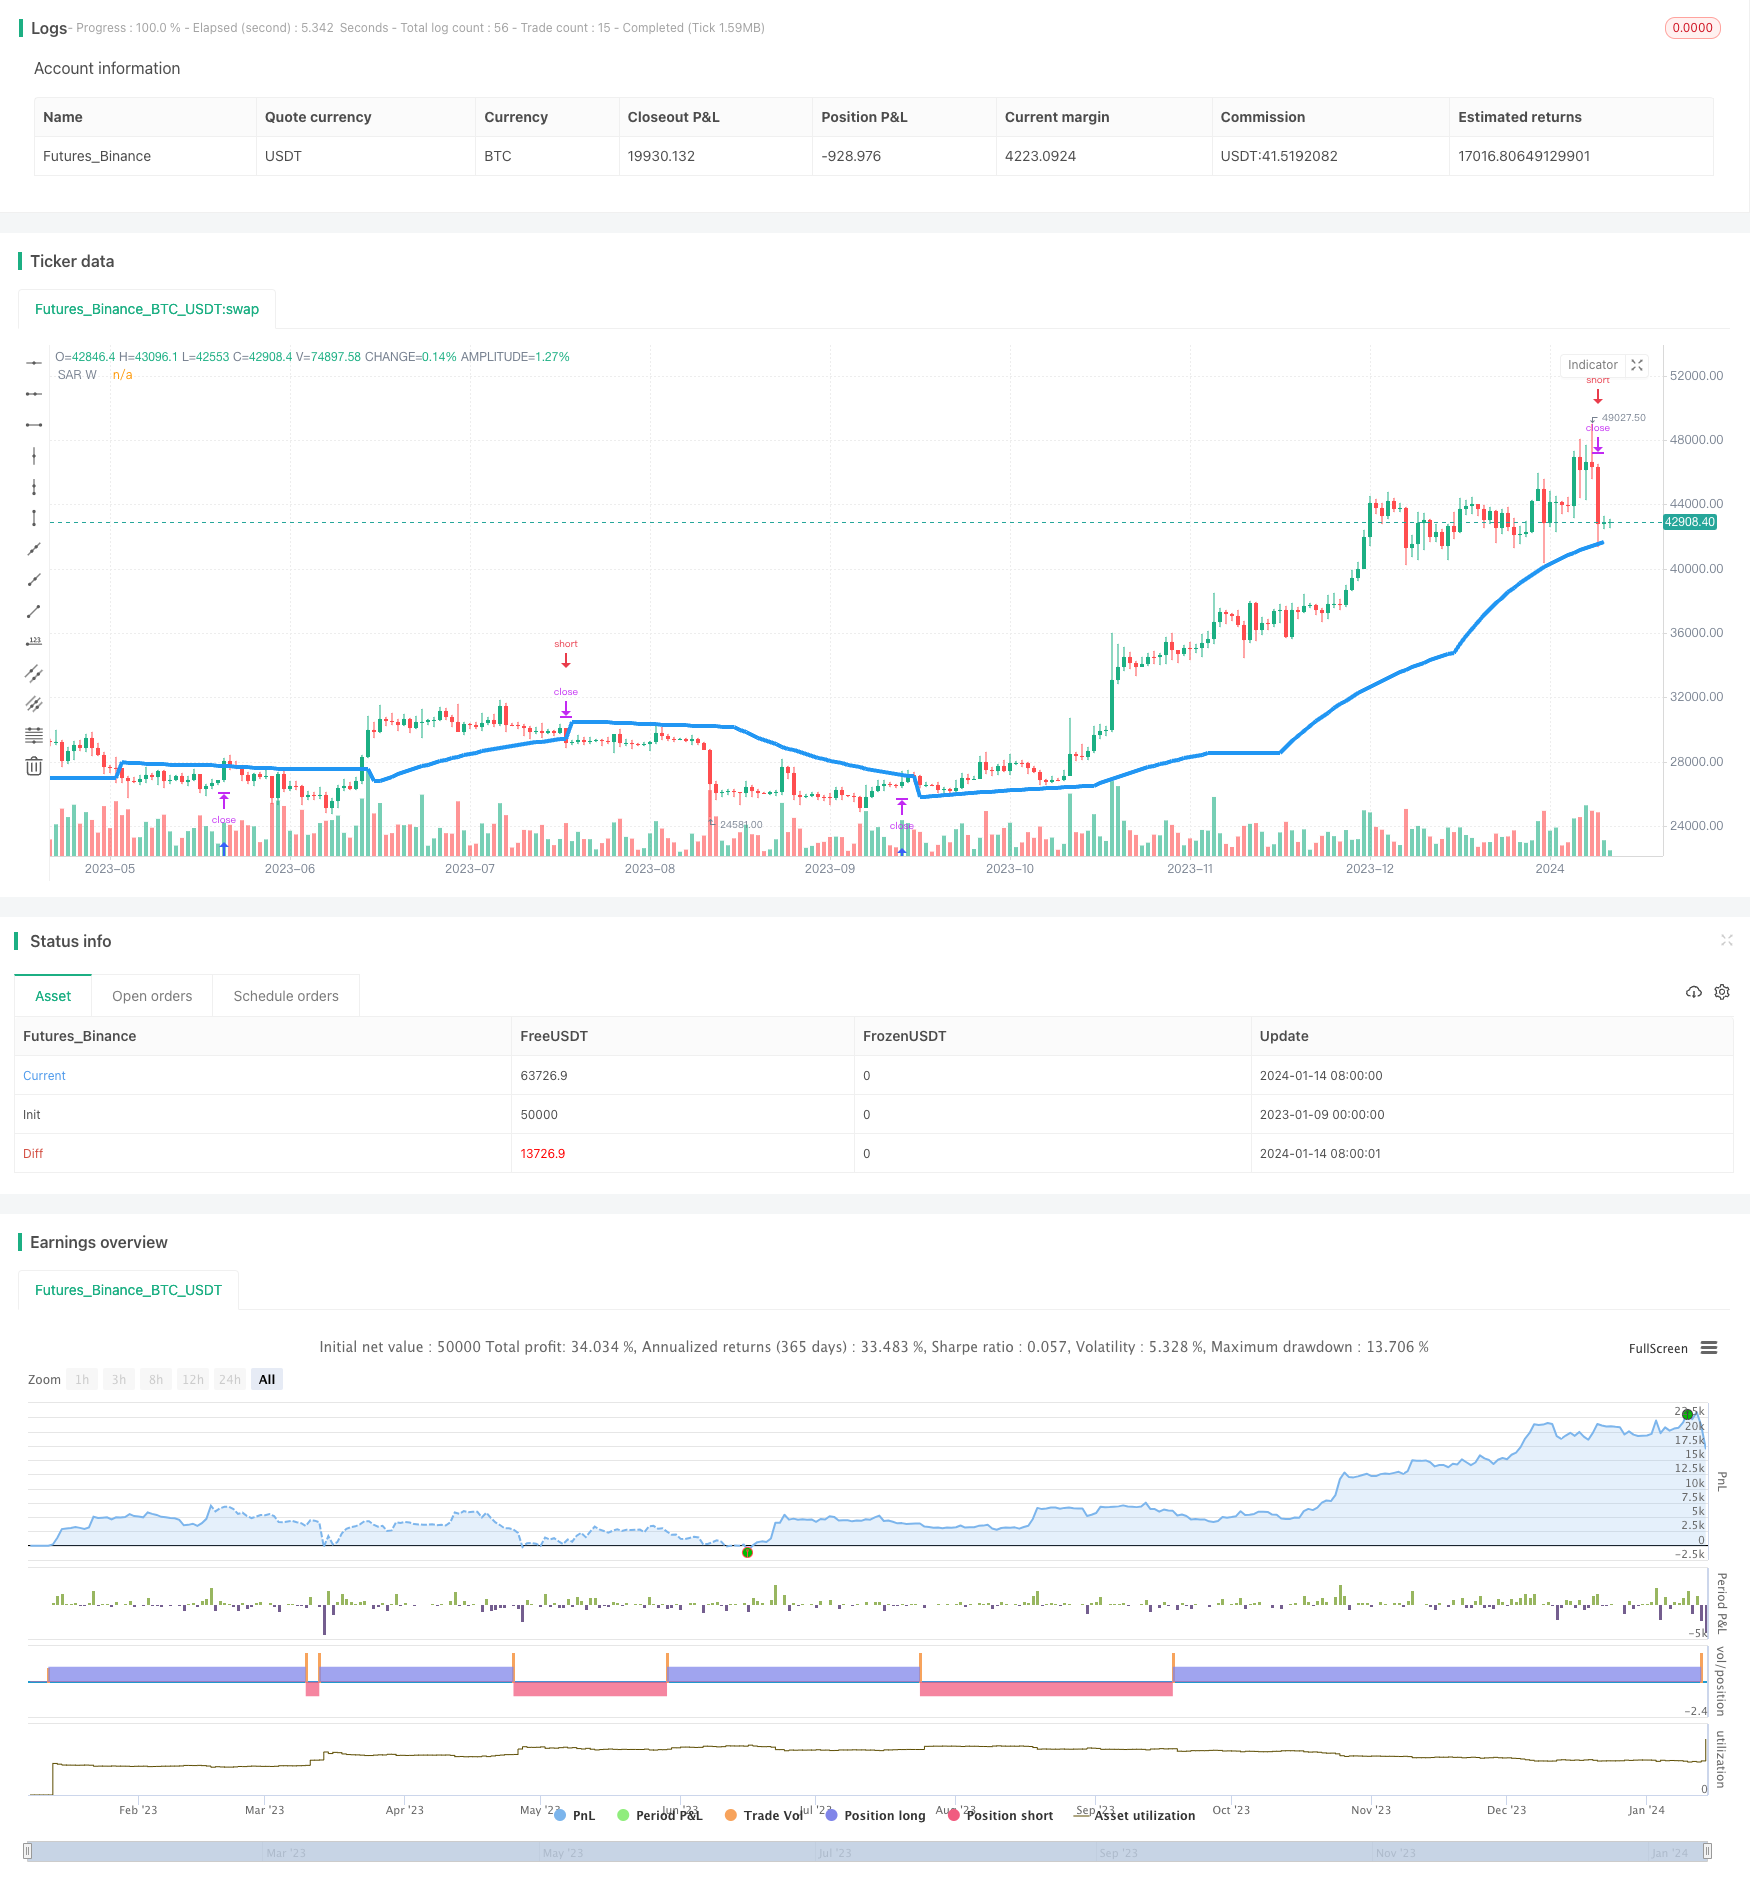
Overview
This strategy is based on the alternating operations of the SAR indicator across different timeframes. The strategy calculates the SAR indicator in 15-minute, daily, weekly and monthly timeframes, and trades in the weekly timeframe. It goes long when the weekly SAR crosses above the highest price and goes short when crossing below the lowest price.
Principles
SAR Indicator Calculation
The Parabolic SAR (SAR) indicator represents parabolic SAR, which judges the trend direction by calculating the relationship between the current price and historical prices. When the price breaks through the SAR point, it indicates a trend reversal.
This strategy calculates SAR values in 15-minute, daily, weekly and monthly timeframes, respectively. The formula is:
SAR = Previous SAR + Acceleration Factor * (Highest Price - Previous SAR) # Uptrend
SAR = Previous SAR + Acceleration Factor * (Lowest Price - Previous SAR) # Downtrend
The initial acceleration factor is set at 0.02, and will gradually increase up to a maximum of 0.2 as the trend extends.
Trading Strategy
The strategy generates trading signals in the weekly timeframe. It goes long when the weekly SAR crosses above the highest price, with SAR value as the stop loss. It goes short when SAR crosses below the lowest price, with SAR as the stop loss.
By determining the trend on a higher timeframe and setting a more precise stop loss level, the strategy aims to profit more efficiently.
Advantages
- SAR indicator accurately locates trend reversal points for entering the market
- Trading in higher timeframes follows the major trend
- Stop loss stuck to SAR effectively controls risks
Risks & Solutions
- SAR lag may cause trend to reverse after hitting stop loss. Solution is to allow wider stop loss distance.
- Acceleration factor may expand dramatically on huge trends, causing stop loss to be penetrated. Solution is to limit maximum factor size.
- Long drawdown periods during long cycles on higher timeframes. Solution is to reduce position sizes.
Improvement Areas
- Optimize entry conditions, e.g. combine with other indicators
- Enhance stop loss mechanisms, e.g. trailing stop loss, zone stop loss
- Refine position sizing rules, e.g. fixed fractional, dynamic adjustment
- Operate on even higher timeframes, e.g. quarterly, annually
- Dynamically optimize parameters via machine learning
Conclusion
The strategy has clear logic of riding trends on higher timeframes using SAR indicator to locate reversals and set stop loss. Entry signals and risk management could be further improved. With optimizations in areas like entries, stops and position sizing, it can become more stable and profitable.
Parameters
| Name | Default | What it controls |
|---|---|---|
| v_input_1 | 15 | Resolution |
| v_input_2 | D | Resolution |
| v_input_3 | W | Resolution |
| v_input_4 | M | Resolution |
Source Pine Script
/*backtest
start: 2023-01-09 00:00:00
end: 2024-01-15 00:00:00
period: 1d
basePeriod: 1h
exchanges: [{"eid":"Futures_Binance","currency":"BTC_USDT"}]
*/

//@version=2
strategy ("SAR alternating timeframe", overlay=true)

//resolution
res1=input("15", title="Resolution")
res2=input("D", title="Resolution")
res3=input("W", title="Resolution")
res4=input("M", title="Resolution")

//output functions
out = sar(0.02,0.02,0.2)

// request.security
SAR1 = request.security(syminfo.tickerid, res1, out)
SAR2 = request.security(syminfo.tickerid, res2, out)
SAR3 = request.security(syminfo.tickerid, res3, out)
SAR4 = request.security(syminfo.tickerid, res4, out)

//Plots
//plot(SAR1 , title="SAR 15", color = red, linewidth = 2)
//plot(SAR2 , title="SAR D", color = green, linewidth = 3)
plot(SAR3 , title="SAR W", color =blue, linewidth = 4)
//plot(SAR4 , title="SAR W", color =purple, linewidth = 5))


/////////////////////////////////////////////////////////////////////
//trade
if (SAR3 >= high)
    strategy.entry("ParLE", strategy.long, stop=SAR3, comment="ParLE")
else
    strategy.cancel("ParLE")

if (SAR3 <= low)
    strategy.entry("ParSE", strategy.short, stop=SAR3, comment="ParSE")
else
    strategy.cancel("ParSE")
Published by ChaoZhang on the FMZ strategy square · last modified 2024-01-16. Collected in the Quant Trading Vault. Unvalidated research: re-test with your own data and costs before trusting it.
Build this with AgenKit
A spec is not a trading system. Paste this into your coding agent and AgenKit runs a specialist team — architecture, test-first build, risk gates, review — with paper trading on by default.
/agenkit build a production-grade trading bot with a backtest engine, risk controls and paper trading by default from strategies/SAR-Alternating-Timeframe-Trading-Strategy.md- npx agenkit install engineering-kit in your project
- Paste the command into your agent and approve each phase
- Get tests, backtest, risk controls and a paper-trading switch
Understand it first
Before you run this, read the lesson behind the idea and how to backtest it honestly. Specs like this one are the survivors of an unknown number of trials; deflate their results accordingly.
Related specs
- Triple Moving Average Combined with MACD Quantitative StrategyPine Script · Machine learning · 1d
- High Low Cryptocurrency Strategy Based on Multiple IndicatorsPine Script · Machine learning · 45m
- Multi indicator Assisted StrategyPine Script · Machine learning · 1d
- Parabolic SAR and CCI Strategy with EMA Exit for Gold TradingPine Script · Machine learning · 1d
- Multi indicator Quant Trading StrategyPine Script · Machine learning · 1h
- ADX EFI 50 Moving Average Channel Pullback StrategyPine Script · Machine learning · 1h