Strategy vault / Machine learning
Sentiment Based XBT Futures Trading Strategy
This strategy adopts the approach of multi-cycle sentiment analysis to go long or short XBTUSD futures contract. It comprehensively considers the price fluctuation range and highest and lowest prices across different…
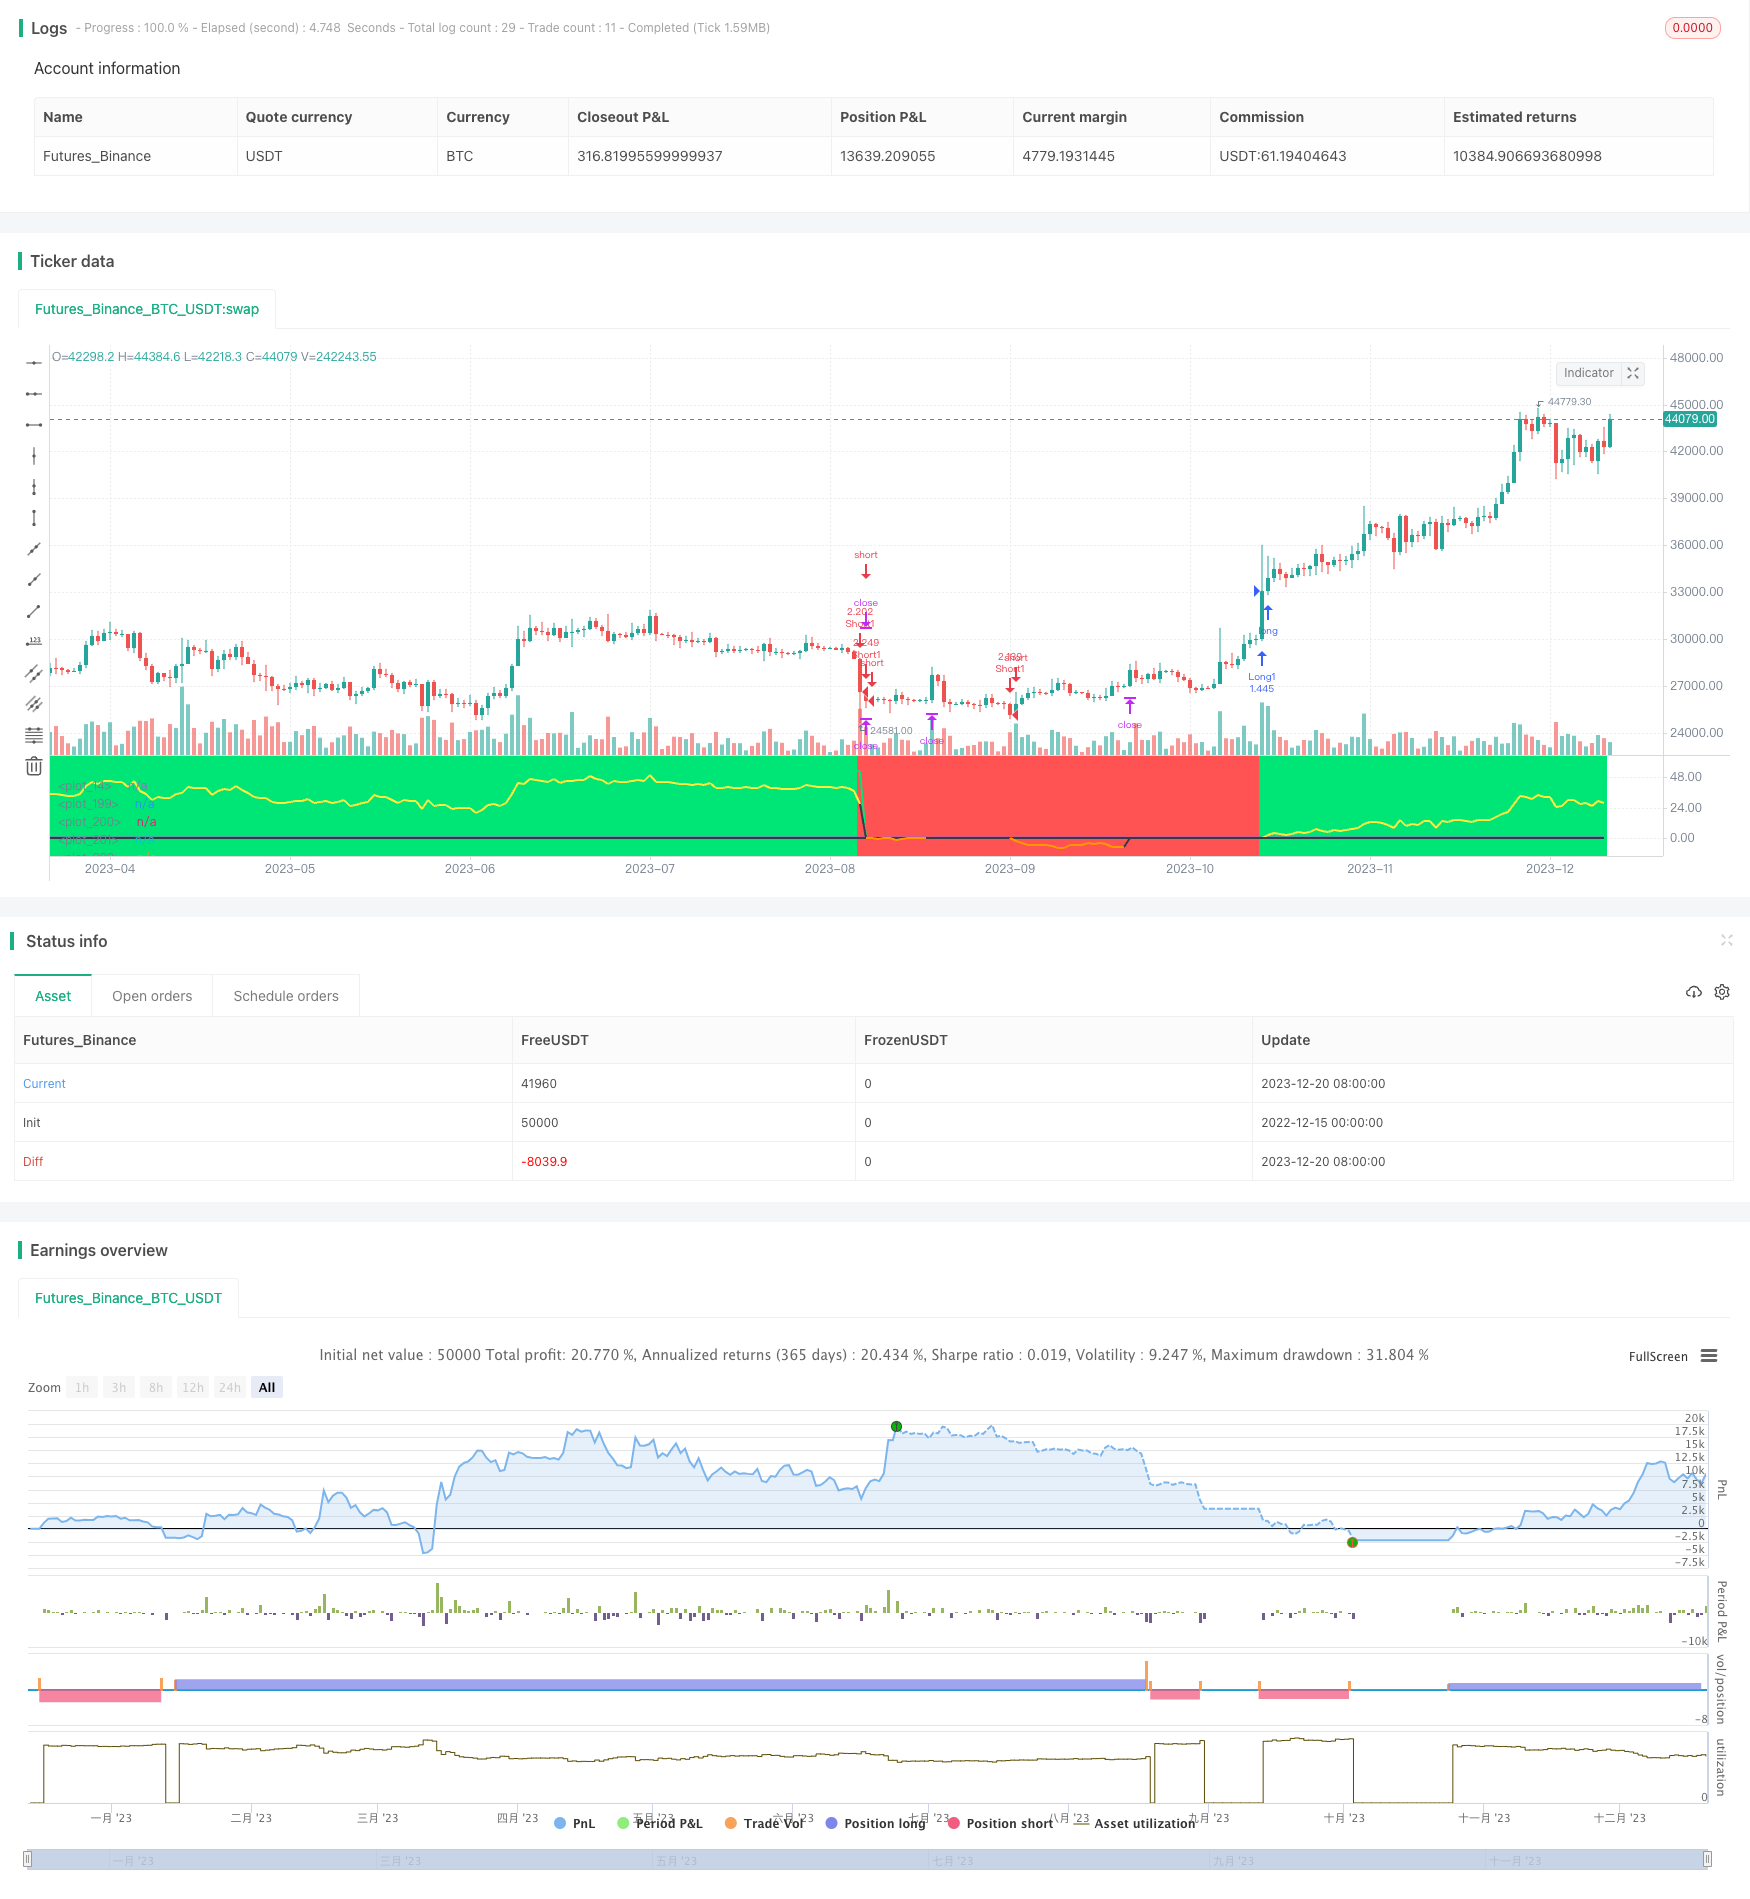
Overview
This strategy adopts the approach of multi-cycle sentiment analysis to go long or short XBTUSD futures contract. It comprehensively considers the price fluctuation range and highest and lowest prices across different cycles, and calculates the overall market sentiment through a series of weight adjustments. Buy and sell signals are generated based on the changing patterns of the sentiment value.
Strategy Logic
Calculate the highest price, lowest price, average price, price fluctuation range and other indicators across cycles from a to j (1 to 89 bars).
Define the standardized position of the closing price within the price range (place variable). Combine it with price fluctuation range of each cycle to get sentiment value for different cycles.
The sentiment values go through a series of weight (w variable) adjustments to get the overall sentiment value (sentiment). The sentiment reflects current overall market mood.
Analyze the fluctuation of sentiment value. A sell signal is generated when sentiment turns from positive to negative. A buy signal is generated when sentiment turns from negative to positive.
Determine entry momentum and set take profit and stop loss conditions based on the absolute value of sentiment fluctuation (delta variable).
Advantages
Consider sentiment across different cycles for a more comprehensive market trend judgment.
The weight adjustment mechanism makes the strategy more stable.
More precise entry timing by combining sentiment value and its fluctuation.
Manage risks with highest price, lowest price, take profit and stop loss.
Risks
Improper parameter settings may cause too frequent trading or missing opportunities.
Black swan events may invalidate the strategy logic.
Contract adjustments and rule changes may impact strategy performance.
Sentiment calculation relies on historical data. Reassessment is needed when market regime changes.
Risks can be managed by adjusting weights, trading cycles, take profit ratios etc to fit changing market conditions. Meanwhile optimize capital management by strictly controlling position sizing and overall exposure.
Optimization Directions
Expand analysis cycles to build richer basis for sentiment judgment.
Incorporate more technical indicators for a combined approach.
Extract sentiment features with machine learning methods.
Dynamically adjust weight settings.
Optimize take profit and stop loss strategies.
Conclusion
This strategy is based on the trading philosophy of sentiment analysis. It determines current overall market mood by considering multiple cycles. The continuous sentiment changes serve as the basis for generating trading signals, assisted by price fluctuation for timing entry. This unique approach of judging market trends works well in ranging cycles. Further expanding analysis periods, adding more indicators and optimizing can make the sentiment trading strategy more mature and stable for adapting more complex market environments.
Parameters
| Name | Default | What it controls |
|---|---|---|
| v_input_1 | true | leverage |
| v_input_2 | 53 | take profit % |
| v_input_3 | 7 | stoploss % |
| v_input_4 | 0.7 | level to initiate trade |
| v_input_5 | false | level to close trade |
| v_input_6 | 0.68 | level to initiate trade |
| v_input_7 | false | level to close trade |
| v_input_8 | 1.158 | weight a |
| v_input_9 | 1.119 | weight b |
| v_input_10 | 1.153 | weight c |
| v_input_11 | 1.272 | weight d |
| v_input_12 | 1.295 | weight e |
| v_input_13 | 1.523 | weight f |
| v_input_14 | 1.588 | weight g |
| v_input_15 | 2.1 | weight h |
| v_input_16 | 1.816 | weight i |
| v_input_17 | 2.832 | weight j |
Source Pine Script
/*backtest
start: 2022-12-15 00:00:00
end: 2023-12-21 00:00:00
period: 1d
basePeriod: 1h
exchanges: [{"eid":"Futures_Binance","currency":"BTC_USDT"}]
*/

// This source code is subject to the terms of the Mozilla Public License 2.0 at https://mozilla.org/MPL/2.0/
// © Jomy

//@version=4

//2h chart BITMEX:XBTUSD
//use on low leverage 1-2x only

strategy("expected range STRATEGY",overlay=false,initial_capital=1000,precision=2)
leverage=input(1,"leverage",step=.5)
tp=input(53,"take profit %",step=1)
sl=input(7,"stoploss %",step=1)
stoploss=1-(sl/100)
plot(stoploss)
level=input(.70,"level to initiate trade",step=.02)
closelevel=input(0.0,"level to close trade",step=.02)
levelshort=input(.68,"level to initiate trade",step=.02)
closelevelshort=input(0.0,"level to close trade",step=.02)

wa=input(1.158,"weight a",step=.2)
wb=input(1.119,"weight b",step=.2)
wc=input(1.153,"weight c",step=.2)
wd=input(1.272,"weight d",step=.2)
we=input(1.295,"weight e",step=.2)
wf=input(1.523,"weight f",step=.2)
wg=input(1.588,"weight g",step=.2)
wh=input(2.100,"weight h",step=.2)
wi=input(1.816,"weight i",step=.2)
wj=input(2.832,"weight j",step=.2)
a=1
b=2
c=3
d=5
e=8
f=13
g=21
h=34
i=55
j=89

n=0
n:=if volume > -1
    nz(n[1])+1


ra=highest(high,a)-lowest(low,a)
aa=sma(ohlc4,a)
ha=aa[1]+ra[1]/2
la=aa[1]-ra[1]/2

rb=highest(high,b)-lowest(low,b)
ab=sma(ohlc4,b)
hb=ab[1]+rb[1]/2
lb=ab[1]-rb[1]/2

rc=highest(high,c)-lowest(low,c)
ac=sma(ohlc4,c)
hc=ac[1]+rc[1]/2
lc=ac[1]-rc[1]/2

rd=highest(high,d)-lowest(low,d)
ad=sma(ohlc4,d)
hd=ad[1]+rd[1]/2
ld=ad[1]-rd[1]/2

re=highest(high,e)-lowest(low,e)
ae=sma(ohlc4,e)
he=ae[1]+re[1]/2
le=ae[1]-re[1]/2

rf=highest(high,f)-lowest(low,f)
af=sma(ohlc4,f)
hf=af[1]+rf[1]/2
lf=af[1]-rf[1]/2

rg=highest(high,g)-lowest(low,g)
ag=sma(ohlc4,g)
hg=ag[1]+rg[1]/2
lg=ag[1]-rg[1]/2

rh=highest(high,h)-lowest(low,h)
ah=sma(ohlc4,h)
hh=ah[1]+rh[1]/2
lh=ah[1]-rh[1]/2

ri=highest(high,i)-lowest(low,i)
ai=sma(ohlc4,i)
hi=ai[1]+ri[1]/2
li=ai[1]-ri[1]/2

rj=highest(high,j)-lowest(low,j)
aj=sma(ohlc4,j)
hj=aj[1]+rj[1]/2
lj=aj[1]-rj[1]/2

placea=((close-la)/(ha-la)-.5)*-100
placeb=((close-lb)/(hb-lb)-.5)*-100
placec=((close-lc)/(hc-lc)-.5)*-100
placed=((close-ld)/(hd-ld)-.5)*-100
placee=((close-le)/(he-le)-.5)*-100
placef=((close-lf)/(hf-lf)-.5)*-100
placeg=((close-lg)/(hg-lg)-.5)*-100
placeh=((close-lh)/(hh-lh)-.5)*-100
placei=((close-li)/(hi-li)-.5)*-100
placej=((close-lj)/(hj-lj)-.5)*-100

sentiment=((placea/j)*ra*wa+(placeb/i)*rb*wb+(placec/h)*rc*wc+(placed/g)*rd*wd+(placee/f)*re*we+(placef/e)*rf*wf+(placeg/d)*rg*wg+(placeh/c)*rh*wh+(placei/b)*ri*wi+(placej/a)*rj*wj)/(wa+wb+wc+wd+we+wf+wg+wh+wi+wj)

deltalong=0.0
deltalong:=if sentiment>0
    nz(deltalong[1])+sentiment-sentiment[1]
else
    0
deltashort=0.0
deltashort:=if sentiment<0
    nz(deltashort[1])+((sentiment-sentiment[1])*-1)
else
    0

//plot(sentiment*-1,color=color.blue)
//plot(deltalong,color=color.red)
//plot(deltashort,color=color.lime)

peakfindlong=highest(deltalong,j)*level


peakfindshort=highest(deltashort,j)*levelshort


contracts=(strategy.equity/close)*leverage


//reason for o is this strategy makes dumb trades before the sentiment line crosses the 0 point the first time
o=0
o:=if cross(0,sentiment) and n>j
    1
else
    nz(o[1])

long=deltashort>peakfindlong and o==1

short=deltalong>peakfindshort and o==1


longstart=0.0
longstart:=if strategy.position_size>0 and strategy.position_size[1]<=0
    close
else
    nz(longstart[1])

shortstart=0.0
shortstart:=if strategy.position_size<0 and strategy.position_size[1]>=0
    close
else
    nz(shortstart[1])

highsincelong = 0.0
highsincelong := if strategy.position_size>0
    max(max(highsincelong[1],high),high[1])
else
    0

lowsinceshort = 1000000.0
lowsinceshort := if strategy.position_size<0
    min(min(lowsinceshort[1],low),low[1])
else
    10000000

closelong=strategy.position_size > 0 and ((highsincelong/longstart-1)*100) > tp
closeshort=strategy.position_size < 0 and ((shortstart/lowsinceshort-1)*100) > tp

stoptrade=0
stoptrade:= if closelong
    1
else
    nz(stoptrade[1])

stoptrade:= if short and stoptrade[1]==1
    0
else
    stoptrade

stoptrade:= if closeshort
    -1
else
    stoptrade

stoptrade:= if long and stoptrade[1]==-1
    0
else
    stoptrade

if(closelong)
    strategy.close("Long1")

pnllong = ((close - strategy.position_avg_price) / strategy.position_avg_price)*100
pnlshort = ((strategy.position_avg_price-close) / strategy.position_avg_price) *100
plot (strategy.position_size > 0 ?(highsincelong/longstart-1)*100 : 0.0,color=color.lime,linewidth=2)
plot (strategy.position_size < 0 ?(shortstart/lowsinceshort-1)*100 : 0.0,color=color.red,linewidth=2)
plot( strategy.position_size > 0 ? pnllong:0, color=strategy.position_size > 0 ?color.yellow:color.black,linewidth=2 )
plot( strategy.position_size < 0 ? pnlshort:0, color=strategy.position_size < 0 ?color.orange:color.black,linewidth=2)
longuntilshort=0
longuntilshort:=if long
    1
else
    if short
        -1
    else
        nz(longuntilshort[1])
bgcolor(stoptrade!=0?color.black:longuntilshort==1?color.lime:longuntilshort==-1?color.red:na,transp=70)

if(long and stoptrade==0)
    strategy.entry("Long1",strategy.long,qty=max(1,min(contracts,1000000000)))

if(closelong)
    strategy.close("Long1")

strategy.exit("Long1",stop=longstart * stoploss,when = strategy.position_size>0)

if(short and stoptrade==0)
    strategy.entry("Short1",strategy.short,max(1,min(contracts,1000000000)))

if(closeshort)
    strategy.close("Short1")

strategy.exit("Long1",stop=shortstart / stoploss,when = strategy.position_size<0)Published by ChaoZhang on the FMZ strategy square · last modified 2023-12-22. Collected in the Quant Trading Vault. Unvalidated research: re-test with your own data and costs before trusting it.
Build this with AgenKit
A spec is not a trading system. Paste this into your coding agent and AgenKit runs a specialist team — architecture, test-first build, risk gates, review — with paper trading on by default.
/agenkit build a production-grade trading bot with a backtest engine, risk controls and paper trading by default from strategies/Sentiment-Based-XBT-Futures-Trading-Strategy.md- npx agenkit install engineering-kit in your project
- Paste the command into your agent and approve each phase
- Get tests, backtest, risk controls and a paper-trading switch
Understand it first
Before you run this, read the lesson behind the idea and how to backtest it honestly. Specs like this one are the survivors of an unknown number of trials; deflate their results accordingly.
Related specs
- AI Driven Dynamic Volatility Adaptive Trend Breakout Trading StrategyPine Script · Machine learning · 2d
- AI Powered Volatility Price System Divergence Trading StrategyPine Script · Machine learning · 1h
- Configurable BBRSIAroon Strategy BacktestPine Script · Machine learning · 5m
- Dual Moving Average Matching Strategy Based on Bollinger BandsPine Script · Machine learning · 1h
- Dynamic Weighted Moving Average Trading StrategyPine Script · Machine learning · 1d
- EMA and RSI Quantitative Trading StrategyPine Script · Machine learning · 1h