Short term Trading Strategy Based on Bollinger Bands
This strategy conducts short-term trading based on the Bollinger Bands indicator, utilizing the upper and lower rails of Bollinger Bands to provide breakthrough buying and selling signals. It belongs to a simple…
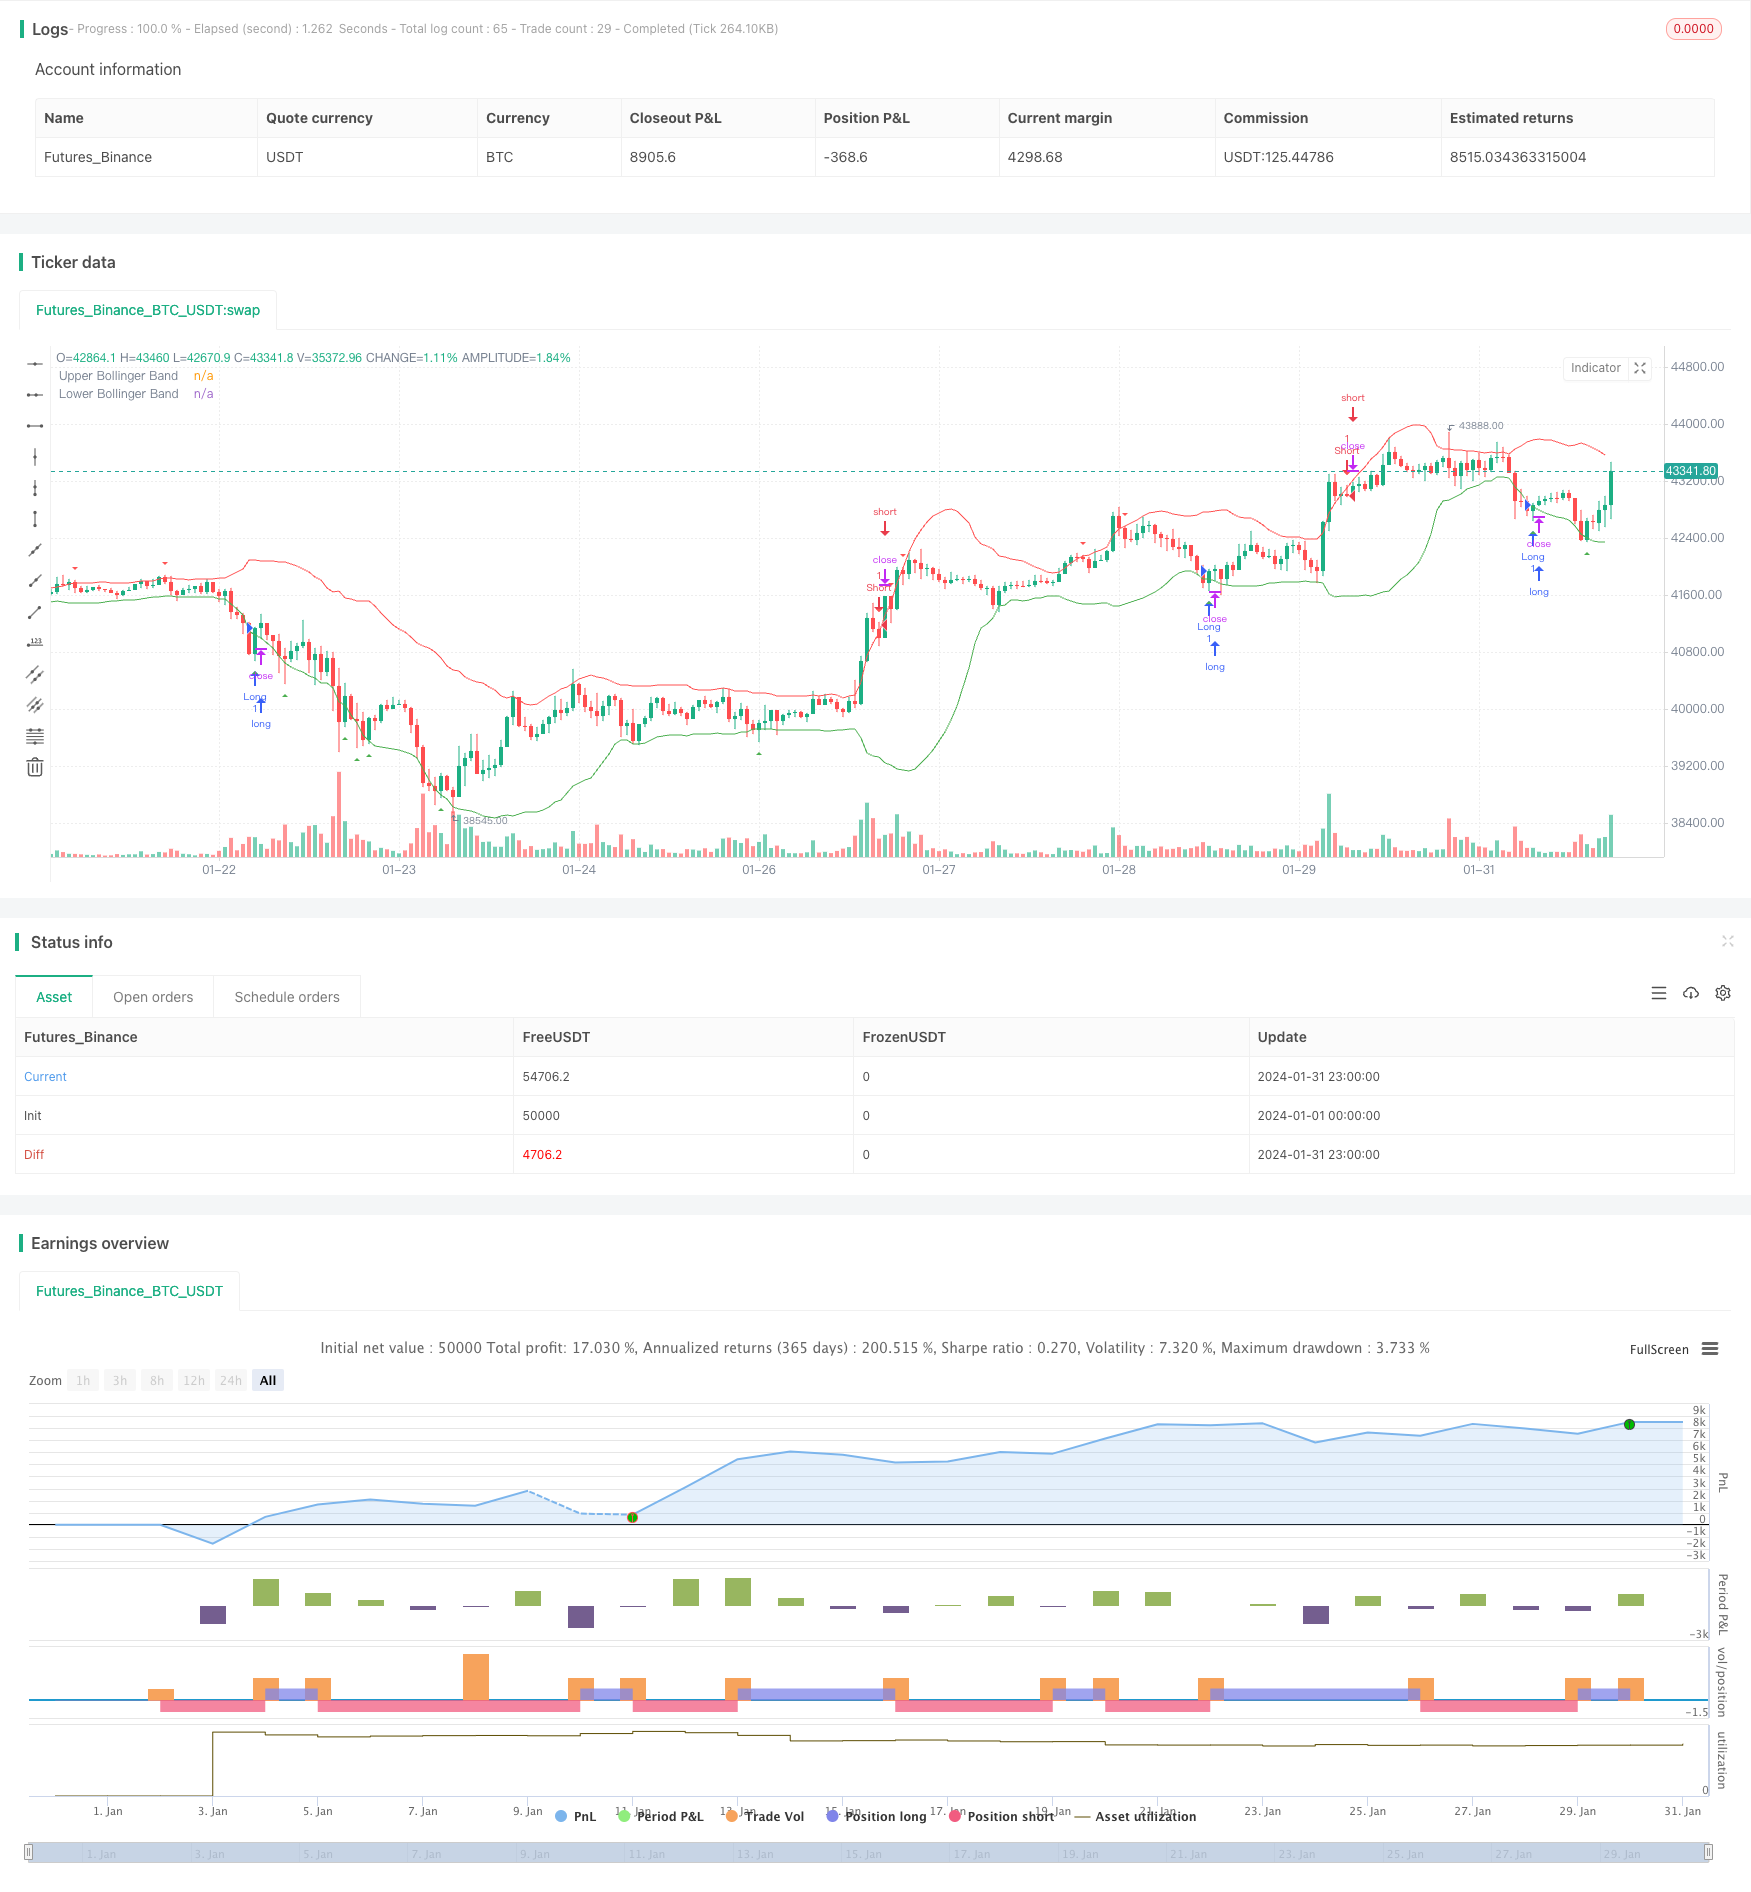
Overview
This strategy conducts short-term trading based on the Bollinger Bands indicator, utilizing the upper and lower rails of Bollinger Bands to provide breakthrough buying and selling signals. It belongs to a simple momentum tracking strategy. It is mainly suitable for short-term tracking and chasing price trends.
Strategy Principle
The strategy relies mainly on the Bollinger Bands indicator. Bollinger Bands includes middle rail, upper rail and lower rail. The middle rail represents the N-day simple moving average of the closing price. The upper rail is calculated by the middle rail plus 2 times the standard deviation. The lower rail is calculated by the middle rail minus 2 times the standard deviation. When the price breaks through the lower rail upwards, a buy signal is generated. When the price breaks through the upper rail downwards, a sell signal is generated.
The main trading logic of this strategy is:
Use the sma() function to calculate the N-day (default 20-day) simple moving average of the closing price as the middle rail of Bollinger Bands
Use the stdev() function to calculate the N-day (default 20-day) standard deviation based on the closing price
The upper and lower rails of Bollinger Bands are composed of the middle rail ± 2 times the standard deviation
When the closing price breaks through the lower rail upward, a buy signal is generated
When the closing price breaks through the upper rail downward, a sell signal is generated
Use functions like plotshape to mark buy and sell signals on the candlestick chart
Advantages of the Strategy
The strategy logic is simple and easy to understand and use
Less indicator parameters, easy to optimize and adjust
Can effectively track market trends and chase momentum
Relatively small pullback risk
Risks of the Strategy
Prone to missing reversal risks
Improper parameter settings may lead to excessively high trading frequency
Breakthrough judgements of upper and lower rails are quite sensitive to market fluctuations
The effect is highly related to parameter settings. Careful testing and optimization is needed.
Directions for Strategy Optimization
Adjust parameters of Bollinger Bands, optimize moving average period and times of standard deviation
Add filters with other indicators to avoid wrong trades
Add stop loss mechanisms to control single loss
Different products and cycles need different parameter settings. Separate testing is needed.
Summary
Overall, this is a very typical and practical short-term momentum tracking strategy. It can grasp market trends through a simple indicator framework and suits short-term operations. But there are also some disadvantages like sensitivity to parameters, insufficient signal filtering, etc. Further optimizing indicator parameters or adding other auxiliary indicators can improve the stability and profitability of the strategy.
Parameters
| Name | Default | What it controls |
|---|---|---|
| v_input_1 | 20 | Bollinger Bands Length |
| v_input_2 | 2 | Multiplier |
Source Pine Script
/*backtest
start: 2024-01-01 00:00:00
end: 2024-01-31 23:59:59
period: 1h
basePeriod: 15m
exchanges: [{"eid":"Futures_Binance","currency":"BTC_USDT"}]
*/

//@version=4
strategy("arasmuz2.0", overlay=true)

// Bollinger Bands Parametreleri
length = input(20, title="Bollinger Bands Length")
mult = input(2.0, title="Multiplier")

// Bollinger Bands Hesaplamaları
basis = sma(close, length)
upper_band = basis + mult * stdev(close, length)
lower_band = basis - mult * stdev(close, length)

// Long (Alım) Koşulları
longCondition = crossover(close, lower_band)

// Short (Satım) Koşulları
shortCondition = crossunder(close, upper_band)

// Long (Alım) Giriş
strategy.entry("Long", strategy.long, when=longCondition)

// Short (Satım) Giriş
strategy.entry("Short", strategy.short, when=shortCondition)

// Al sinyalini mumun altına koy
plotshape(series=longCondition, title="Buy Signal", color=color.green, style=shape.triangleup, location=location.belowbar, size=size.small)

// Sat sinyalini mumun üstüne koy
plotshape(series=shortCondition, title="Sell Signal", color=color.red, style=shape.triangledown, location=location.abovebar, size=size.small)

// Bollinger Bands'ı Grafik Üzerinde Görüntüle
plot(upper_band, color=color.red, title="Upper Bollinger Band")
plot(lower_band, color=color.green, title="Lower Bollinger Band")
Published by ChaoZhang on the FMZ strategy square · last modified 2024-02-29. Collected in the Quant Trading Vault. Unvalidated research: re-test with your own data and costs before trusting it.
Build this with AgenKit
A spec is not a trading system. Paste this into your coding agent and AgenKit runs a specialist team — architecture, test-first build, risk gates, review — with paper trading on by default.
/agenkit build a production-grade trading bot with a backtest engine, risk controls and paper trading by default from strategies/Short-term-Trading-Strategy-Based-on-Bollinger-Bands.md- npx agenkit install engineering-kit in your project
- Paste the command into your agent and approve each phase
- Get tests, backtest, risk controls and a paper-trading switch
Understand it first
Before you run this, read the lesson behind the idea and how to backtest it honestly. Specs like this one are the survivors of an unknown number of trials; deflate their results accordingly.
Related specs
- Adaptive Bollinger Breakout with Moving Average Quantitative Strategy SystemPine Script · Breakout · 1h
- BB Breakout StrategyPine Script · Breakout · 1d
- Bollinger Band Breakout Trend Following StrategyPine Script · Breakout · 1d
- Bollinger Band Channel Breakout Trading StrategyPine Script · Breakout · 1d
- Bollinger Band T3 Moving Average StrategyPine Script · Breakout · 10m
- Bollinger Bands Breakout Trading StrategyPine Script · Breakout · 1h