Strategy vault / Trend following
SMA Crossover Bullish Trend Following Strategy
This strategy is a long-term trend following strategy based on the crossover of Simple Moving Averages (SMA). It generates buy signals when the short period SMA crosses over the long period SMA and follows the…
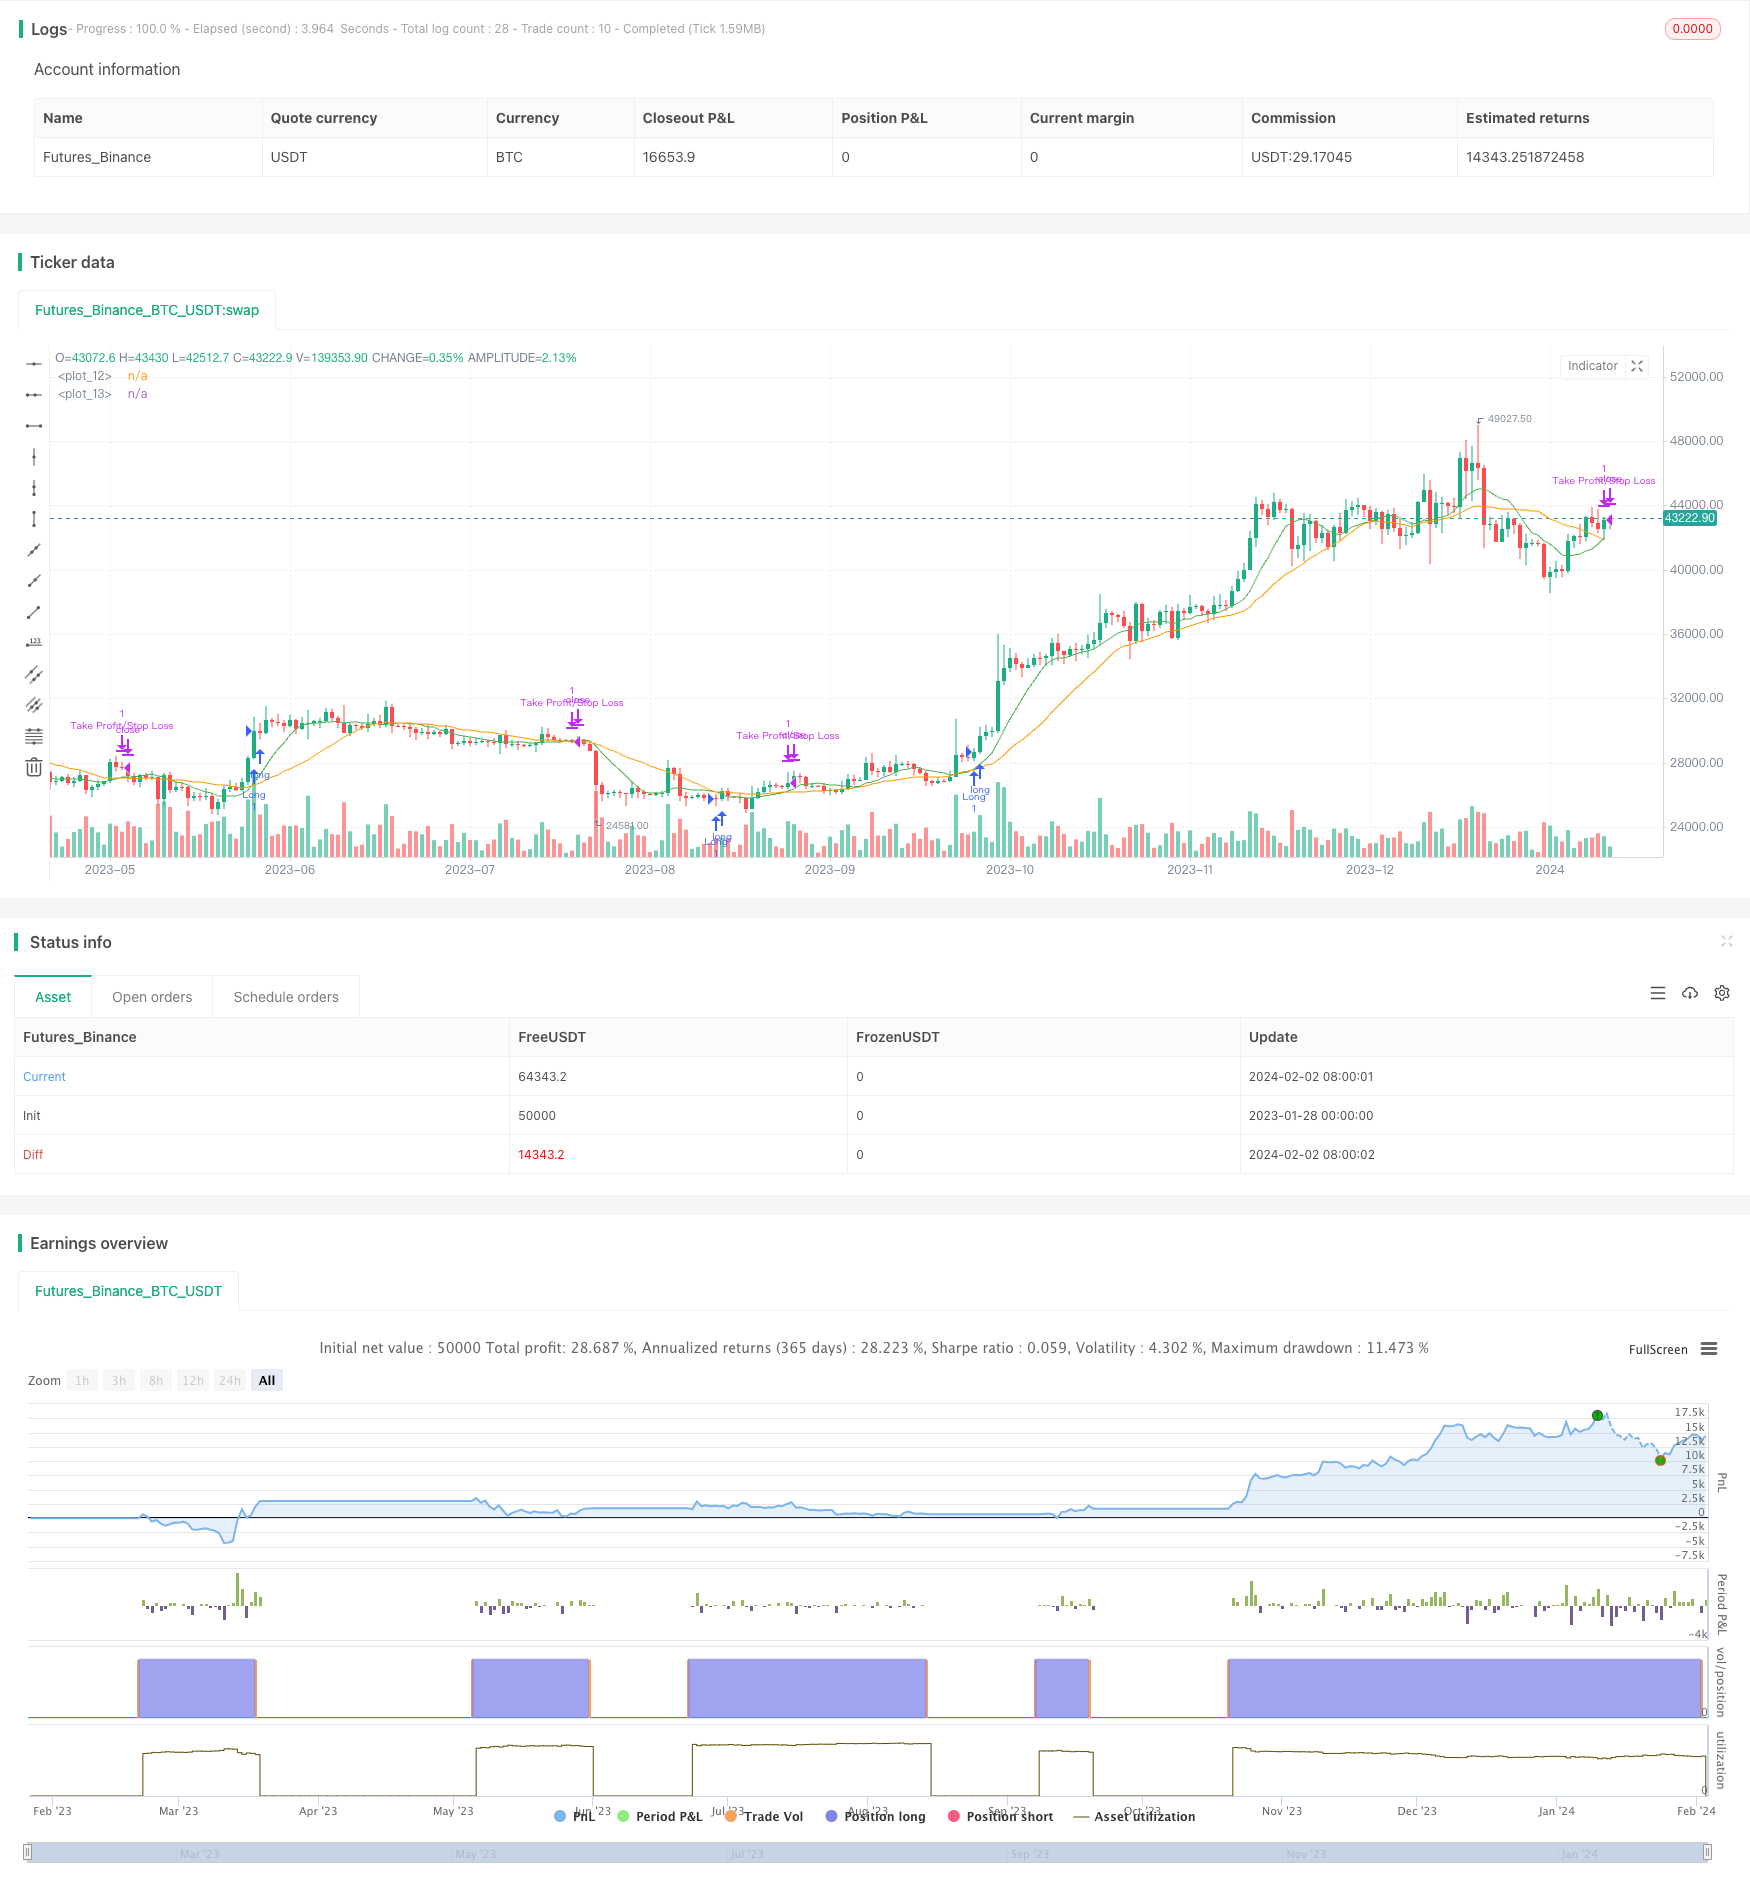
Overview
This strategy is a long-term trend following strategy based on the crossover of Simple Moving Averages (SMA). It generates buy signals when the short period SMA crosses over the long period SMA and follows the uptrend. At the same time, it also sets take profit and stop loss based on certain percentages of the entry price to manage risks.
Strategy Logic
The strategy mainly uses the "golden cross" crossover signals of the SMA indicator to determine entry timing. Specifically, it calculates the 9-period and 21-period SMA respectively. When the short term 9-period SMA crosses over the longer term 21-period SMA from below, it indicates the price is shifting from consolidation to an uptrend, which is a good timing for trend following. The strategy will then generate a buy signal to follow the trend.
In addition, the strategy also dynamically sets the take profit and stop loss based on 1.5% and 1% of the entry price. That means the take profit will be 1.5% above the entry price and the stop loss will be 1% below. Through this approach, it manages risks by setting a predefined risk-reward ratio.
Advantages
- Using SMA to determine entry filters out short-term market noise and catches mid-long term trends.
- The SMA periods are adjustable and can be tuned to adapt to trends over different time horizons.
- The risk management mechanism is comprehensive and can control single trade loss by adjusting risk-reward ratio.
- The strategy is simple to understand, suitable for beginners in quantitative trading.
Risks and Solutions
- SMA crossover signals may have false breakouts, causing unnecessary losses. Other indicators can be used to filter the signals.
- The take profit and stop loss are relatively fixed, which may lead to expected profit but actual loss. Consider dynamically trailing take profit and stop loss.
- The risk-reward ratio is fixed and cannot adapt to changing market volatility. Consider using ATR and other indicators to dynamically adjust risk-reward levels.
- There is a certain time lag. Can consider reducing SMA periods or introducing leading indicators.
Enhancement Opportunities
- Add other indicators to filter SMA crossover signals and avoid false signals, e.g. KDJ, volatility indicators etc.
- Dynamically trail take profit and stop loss, e.g. using Chandelier Exit algorithms.
- Use ATR and other indicators to dynamically adjust risk-reward ratio based on market volatility.
- Reduce SMA periods or introduce leading indicators to lower time lags.
Conclusion
This is a medium-long term trend following strategy based on SMA crossover. It identifies trends with SMA and controls risks by setting take profit and stop loss. The advantage is it is simple and easy to implement, suitable for beginners in quantitative trading. Meanwhile, there are also rooms for enhancement, such as adding other signal filters, trailing take profit/stop loss dynamically, adjusting risk-reward ratios based on volatility etc. Through continuous improvements, the strategy can become more robust and adapt to more market environments.
Source Pine Script
/*backtest
start: 2023-01-28 00:00:00
end: 2024-02-03 00:00:00
period: 1d
basePeriod: 1h
exchanges: [{"eid":"Futures_Binance","currency":"BTC_USDT"}]
*/

// This Pine Script™ code is subject to the terms of the Mozilla Public License 2.0 at https://mozilla.org/MPL/2.0/
// © Masterdata

//@version=5
strategy("Simple MA Crossover Long Strategy v5", overlay=true)

// Define the short and long moving averages
shortMa = ta.sma(close, 9)
longMa = ta.sma(close, 21)

// Plot the moving averages on the chart
plot(shortMa, color=color.green)
plot(longMa, color=color.orange)

// Generate a long entry signal when the short MA crosses over the long MA
longCondition = ta.crossover(shortMa, longMa)
if (longCondition)
    strategy.entry("Long", strategy.long)

// Define the take profit and stop loss as a percentage of the entry price
takeProfitPerc = 1.5 / 100 // Take profit at 1.5% above entry price

stopLossPerc = 1.0 / 100 // Stop loss at 1.0% below entry price

// Calculate the take profit and stop loss price levels dynamically
takeProfitLevel = strategy.position_avg_price * (1 + takeProfitPerc)
stopLossLevel = strategy.position_avg_price * (1 - stopLossPerc)

// Set the take profit and stop loss for the trade
if (longCondition)
    strategy.exit("Take Profit/Stop Loss", "Long", limit=takeProfitLevel, stop=stopLossLevel)
Published by ChaoZhang on the FMZ strategy square · last modified 2024-02-04. Collected in the Quant Trading Vault. Unvalidated research: re-test with your own data and costs before trusting it.
Build this with AgenKit
A spec is not a trading system. Paste this into your coding agent and AgenKit runs a specialist team — architecture, test-first build, risk gates, review — with paper trading on by default.
/agenkit build a production-grade trading bot with a backtest engine, risk controls and paper trading by default from strategies/SMA-Crossover-Bullish-Trend-Following-Strategy.md- npx agenkit install engineering-kit in your project
- Paste the command into your agent and approve each phase
- Get tests, backtest, risk controls and a paper-trading switch
Understand it first
Before you run this, read the lesson behind the idea and how to backtest it honestly. Specs like this one are the survivors of an unknown number of trials; deflate their results accordingly.
Related specs
- ATR and Moving Average Crossover Hybrid StrategyPine Script · Trend following · 1h
- Adaptive Risk Management Strategy Based on Dynamic ATR and Moving Average CrossoverPine Script · Trend following · 2h
- Adaptive Volatility Based Trend Following Short Strategy with Time Delay and Stop Loss ProtectionPine Script · Trend following · 2m
- BB Percentage Index Trend Fading StrategyPine Script · Trend following · 1h
- Bollinger Bands and RSI Trend Following StrategyPine Script · Trend following · 1h
- Dual ATR Channel Trend Following StrategyPine Script · Trend following · 15m