Strategy vault / Machine learning
Smooth Moving Average Stop Loss Strategy
This strategy uses smooth moving average lines and average true range to calculate two stop loss price levels. It opens reverse positions when prices break through the stop loss levels to achieve stop loss trailing…
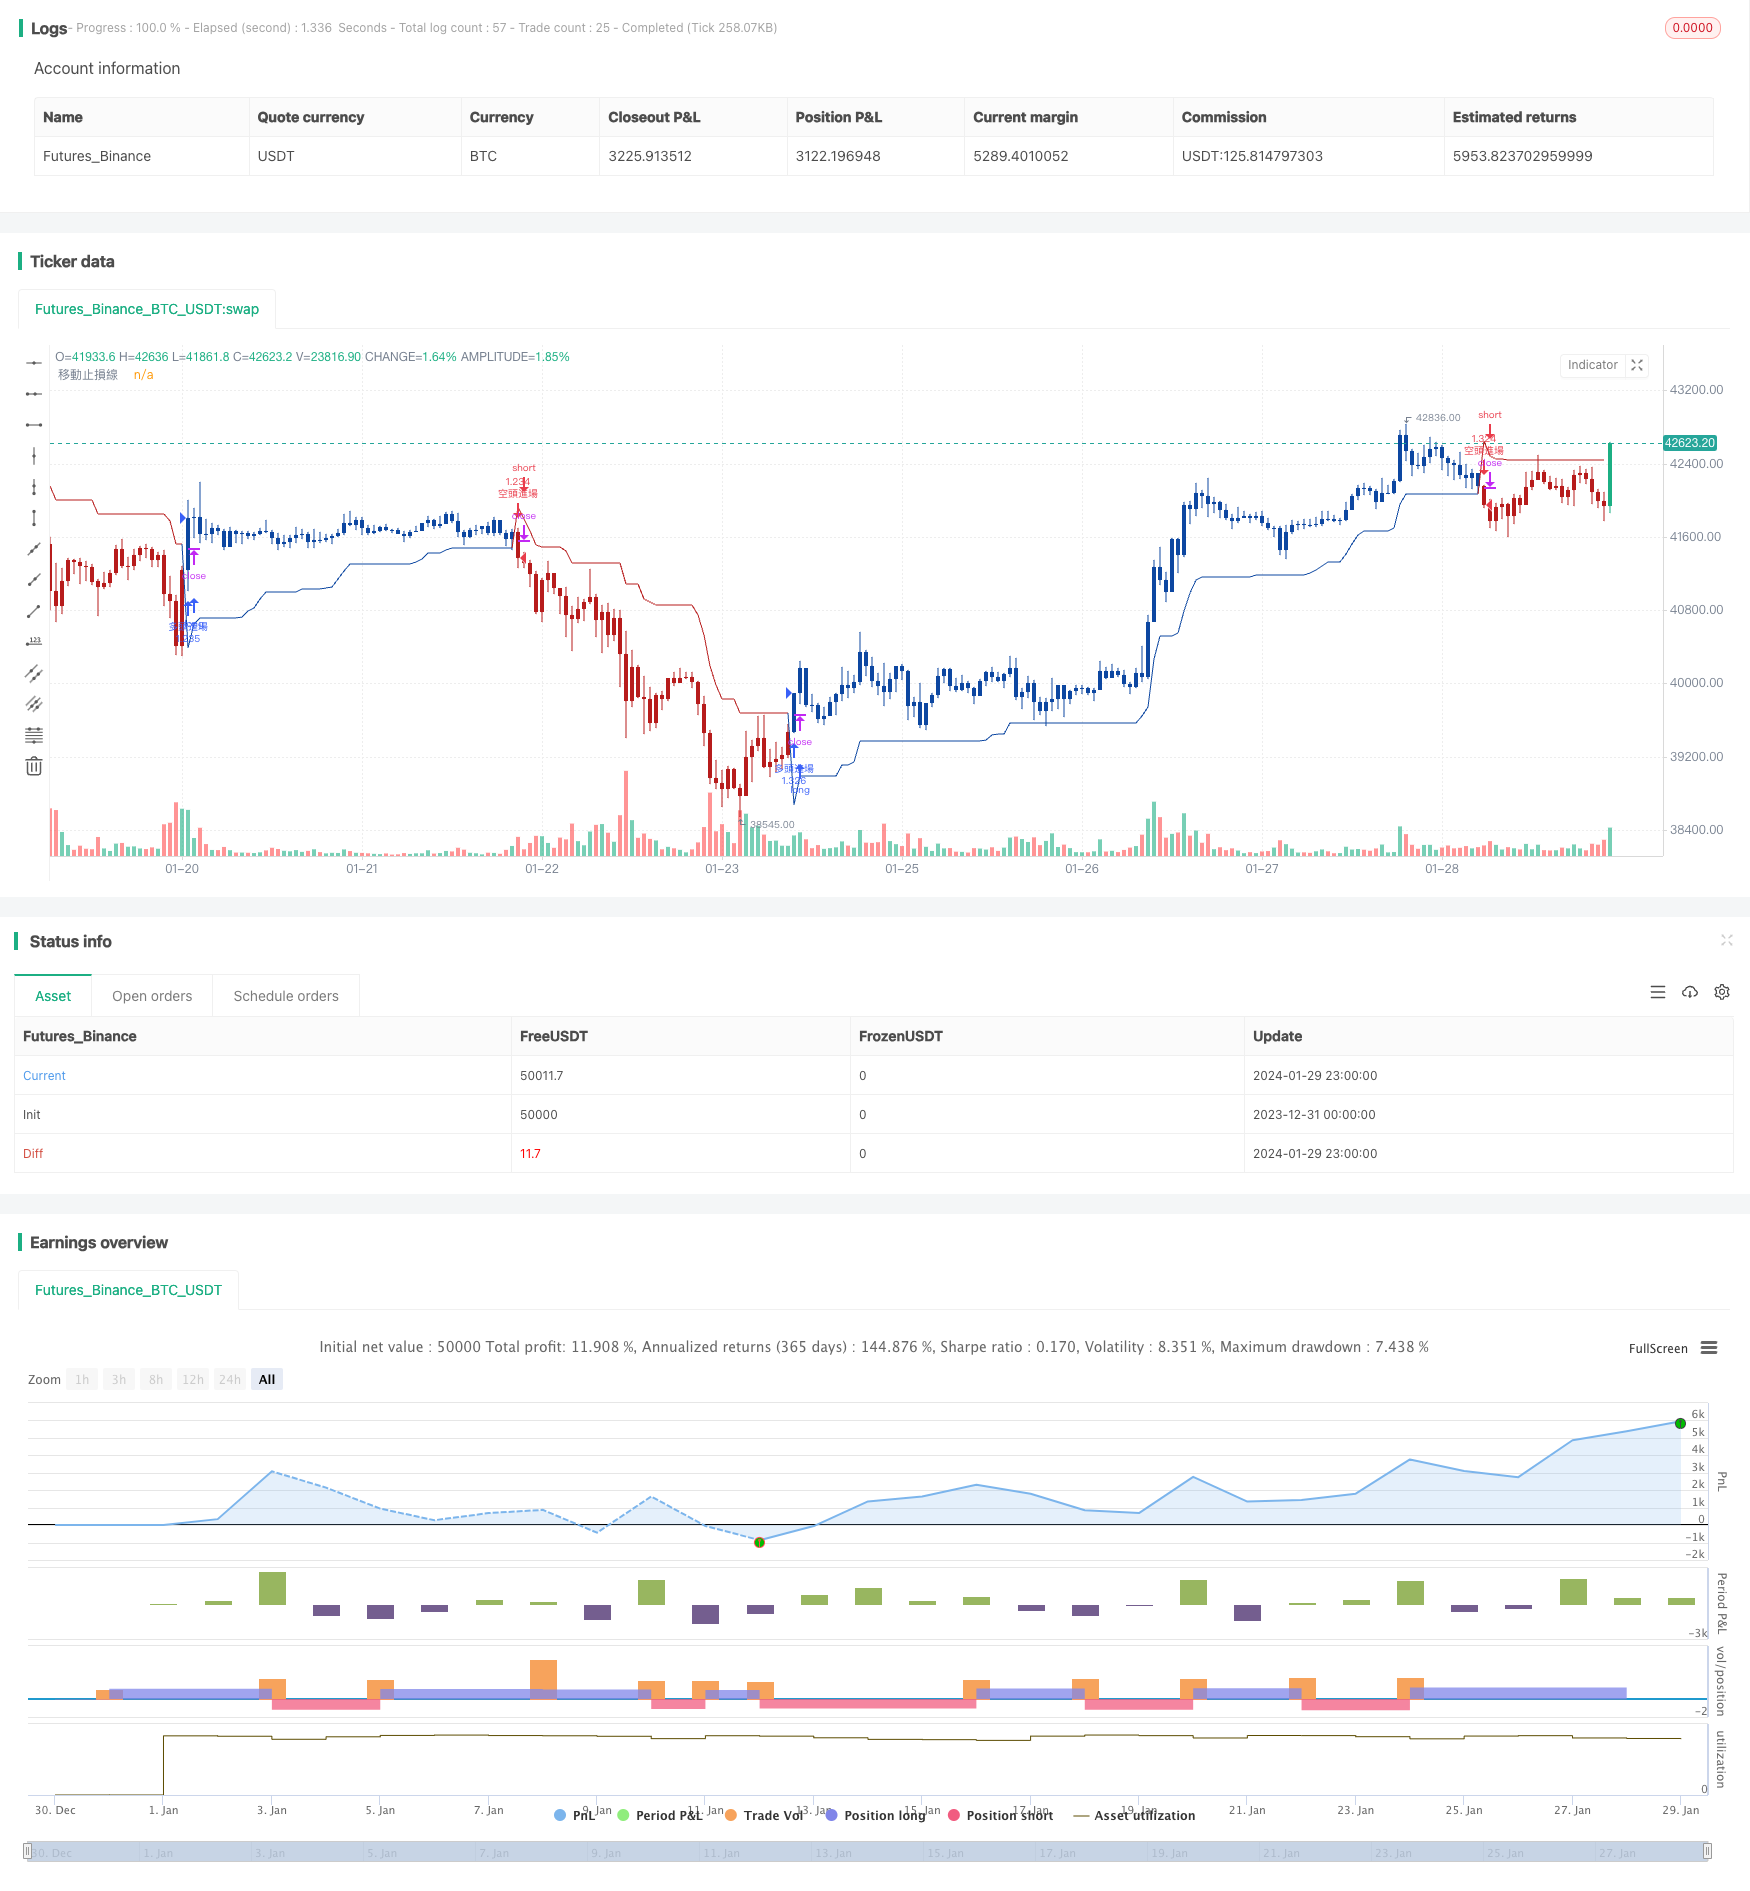
Overview
This strategy uses smooth moving average lines and average true range to calculate two stop loss price levels. It opens reverse positions when prices break through the stop loss levels to achieve stop loss trailing of trends. The strategy is suitable for highly volatile cryptocurrency trading and can effectively lock in profits and avoid losses.
Strategy Logic
- Calculate the average true price range atr of the recent n periods and smooth it using the RMA method
- The long stop loss price level is the highest price minus atr, and the short stop loss price level is the lowest price plus atr
- When the price breaks through the upper stop loss line, go short; when it breaks through the lower stop loss line, go long
- The stop loss lines are constantly updated as the price moves to achieve dynamic trailing
This strategy determines a reasonable stop loss range through ATR calculation and then uses the RMA method to smooth the stop loss lines to avoid triggering stops by small price fluctuations. When a trend reversal occurs, it can quickly identify signals and establish positions by breaking the stop loss lines in the reverse direction.
Advantage Analysis
- Smooth moving stop loss lines effectively filter noise and avoid false signals
- Dynamically trailing stop loss points can lock in most trend profits
- Stable parameters, suitable for medium and long-term holdings
- Achieves fully automated trading without manual intervention
Risk Analysis
- The stop loss range may be too large and the ATR period and multiplier should be adjusted accordingly
- There may be more frequent closing of positions when the trend is unclear
- Appropriate entry conditions should be set to avoid chasing rises and falls
The stop loss range can be reduced by appropriately shortening the ATR period or reducing the ATR multiplier, or additional filters can be added to reduce unnecessary opening of positions. Pay attention to controlling actual leverage and position sizing to cope with drastic market changes.
Optimization Directions
- Other indicators can be added on the basis of ATR parameters to determine the trend
- Optimize the opening logic and set stricter breakout filters
- Add moving profit taking functions
- Optimize stop loss lines with machine learning algorithms
Judging the trend direction with other oscillator indicators can avoid ineffective opening during consolidation. Optimize entry logic to ensure price can continue running for a certain range after breaking through the stop loss line. Add moving profit taking lines to lock in more profits. Use machine learning to train better stop loss functions.
Summary
This strategy dynamically trails highly volatile cryptocurrency markets with smooth moving average stop loss lines to effectively control risks. The strategy parameters are relatively stable, making it suitable for automated trading. It can be optimized across multiple dimensions by combining more indicators and algorithms to improve performance.
Parameters
| Name | Default | What it controls |
|---|---|---|
| v_input_1_close | 0 | Data source: close | high | low | open | hl2 | hlc3 | hlcc4 | ohlc4 |
| v_input_2 | true | ATR timeframe |
| v_input_3 | 2.618 | ATR Multiplier |
| v_input_4 | 2017 | Set range: Year |
| v_input_5 | 11 | _____Moon |
| v_input_6 | true | _____day |
Source Pine Script
/*backtest
start: 2023-12-31 00:00:00
end: 2024-01-30 00:00:00
period: 1h
basePeriod: 15m
exchanges: [{"eid":"Futures_Binance","currency":"BTC_USDT"}]
*/

//@version=4
//
//  Work: [LunaOwl] Super Trend2
//
////////////////////////////////
//     ~~!!*(๑╹◡╹๑) **       //
//  Production: @LunaOwl Peng Peng       //
//  No.1Edition: 2019Year05Moon29day     //
//  No.2Edition: 2019Year06Moon12day     //
//  Fine-tuning:  2019Year10Moon26day     //
//  No.3Edition: 2020Year02Moon12day     //
////////////////////////////////
//
//
//Disadvantages of Super Trend:
//--1.Stop-loss distance may be quite large, Please adjust the period yourself
//--2.Performs poorly when the market has no obvious trend
//
//Advantages of Super Trend:
//--1.Has a trailing stop loss line that can be referenced, Suitable for novices
//--2.Performs very well when the market has an obvious trend
//
//Instructions for use:
//--1.Each trade requires placing a trailing stop order, Definitely download it
//--2.Don't rush back in when you are kicked out by a pin midway.
//--3.If an opportunity is missed, do not chase highs or lows, Wait for the next opportunity
//--4.The effective leverage ratio should not be too high, Do Not Underestimate Market Changes
//--5.It is recommended to divide order entries and exits into five or ten interval orders
//--6.Do not try to make every penny on the market
//
//Slightly updated:
//--1.The Average True Range uses a recursive moving average to reduce noise
//--2.For small coin markets with high volatility, mid-term trend-following strategies should focus on reducing noise.
//--3.After studying foreign trading strategies, they often use smoothing factors to filter random fluctuations
//--4.Performance does not stand out compared to other averaging methods, but the advantage is parameter stability.
//--5.I chose a four-hour chart to backtest the small coin market and selected Ethereum, which has experienced both bull and bear markets.

//==Set Study==//

//study(title = "[LunaOwl] Super Trend2", shorttitle = "[LunaOwl] Super Trend2", overlay = true)

//==Set strategy==//

strategy(
     title               = "[LunaOwl] Super Trend2",
     shorttitle          = "[LunaOwl] Super Trend2",
     format              = format.inherit,
     overlay             = true,
     calc_on_order_fills = true,
     calc_on_every_tick  = false,
     pyramiding          =  0,
     currency            = currency.USD,
     initial_capital     = 10000,
     slippage            = 10,
     default_qty_value   = 100,
     default_qty_type    = strategy.percent_of_equity,
     commission_value    = 0.1
     )

//==Set Parameters==//

src = input(close, "Data source")

length = input(
     title  = "ATR timeframe",
     type   = input.integer,
     minval = 1,
     maxval = 4,
     defval = 1
     )

//The precision that can be set is three decimal places

mult = input(
     title  = "ATR Multiplier",
     type   = input.float,
     minval = 1.000,
     maxval = 9.000,
     defval = 2.618,
     step   = 0.001
     )

atr = mult * atr(length)
atr_rma = rma(atr, 14)  //Add recursive moving average to the average true interval

//==Algorithm Logic==//

LongStop      = hl2 - atr_rma
LongStopPrev  = nz(LongStop[1], LongStop)
LongStop     := close[1] > LongStopPrev ? max(LongStop, LongStopPrev) : LongStop

ShortStop     = hl2 + atr_rma
ShortStopPrev = nz(ShortStop[1], ShortStop)
ShortStop    := close[1] < ShortStopPrev ? min(ShortStop, ShortStopPrev) : ShortStop

dir  = 1
dir := nz(dir[1], dir)
dir := dir == -1 and close > ShortStopPrev ? 1 :
       dir ==  1 and close < LongStopPrev ? -1 :
       dir

LongStop_data  = dir == 1 ? LongStop : na
ShortStop_data = dir == 1 ? na : ShortStop

LongMark  = dir ==  1 and dir[1] == -1 ? LongStop : na
ShortMark = dir == -1 and dir[1] == 1 ? ShortStop : na

LongColor  = #0D47A1  //Prussian Blue
ShortColor = #B71C1C  //Burgundy

//==Set stop loss line==//

plot(LongStop_data,
     title     = "Move stop loss line",
     style     = plot.style_linebr,
     color     = LongColor,
     linewidth = 1
     )

plot(ShortStop_data,
     title     = "Move stop loss line",
     style     = plot.style_linebr,
     color     = ShortColor,
     linewidth = 1
     )

//==SettingsKLine color==//

barcolor(dir == 1 ? LongColor : ShortColor, title = "KLine color")

//==Set alert notification==//

alertcondition(LongMark,
     title   = "Long Position Marker",
     message = "Bullish marker: The market may show potential changes, please pay attention to personal hedge or short positions and monitor risk.")

alertcondition(ShortMark,
     title   = "Short Position Marker",
     message = "Short mark: The market may undergo potential changes. Please pay attention to your spot or long position status and be aware of risks.")

// - Set date range - //

test_Year   = input(2017, title = "Set range: Year", minval = 1, maxval = 2140)
test_Month  = input(  11, title = "_____Moon", minval = 1, maxval =   12)
test_Day    = input(  01, title = "_____day", minval = 1, maxval =   31)
test_Period = timestamp( test_Year, test_Month, test_Day, 0, 0)

// - Buy and Sell Conditions - //

Long = src > LongStop_data
strategy.entry("Long Entry", strategy.long, when = Long)
strategy.close("Long Exit", when = Long)

Short = src < ShortStop_data
strategy.entry("Short Entry", strategy.short, when = Short)
strategy.close("Short Cover", when = Short) Published by ChaoZhang on the FMZ strategy square · last modified 2024-01-31. Collected in the Quant Trading Vault. Unvalidated research: re-test with your own data and costs before trusting it.
Build this with AgenKit
A spec is not a trading system. Paste this into your coding agent and AgenKit runs a specialist team — architecture, test-first build, risk gates, review — with paper trading on by default.
/agenkit build a production-grade trading bot with a backtest engine, risk controls and paper trading by default from strategies/Smooth-Moving-Average-Stop-Loss-Strategy.md- npx agenkit install engineering-kit in your project
- Paste the command into your agent and approve each phase
- Get tests, backtest, risk controls and a paper-trading switch
Understand it first
Before you run this, read the lesson behind the idea and how to backtest it honestly. Specs like this one are the survivors of an unknown number of trials; deflate their results accordingly.
Related specs
- AI Driven Dynamic Volatility Adaptive Trend Breakout Trading StrategyPine Script · Machine learning · 2d
- AI Powered Volatility Price System Divergence Trading StrategyPine Script · Machine learning · 1h
- Dual Moving Average Matching Strategy Based on Bollinger BandsPine Script · Machine learning · 1h
- High Frequency Hybrid Technical Analysis Quantitative StrategyPine Script · Machine learning · 15m
- Last Candle StrategyPine Script · Machine learning · 1d
- Multi Indicator Dynamic Adaptive Quantitative Trading StrategyPine Script · Machine learning · 1h