SR Breakout Strategy
The SR Breakout Strategy is a support and resistance breakout strategy developed based on LonesomeTheBlue's breakout finder indicator. The main idea of this strategy is to generate long or short signals by judging…
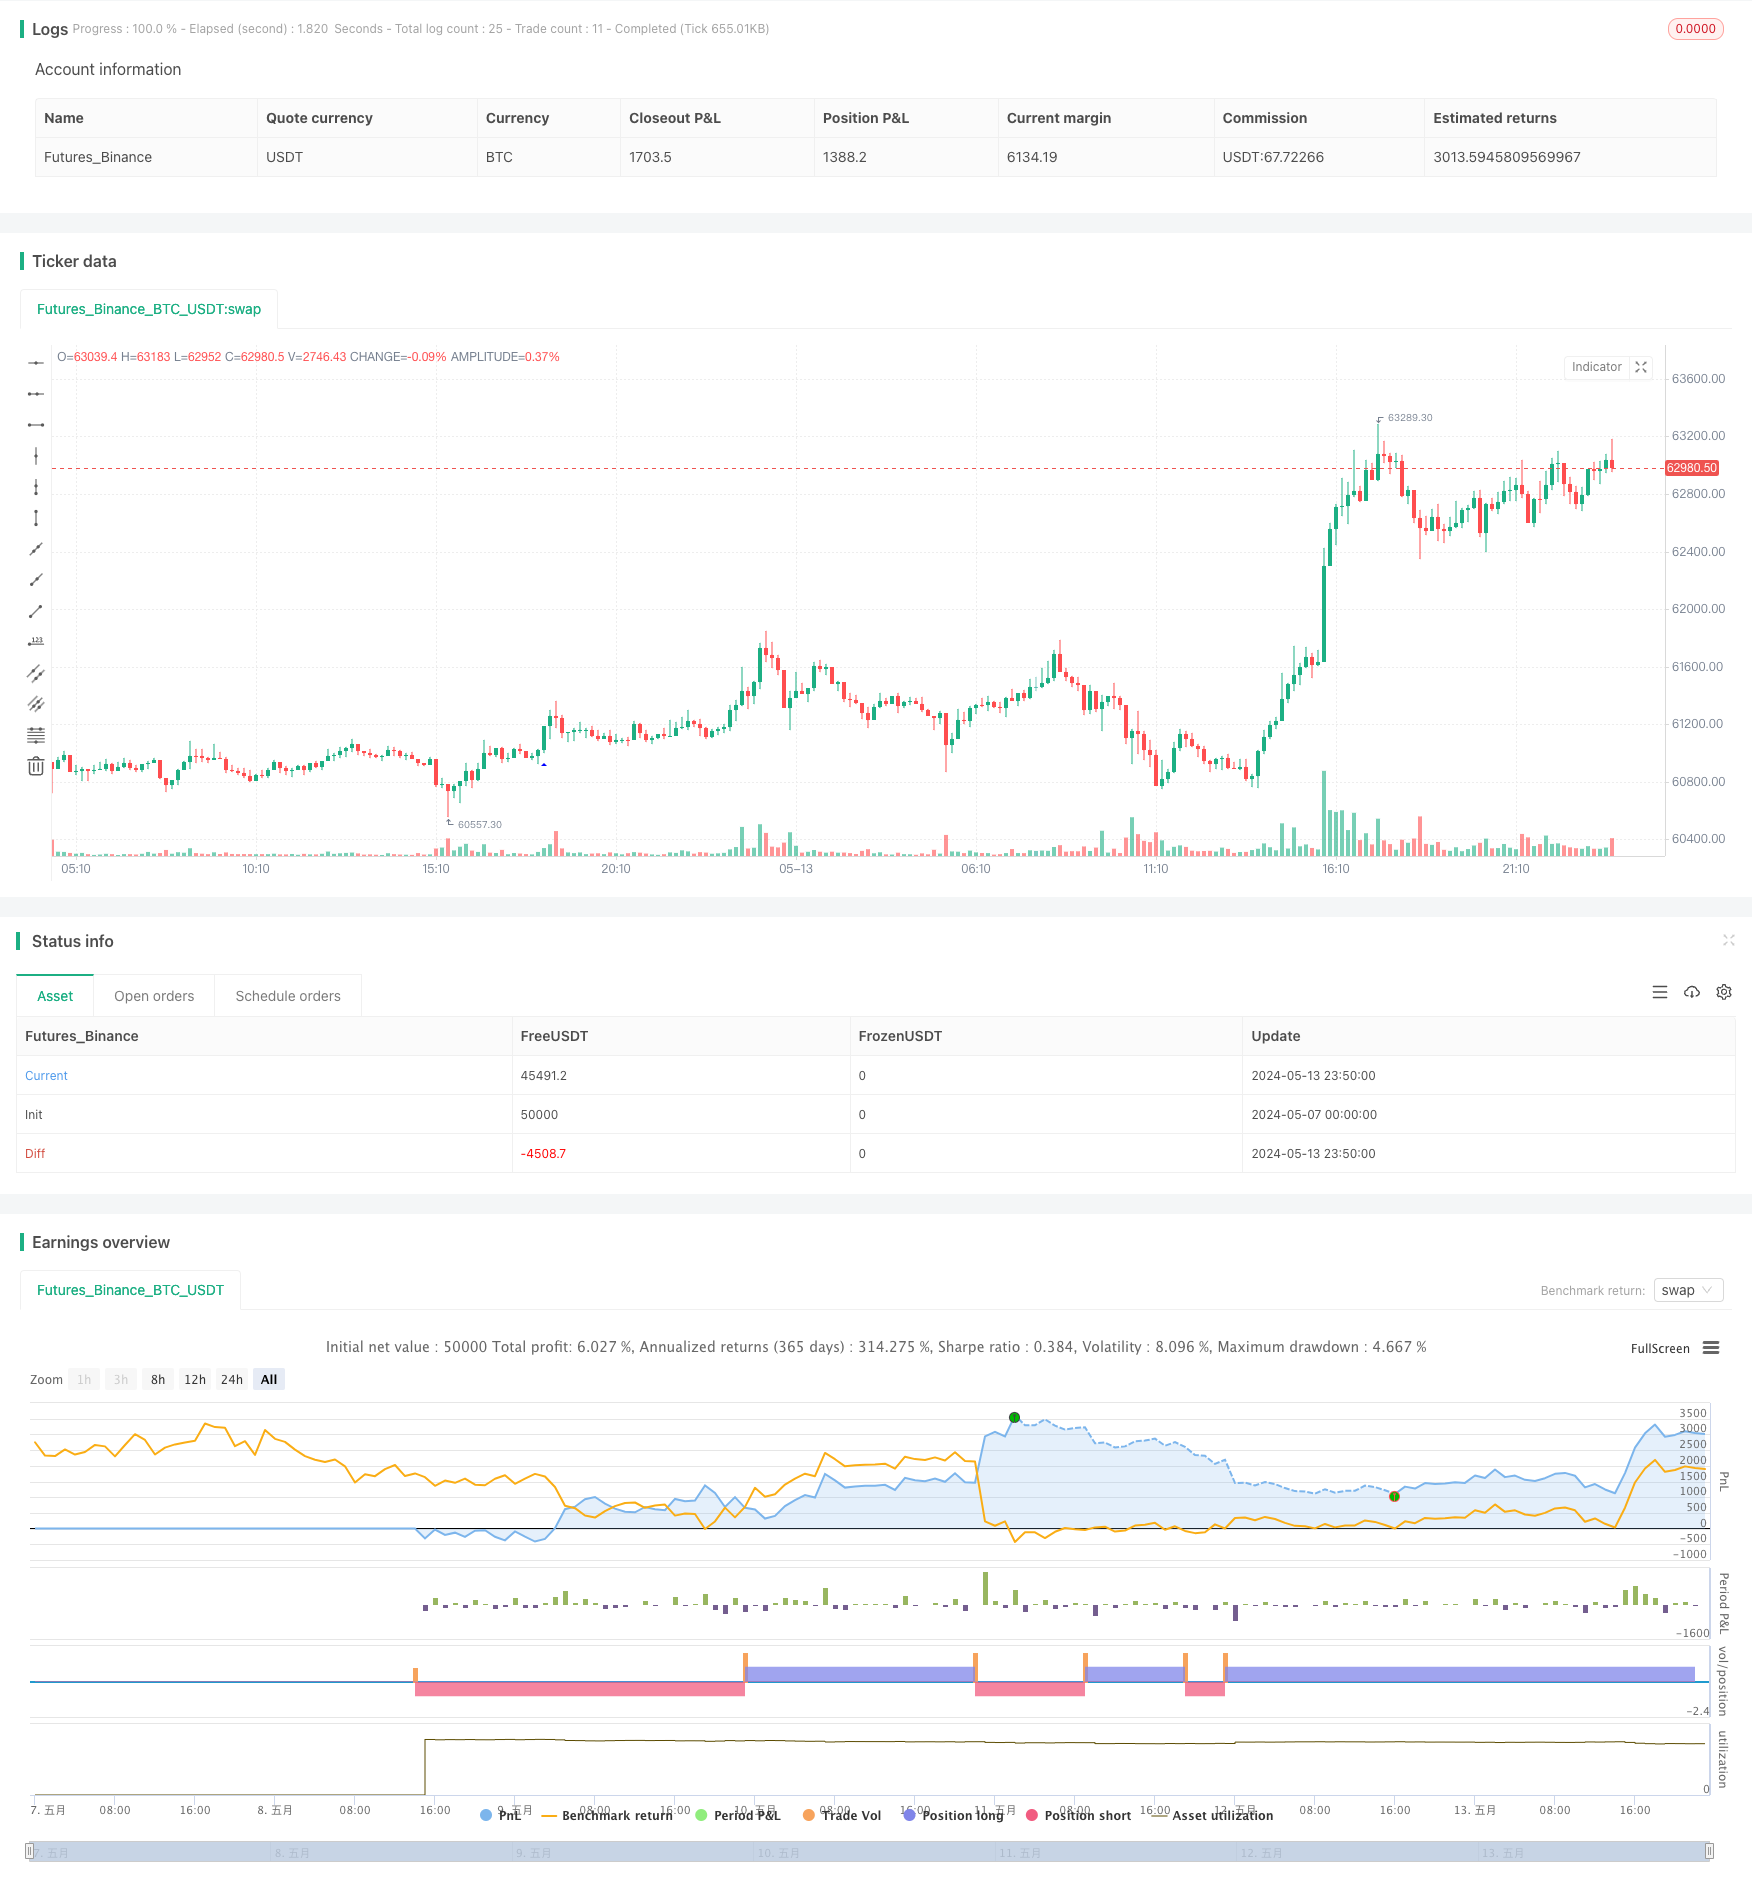
Overview
The SR Breakout Strategy is a support and resistance breakout strategy developed based on LonesomeTheBlue's breakout finder indicator. The main idea of this strategy is to generate long or short signals by judging whether the closing price breaks through the support or resistance level. The default settings are based on the 8-hour candlestick chart, but there are more optimal parameter settings on the 4-hour candlestick chart. This strategy uses the pivothigh and pivotlow functions to determine support and resistance levels, and uses the highest and lowest prices to determine breakouts. At the same time, this strategy also sets stop loss and take profit.
Strategy Principle
- Use the pivothigh and pivotlow functions to calculate the highs and lows over a certain period of time and store them in arrays.
- Determine whether the current closing price is higher than the resistance level. If so, it is judged as a bullish breakout and a long signal is generated.
- Determine whether the current closing price is lower than the support level. If so, it is judged as a bearish breakout and a short signal is generated.
- After generating a trading signal, calculate the stop loss and take profit prices based on the set stop loss and take profit ratios, and set the corresponding stop loss and take profit orders.
- Draw the corresponding breakout range according to the breakout direction.
Strategy Advantages
- Support and resistance breakout is a classic trading strategy with a certain practical basis.
- By using the pivothigh and pivotlow functions to calculate support and resistance levels, breakout opportunities can be captured relatively accurately.
- The code structure of this strategy is clear, and by storing highs and lows in arrays, it is convenient for backtesting and optimization.
- Stop loss and take profit are set, which can control risks relatively well.
Strategy Risks
- The support and resistance breakout strategy performs poorly in choppy markets and is prone to frequent false breakouts.
- Fixed stop loss and take profit ratios may not be able to adapt to different market conditions, resulting in an imbalance of risk and return.
- This strategy only considers price factors and does not consider other important indicators such as trading volume, which may miss some important signals.
Strategy Optimization Direction
- Consider introducing more technical indicators, such as trading volume, MACD, etc., to improve the accuracy and reliability of signals.
- For stop loss and take profit, consider using trailing stop or dynamic stop loss and take profit ratios to better adapt to different market conditions.
- Consider introducing filtering conditions, such as trend filtering, volatility filtering, etc., to reduce false breakouts in choppy markets.
- Consider optimizing support and resistance levels, such as using adaptive periods, introducing Fibonacci levels, etc.
Summary
The SR Breakout Strategy is a trading strategy based on the classic idea of support and resistance breakout. By using the pivothigh and pivotlow functions to calculate support and resistance levels, and by judging whether the closing price breaks through these levels to generate trading signals. The advantage of this strategy is that the idea is clear and easy to implement and optimize; at the same time, there are also some risks, such as poor performance in choppy markets, and the risks that may be brought about by fixed stop loss and take profit ratios. In the future, we can consider optimizing and improving this strategy from aspects such as technical indicators, stop loss and take profit, filtering conditions, support and resistance optimization, etc., to improve its stability and profitability.
Source Pine Script
/*backtest
start: 2024-05-07 00:00:00
end: 2024-05-14 00:00:00
period: 10m
basePeriod: 1m
exchanges: [{"eid":"Futures_Binance","currency":"BTC_USDT"}]
*/

// This source code is subject to the terms of the Mozilla Public License 2.0 at https://mozilla.org/MPL/2.0/
// © LonesomeTheBlue © chanu_lev10k

//@version=5
strategy('SR Breakout Strategy', overlay=true, max_bars_back=500, max_lines_count=400)
prd = input.int(defval=5, title='Period', minval=2)
bo_len = input.int(defval=71, title='Max Breakout Length', minval=30, maxval=300)
cwidthu = input.float(defval=3., title='Threshold Rate %', minval=1., maxval=10) / 100
mintest = input.int(defval=2, title='Minimum Number of Tests', minval=1)
bocolorup = input.color(defval=color.blue, title='Breakout Colors', inline='bocol')
bocolordown = input.color(defval=color.red, title='', inline='bocol')
// lstyle = input.string(defval=line.style_solid, title='Line Style')
issl = input.bool(title='SL', inline='linesl1', group='Stop Loss / Take Profit:', defval=false)
slpercent = input.float(title=', %', inline='linesl1', group='Stop Loss / Take Profit:', defval=18.0, minval=0.0, step=0.1)
istp = input.bool(title='TP', inline='linetp1', group='Stop Loss / Take Profit:', defval=false)
tppercent = input.float(title=', %', inline='linetp1', group='Stop Loss / Take Profit:', defval=18.0, minval=0.0, step=0.1)

//width
lll = math.max(math.min(bar_index, 300), 1)
float h_ = ta.highest(lll)
float l_ = ta.lowest(lll)
float chwidth = (h_ - l_) * cwidthu

// check if PH/PL
ph = ta.pivothigh(prd, prd)
pl = ta.pivotlow(prd, prd)

//keep Pivot Points and their locations in the arrays
var phval = array.new_float(0)
var phloc = array.new_int(0)
var plval = array.new_float(0)
var plloc = array.new_int(0)

// keep PH/PL levels and locations
if bool(ph)
    array.unshift(phval, ph)
    array.unshift(phloc, bar_index - prd)
    if array.size(phval) > 1  // cleanup old ones
        for x = array.size(phloc) - 1 to 1 by 1
            if bar_index - array.get(phloc, x) > bo_len
                array.pop(phloc)
                array.pop(phval)

if bool(pl)
    array.unshift(plval, pl)
    array.unshift(plloc, bar_index - prd)
    if array.size(plval) > 1  // cleanup old ones
        for x = array.size(plloc) - 1 to 1 by 1
            if bar_index - array.get(plloc, x) > bo_len
                array.pop(plloc)
                array.pop(plval)

// check bullish cup
float bomax = na
int bostart = bar_index
num = 0
hgst = ta.highest(prd)[1]
if array.size(phval) >= mintest and close > open and close > hgst
    bomax := array.get(phval, 0)
    xx = 0
    for x = 0 to array.size(phval) - 1 by 1
        if array.get(phval, x) >= close
            break
        xx := x
        bomax := math.max(bomax, array.get(phval, x))
        bomax
    if xx >= mintest and open <= bomax
        for x = 0 to xx by 1
            if array.get(phval, x) <= bomax and array.get(phval, x) >= bomax - chwidth
                num += 1
                bostart := array.get(phloc, x)
                bostart
        if num < mintest or hgst >= bomax
            bomax := na
            bomax

// if not na(bomax) and num >= mintest
//     line.new(x1=bar_index, y1=bomax, x2=bostart, y2=bomax, color=bocolorup)
//     line.new(x1=bar_index, y1=bomax - chwidth, x2=bostart, y2=bomax - chwidth, color=bocolorup)
//     line.new(x1=bostart, y1=bomax - chwidth, x2=bostart, y2=bomax, color=bocolorup)
//     line.new(x1=bar_index, y1=bomax - chwidth, x2=bar_index, y2=bomax, color=bocolorup)

plotshape(not na(bomax) and num >= mintest, location=location.belowbar, style=shape.triangleup, color=bocolorup, size=size.small)
//alertcondition(not na(bomax) and num >= mintest, title='Breakout', message='Breakout')

// check bearish cup
float bomin = na
bostart := bar_index
num1 = 0
lwst = ta.lowest(prd)[1]
if array.size(plval) >= mintest and close < open and close < lwst
    bomin := array.get(plval, 0)
    xx = 0
    for x = 0 to array.size(plval) - 1 by 1
        if array.get(plval, x) <= close
            break
        xx := x
        bomin := math.min(bomin, array.get(plval, x))
        bomin
    if xx >= mintest and open >= bomin
        for x = 0 to xx by 1
            if array.get(plval, x) >= bomin and array.get(plval, x) <= bomin + chwidth
                num1 += 1
                bostart := array.get(plloc, x)
                bostart
        if num1 < mintest or lwst <= bomin
            bomin := na
            bomin

// if not na(bomin) and num1 >= mintest
//     line.new(x1=bar_index, y1=bomin, x2=bostart, y2=bomin, color=bocolordown)
//     line.new(x1=bar_index, y1=bomin + chwidth, x2=bostart, y2=bomin + chwidth, color=bocolordown)
//     line.new(x1=bostart, y1=bomin + chwidth, x2=bostart, y2=bomin, color=bocolordown)
//     line.new(x1=bar_index, y1=bomin + chwidth, x2=bar_index, y2=bomin, color=bocolordown)

plotshape(not na(bomin) and num1 >= mintest, location=location.abovebar, style=shape.triangledown, color=bocolordown, size=size.small)

//alertcondition(not na(bomin) and num1 >= mintest, title='Breakdown', message='Breakdown')
//alertcondition(not na(bomax) and num >= mintest or not na(bomin) and num1 >= mintest, title='Breakout or Breakdown', message='Breakout or Breakdown')

// Long Short conditions
longCondition = not na(bomax) and num >= mintest
if longCondition
    strategy.entry('Long', strategy.long)
shortCondition = not na(bomin) and num1 >= mintest
if shortCondition
    strategy.entry('Short', strategy.short)

// Entry price / Take Profit / Stop Loss
//entryprice = strategy.position_avg_price
entryprice = ta.valuewhen(condition=longCondition or shortCondition, source=close, occurrence=0)
pm = longCondition ? 1 : shortCondition ? -1 : 1 / math.sign(strategy.position_size)
takeprofit = entryprice * (1 + pm * tppercent * 0.01)
stoploss = entryprice * (1 - pm * slpercent * 0.01)
strategy.exit(id='Exit Long', from_entry='Long', stop=issl ? stoploss : na, limit=istp ? takeprofit : na, alert_message='Exit Long')
strategy.exit(id='Exit Short', from_entry='Short', stop=issl ? stoploss : na, limit=istp ? takeprofit : na, alert_message='Exit Short')Published by ChaoZhang on the FMZ strategy square · last modified 2024-05-15. Collected in the Quant Trading Vault. Unvalidated research: re-test with your own data and costs before trusting it.
Build this with AgenKit
A spec is not a trading system. Paste this into your coding agent and AgenKit runs a specialist team — architecture, test-first build, risk gates, review — with paper trading on by default.
/agenkit build a production-grade trading bot with a backtest engine, risk controls and paper trading by default from strategies/SR-Breakout-Strategy.md- npx agenkit install engineering-kit in your project
- Paste the command into your agent and approve each phase
- Get tests, backtest, risk controls and a paper-trading switch
Understand it first
Before you run this, read the lesson behind the idea and how to backtest it honestly. Specs like this one are the survivors of an unknown number of trials; deflate their results accordingly.
Related specs
- Bollinger Bands Dynamic Breakout StrategyPine Script · Breakout · 1h
- Kana Candle Breakout Strategy Based on Moving Average and Support ResistancePine Script · Breakout · 1h
- Momentum Breakout Moving Average StrategyPine Script · Breakout · 1d
- Moving Average Crossover and Upper Rail Breakthrough Impulse StrategyPine Script · Breakout · 1m
- Moving Average Support and Resistance Breakout StrategyPine Script · Breakout · 1d
- Multi Indicator Short Term Algorithmic Trading StrategyPine Script · Breakout · 4h