Strategy vault / Trend following
Super Trend Triple Strategy
The Super Trend Triple strategy is a trend following strategy based on multiple time frame Super Trend indicators and moving average. It can effectively identify trend direction, enter timely when a trend is forming…
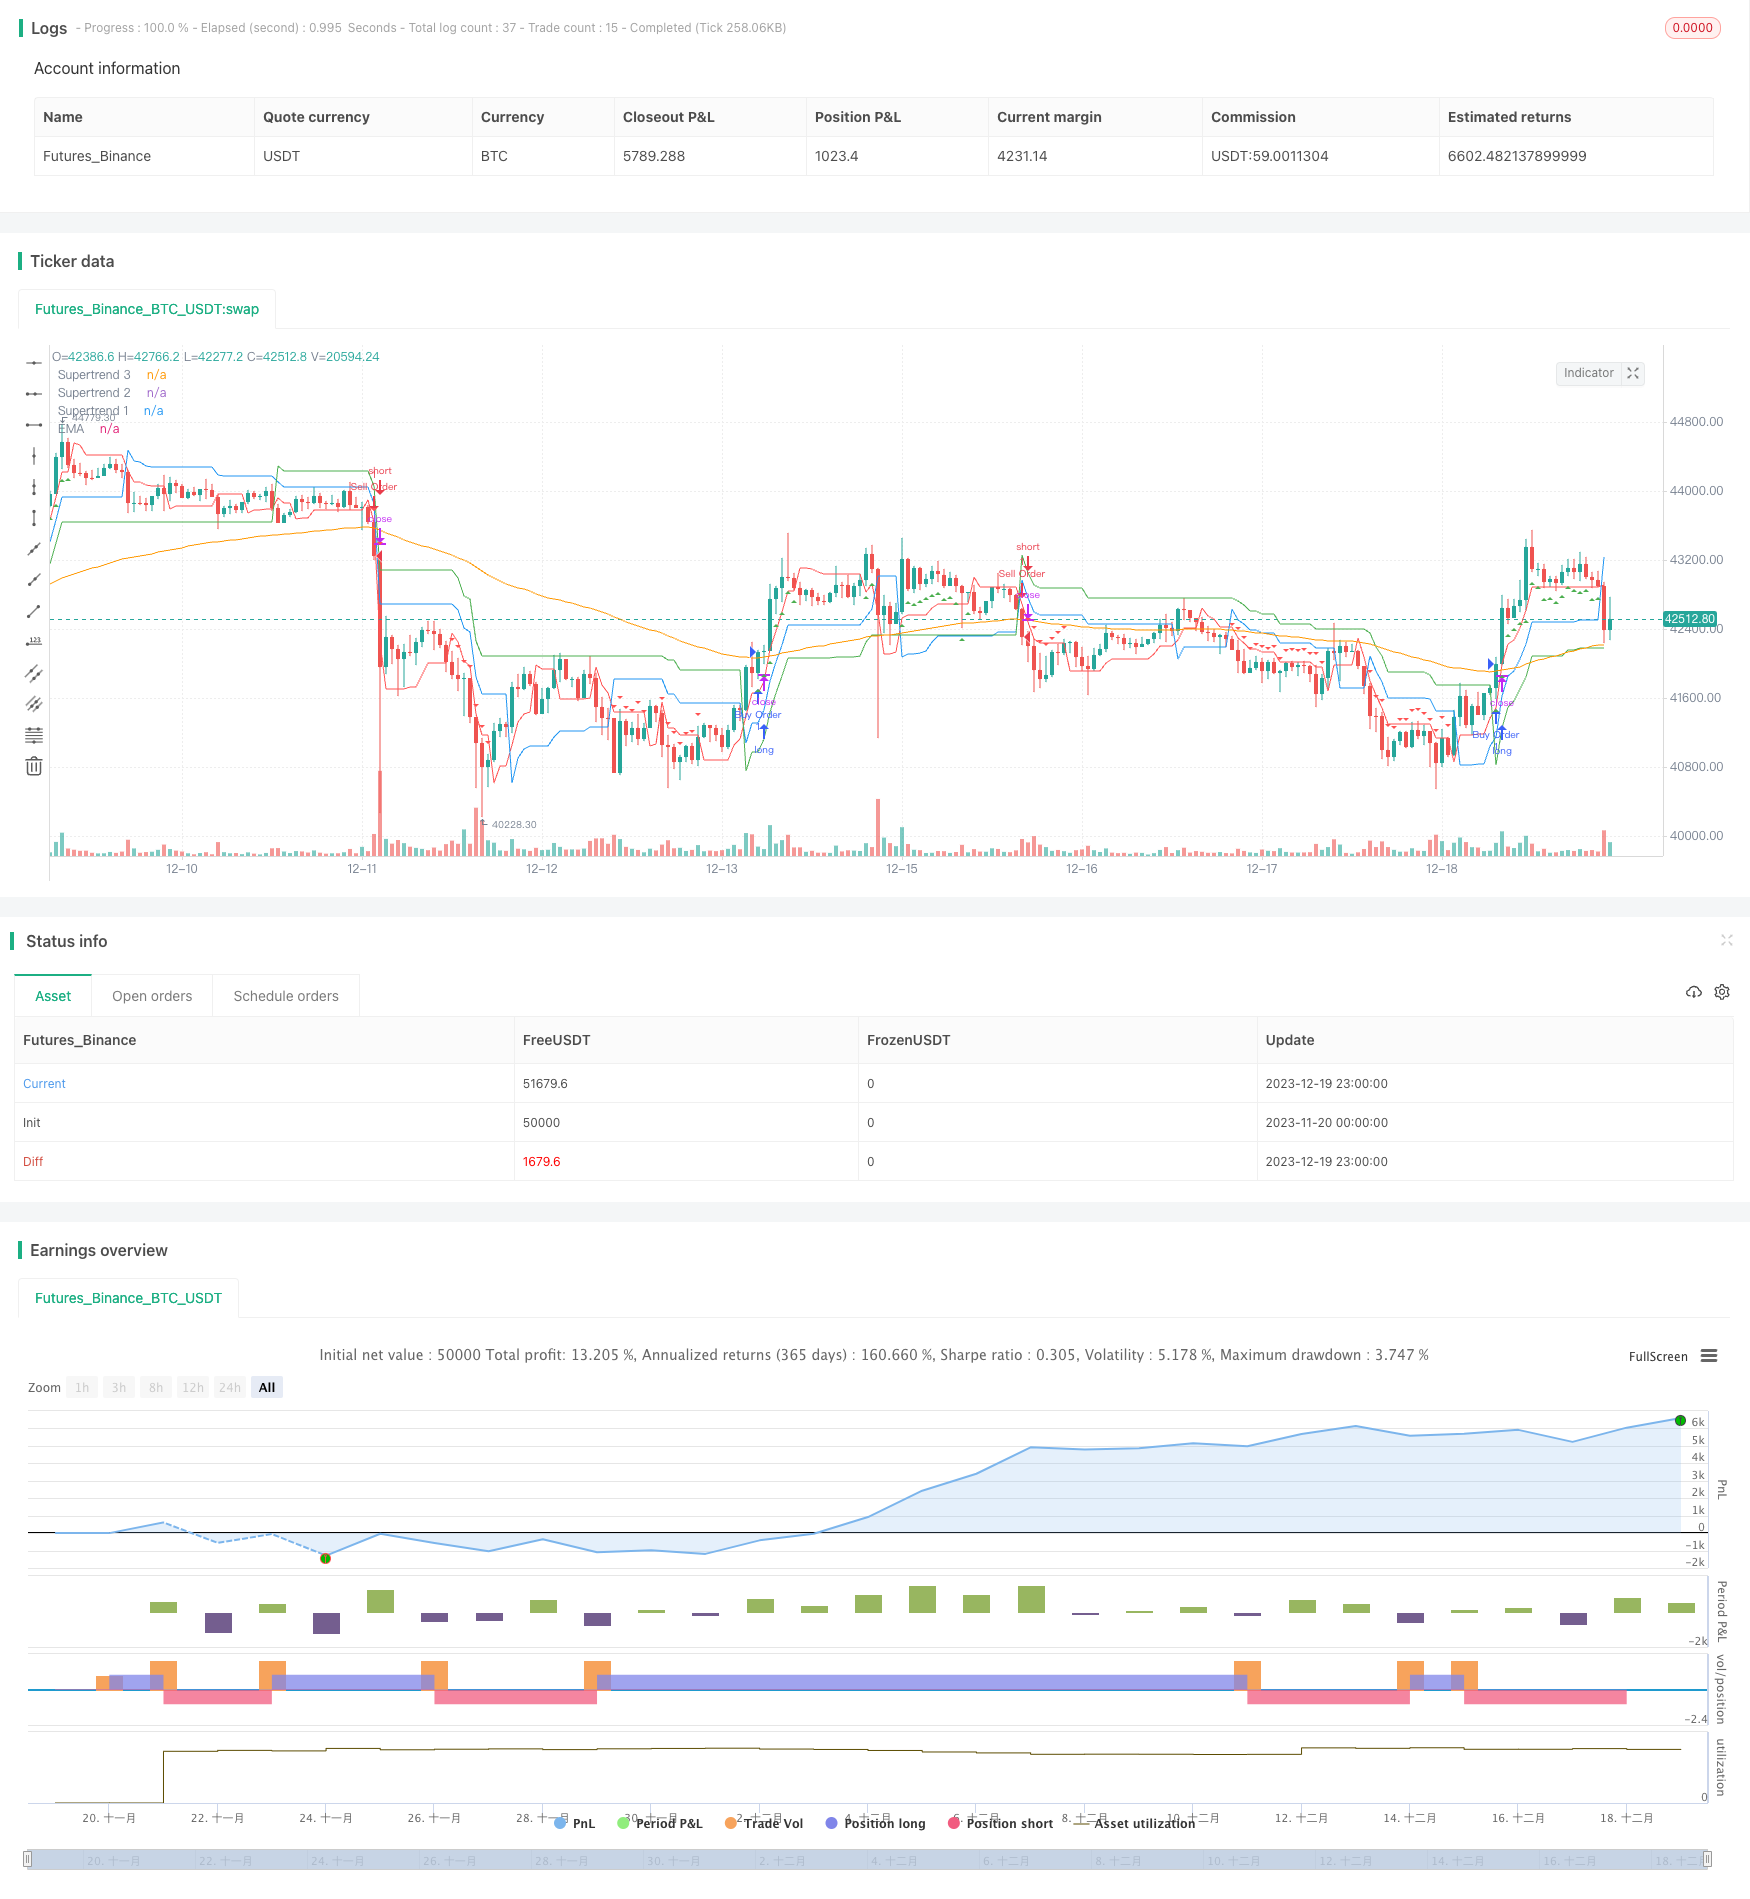
Overview
The Super Trend Triple strategy is a trend following strategy based on multiple time frame Super Trend indicators and moving average. It can effectively identify trend direction, enter timely when a trend is forming, and exit timely when a trend is reversing, thus profiting. Compared with single Super Trend strategies, the Super Trend Triple strategy can depict market trends more accurately and avoid losses caused by false breakouts.
Strategy Logic
The strategy adopts three Super Trend indicators with different parameter settings at the same time: Super Trend 1, Super Trend 2 and Super Trend 3. Their periods range from long to short, which are input parameters supertrend1_period, supertrend2_period and supertrend3_period respectively. The three Super Trend indicators work with the moving average line EMA. The specific logic is:
Long entry signal: when close price is higher than all three Super Trend lines and the moving average line, go long.
Short entry signal: when close price is lower than all three Super Trend lines and the moving average line, go short.
Thus, Super Trend indicators with different periods can verify each other to avoid misinterpreting market trends. The addition of the moving average line EMA can filter out some false breakouts.
Strategy Strengths
Using a triple Super Trend system can judge trends more accurately and avoid being misled by false breakouts.
Super Trend indicators with different parameter settings verify each other, making the strategy more reliable.
Adding a moving average line filter can further avoid noise from small cycles.
The strategy participates reasonably, can both follow trends to profit and exit in time to control risks.
Strategy Risks and Solutions
Super Trend indicators have lagging effect, which may lead to slightly late entry timing. Parameters can be adjusted accordingly or other leading indicators can be added.
Moving average lines as filters also have lagging issues. Other smoothing indicators such as EMA and momentum indicators can be tested to replace.
Potential larger losses during trend reversal. Stop loss can be set or additional indicators can be added to judge potential reversal.
Improper parameter settings may also affect strategy performance. Sufficient backtesting and optimization is needed to find the optimal parameter combination.
Directions for Strategy Optimization
Test adding other trend judging indicators such as MACD, DMI etc to verify the accuracy of trend judgment.
Try auto optimizing parameters to make the periods and multipliers of Super Trends self-adaptive to different market environments.
Set dynamic stop loss and take profit criteria so that the strategy can automatically adjust risk-reward ratio according to real-time fluctuations.
Optimize parameters of moving average line or introduce other indicators to filter false breakout signals.
Test running strategies over longer time frames (daily, weekly etc) to judge its effectiveness in capturing major trends.
Conclusion
The Super Trend Triple strategy adopts three Super Trend indicators with different parameters simultaneously to verify the trend direction, and combines moving average lines for filtration. It can effectively identify trends, enter timely, avoid false breakouts and is hence a reliable trend following strategy. The strategy can be upgraded in various ways including parameter optimization, stop loss mechanism improvements and integrating other indicators. By controlling risks while capturing mid-to-long term trends with optimization space, it has broad room for optimization.
Parameters
| Name | Default | What it controls |
|---|---|---|
| v_input_int_1 | 3 | Supertrend 1 Period |
| v_input_int_2 | 12 | Supertrend 1 Multiplier |
| v_input_int_3 | 2 | Supertrend 2 Period |
| v_input_int_4 | 11 | Supertrend 2 Multiplier |
| v_input_int_5 | true | Supertrend 3 Period |
| v_input_int_6 | 10 | Supertrend 3 Multiplier |
| v_input_int_7 | 100 | EMA Length |
Source Pine Script
/*backtest
start: 2023-11-20 00:00:00
end: 2023-12-20 00:00:00
period: 1h
basePeriod: 15m
exchanges: [{"eid":"Futures_Binance","currency":"BTC_USDT"}]
*/

//@version=5
strategy("Triple Supertrend Strategy", shorttitle = "TSS", overlay = true, pyramiding = 1) // Added pyramiding = 1

// Define input settings for Supertrend indicators
supertrend1_period = input.int(3, title = "Supertrend 1 Period")
supertrend1_multiplier = input.int(12, title = "Supertrend 1 Multiplier")
supertrend2_period = input.int(2, title = "Supertrend 2 Period")
supertrend2_multiplier = input.int(11, title = "Supertrend 2 Multiplier")
supertrend3_period = input.int(1, title = "Supertrend 3 Period")
supertrend3_multiplier = input.int(10, title = "Supertrend 3 Multiplier")

// EMA settings with user-defined length
ema_length = input.int(100, title = "EMA Length")

// Calculate Supertrend values for all three indicators
[supertrend1_value, _] = ta.supertrend(supertrend1_period, supertrend1_multiplier)
[supertrend2_value, _] = ta.supertrend(supertrend2_period, supertrend2_multiplier)
[supertrend3_value, _] = ta.supertrend(supertrend3_period, supertrend3_multiplier)

// Calculate EMA
ema = ta.ema(close, ema_length)

// Define long entry condition
longCondition = close > ema and close > supertrend1_value and close > supertrend2_value and close > supertrend3_value

// Define short entry condition
shortCondition = close < ema and close < supertrend1_value and close < supertrend2_value and close < supertrend3_value

// Strategy orders
if (longCondition)
    strategy.entry("Buy Order", strategy.long)
if (shortCondition)
    strategy.entry("Sell Order", strategy.short)

// Plot Supertrends and EMA for reference
plot(supertrend1_value, title="Supertrend 1", color=color.green)
plot(supertrend2_value, title="Supertrend 2", color=color.blue)
plot(supertrend3_value, title="Supertrend 3", color=color.red)
plot(ema, title="EMA", color=color.orange)

// Plot strategy entry signals
plotshape(series=longCondition, title="Long Entry Signal", location=location.belowbar, color=color.green, style=shape.triangleup, size=size.small)
plotshape(series=shortCondition,title="Short Entry Signal", location=location.abovebar,color=color.red ,style=shape.triangledown,size=size.small)
Published by ChaoZhang on the FMZ strategy square · last modified 2023-12-21. Collected in the Quant Trading Vault. Unvalidated research: re-test with your own data and costs before trusting it.
Build this with AgenKit
A spec is not a trading system. Paste this into your coding agent and AgenKit runs a specialist team — architecture, test-first build, risk gates, review — with paper trading on by default.
/agenkit build a production-grade trading bot with a backtest engine, risk controls and paper trading by default from strategies/Super-Trend-Triple-Strategy.md- npx agenkit install engineering-kit in your project
- Paste the command into your agent and approve each phase
- Get tests, backtest, risk controls and a paper-trading switch
Understand it first
Before you run this, read the lesson behind the idea and how to backtest it honestly. Specs like this one are the survivors of an unknown number of trials; deflate their results accordingly.
Related specs
- Multi Indicator Dynamic Trend Following Strategy Based on EMA and SMAPine Script · Trend following · 1d
- Dual EMA Crossover Trend Following Strategy with ATR and ADX FiltersPine Script · Trend following · 1d
- EMA MACD SuperTrend ADX ATR Multi Indicator Trading Signal StrategyPine Script · Trend following · 1d
- Dual EMA Crossover Oscillation Tracking StrategyPine Script · Trend following · 5m
- EMA SMA Multi Indicator Comprehensive Trend Following StrategyPine Script · Trend following · 1h
- Supertrend Advance StrategyPine Script · Trend following · 5m