Strategy vault / Trend following
Super Z Quantitative Trend Strategy
The Super Z quantitative trend strategy is a trend tracking strategy based on quantitative indicators. The strategy uses custom indicators combined with the Super Trend indicator to determine and track trends.
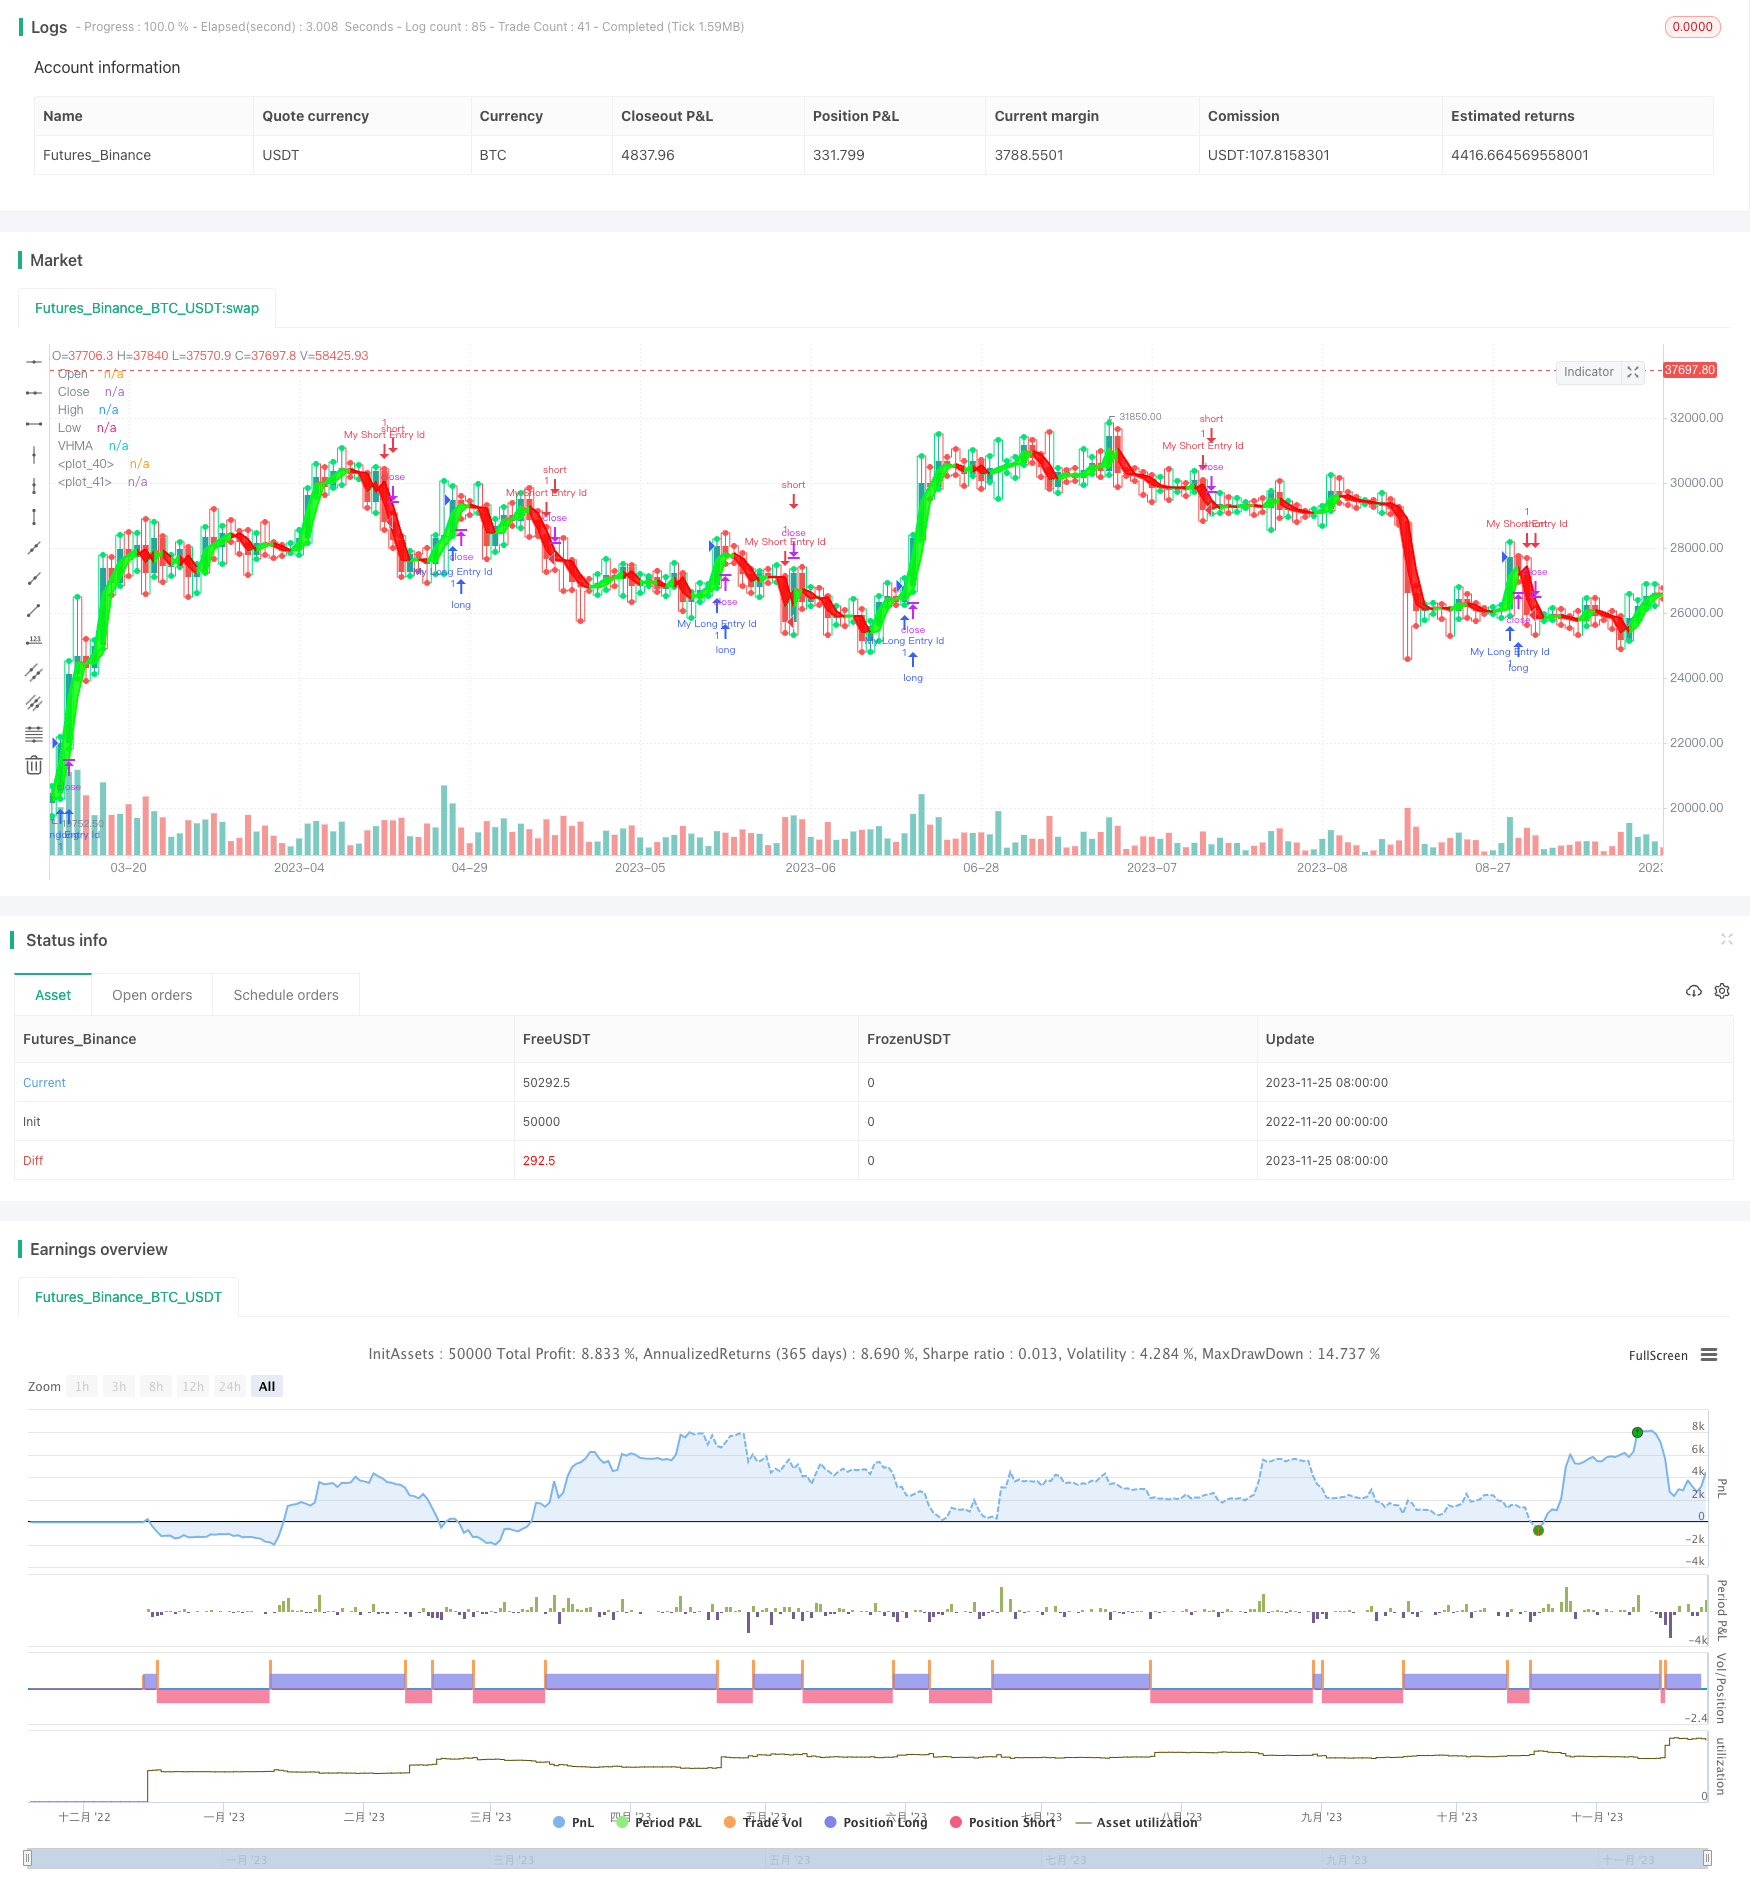
Overview
The Super Z quantitative trend strategy is a trend tracking strategy based on quantitative indicators. The strategy uses custom indicators combined with the Super Trend indicator to determine and track trends.
Strategy Principle
The core indicator of this strategy is the custom quantitative indicator VHMA. The VHMA indicator is calculated based on the Hull Moving Average line. By applying the square root function to smooth the Hull MA, it forms a curve with good smoothness. The VHMA curve can judge the direction of the price trend. When VHMA rises, it represents that the price is in an upward trend. When it falls, it represents a downward trend in prices.
The strategy also incorporates the Super Trend indicator. The Super Trend indicator can discover longer-cycle price trends to assist the VHMA indicator in determining the trend direction. When the price breaks through the Super Trend line, it represents a trend reversal.
Therefore, this strategy uses the VHMA indicator to judge the short-term trend direction, aided by the Super Trend indicator to determine the long-term trend turning point, realizing the tracking of the overall trend. The specific trading logic is to issue trading signals when breaking through the Super Trend line.
Advantage Analysis
This strategy has the following advantages:
The VHMA indicator has strong smoothness and can reduce false signals. It can accurately and reliably judge the trend direction;
Combined with the Super Trend indicator, it can promptly discover long-term trend reversals and grasp the timing of buys and sells;
Use different color solid K-lines and hollow K-lines to depict the size relationship between the closing price and opening price to form a visual indicator to assist in judging the trend;
Adopt multi-timeframe design, which can determine the trend direction on senior timeframes and issue trading signals on junior timeframes to achieve efficient filtering;
The strategy parameters are optimized for stability and are suitable for various market environments.
Risk Analysis
The strategy also has the following risks:
Quantitative indicators have backtesting effects, and actual effects may be weaker than backtests;
Improper setting of Super Trend indicator parameters may lead to missed trading opportunities or unnecessary trades;
Multi-timeframe designs may also fail under actual trading conditions.
Countermeasures:
Increase slippage settings and optimize parameters to reduce backtest effects;
Adjust Super Trend indicator parameters and optimize parameter settings;
Test multiple timeframe matching methods to ensure multi-timeframe stability.
Optimization Direction
The strategy can be optimized in the following aspects:
Test different smoothed moving average indicators to replace the VHMA indicator;
Try different trend indicators to replace the Super Trend indicator;
Increase machine learning model training indicator parameters.
These optimization measures can improve the adaptability of strategies to complex market conditions.
Summary
The Super Z quantitative trend strategy realizes the judgment and tracking of price trends through the custom trend indicator VHMA combined with the Super Trend indicator. The strategy has good stability and excellent actual effects. Through continuous testing and optimization, this strategy has the potential to become an efficient and stable quantitative trend tracking strategy.
Parameters
| Name | Default | What it controls |
|---|---|---|
| v_input_1_close | 0 | src5: close | high | low | open | hl2 | hlc3 | hlcc4 | ohlc4 |
| v_input_2 | 1440 | tf |
| v_input_3 | D | res5 |
| v_input_4 | true | SuperTrend Multiplier |
| v_input_5 | 50 | SuperTrend Period |
| v_input_6 | false | signal |
Source Pine Script
/*backtest
start: 2022-11-20 00:00:00
end: 2023-11-26 00:00:00
period: 1d
basePeriod: 1h
exchanges: [{"eid":"Futures_Binance","currency":"BTC_USDT"}]
*/

// This source code is subject to the terms of the Mozilla Public License 2.0 at https://mozilla.org/MPL/2.0/
//Original script
//https://www.tradingview.com/script/wYknDlLx-super-Z/

//@version=4
strategy("Super Z strategy - Thanks to Rafael Zioni", shorttitle="Super Z strategy",overlay=true )
src5 = input(close)

tf = input(1440)
len5 = timeframe.isintraday and timeframe.multiplier >= 1 ?
   tf / timeframe.multiplier * 7 :
   timeframe.isintraday and timeframe.multiplier < 60 ?
   60 / timeframe.multiplier * 24 * 7 : 7

ma = ema(src5*volume, len5) / ema(volume, len5)


//script taken from https://www.tradingview.com/script/kChCRRZI-Hull-Moving-Average/

src1 = ma

p(src1, len5) =>
    n = 0.0
    s = 0.0
    for i = 0 to len5 - 1
        w = (len5 - i) * len5
        n := n + w
        s := s + src5[i] * w
    s / n

hm = 2.0 * p(src1, floor(len5 / 2)) - p(src1, len5)
vhma = p(hm, floor(sqrt(len5)))
lineColor = vhma > vhma[1] ? color.lime : color.red
plot(vhma, title="VHMA", color=lineColor ,linewidth=3)
hColor = true,vis = true
hu = hColor ? (vhma > vhma[2] ? #00ff00 : #ff0000) : #ff9800

vl = vhma[0]
ll = vhma[1]
m1 = plot(vl, color=hu, linewidth=1, transp=60)
m2 = plot(vis ? ll : na,  color=hu, linewidth=2, transp=80)

fill(m1, m2,  color=hu, transp=70)
//

b = timeframe.isintraday and timeframe.multiplier >= 1 ?
   60 / timeframe.multiplier * 7 :
   timeframe.isintraday and timeframe.multiplier < 60 ?
   60 / timeframe.multiplier * 24 * 7 : 7


//
res5 = input("D", type=input.resolution)

o = security(syminfo.tickerid, res5, open, barmerge.gaps_off, barmerge.lookahead_on)
c = security(syminfo.tickerid, res5, close, barmerge.gaps_off, barmerge.lookahead_on)
hz = security(syminfo.tickerid, res5, high, barmerge.gaps_off, barmerge.lookahead_on)
l = security(syminfo.tickerid, res5, low, barmerge.gaps_off, barmerge.lookahead_on)


col = c >= o ? color.lime : color.red

ppo = plot(b ? o >= c ? hz : l : o, color=col, title="Open", style=plot.style_stepline, transp=100)
ppc = plot(b ? o <= c ? hz : l : c, color=col, title="Close", style=plot.style_stepline, transp=100)

plot(b and hz > c ? hz : na, color=col, title="High", style=plot.style_circles, linewidth=2,transp=60)
plot(b and l < c ? l : na, color=col, title="Low", style=plot.style_circles,linewidth=2, transp=60)

fill(ppo, ppc, col)

//
// INPUTS //
st_mult   = input(1,   title = 'SuperTrend Multiplier', minval = 0, maxval = 100, step = 0.01)
st_period = input(50, title = 'SuperTrend Period',     minval = 1)

// CALCULATIONS //
up_lev =l - (st_mult * atr(st_period))
dn_lev = hz + (st_mult * atr(st_period))

up_trend   = 0.0
up_trend   := c[1] > up_trend[1]   ? max(up_lev, up_trend[1])   : up_lev

down_trend = 0.0
down_trend := c[1] < down_trend[1] ? min(dn_lev, down_trend[1]) : dn_lev

// Calculate trend var
trend = 0
trend := c > down_trend[1] ? 1: c < up_trend[1] ? -1 : nz(trend[1], 1)

// Calculate SuperTrend Line
st_line = trend ==1 ? up_trend : down_trend

// Plotting
//plot(st_line[1], color = trend == 1 ? color.green : color.red , style = plot.style_cross, linewidth = 2, title = "SuperTrend")
buy=crossover( c, st_line)
sell=crossunder(c, st_line)
signal=input(false)

/////////////// Plotting ///////////////
plotshape(signal and buy, style=shape.triangleup, size=size.normal, location=location.belowbar, color=color.lime)
plotshape(signal and sell, style=shape.triangledown, size=size.normal, location=location.abovebar, color=color.red)


if (buy)
    strategy.entry("My Long Entry Id", strategy.long)

if (sell)
strategy.entry("My Short Entry Id", strategy.short)Published by ChaoZhang on the FMZ strategy square · last modified 2023-11-27. Collected in the Quant Trading Vault. Unvalidated research: re-test with your own data and costs before trusting it.
Build this with AgenKit
A spec is not a trading system. Paste this into your coding agent and AgenKit runs a specialist team — architecture, test-first build, risk gates, review — with paper trading on by default.
/agenkit build a production-grade trading bot with a backtest engine, risk controls and paper trading by default from strategies/Super-Z-Quantitative-Trend-Strategy.md- npx agenkit install engineering-kit in your project
- Paste the command into your agent and approve each phase
- Get tests, backtest, risk controls and a paper-trading switch
Understand it first
Before you run this, read the lesson behind the idea and how to backtest it honestly. Specs like this one are the survivors of an unknown number of trials; deflate their results accordingly.
Related specs
- Dynamic Trend Following SuperTrend Triple Enhancement StrategyPine Script · Trend following · 1d
- Multi Indicator Dynamic Trend Following Strategy Based on EMA and SMAPine Script · Trend following · 1d
- Supertrend Advance StrategyPine Script · Trend following · 5m
- Supertrend and Moving Average Crossover StrategyPine Script · Trend following · 2h
- Trend Following Strategy Based on PMax IndicatorPine Script · Trend following · 5m
- Trend Tracking and Short term Trading Strategy Based on ADX IndicatorPine Script · Trend following · 1d