Strategy vault / Trend following
SuperTrend and DEMA Based Trend Following Strategy
This strategy combines the SuperTrend indicator and the DEMA indicator to implement a trend following trading strategy. It generates buy signals when the price breaks through the upper band and sell signals when the…
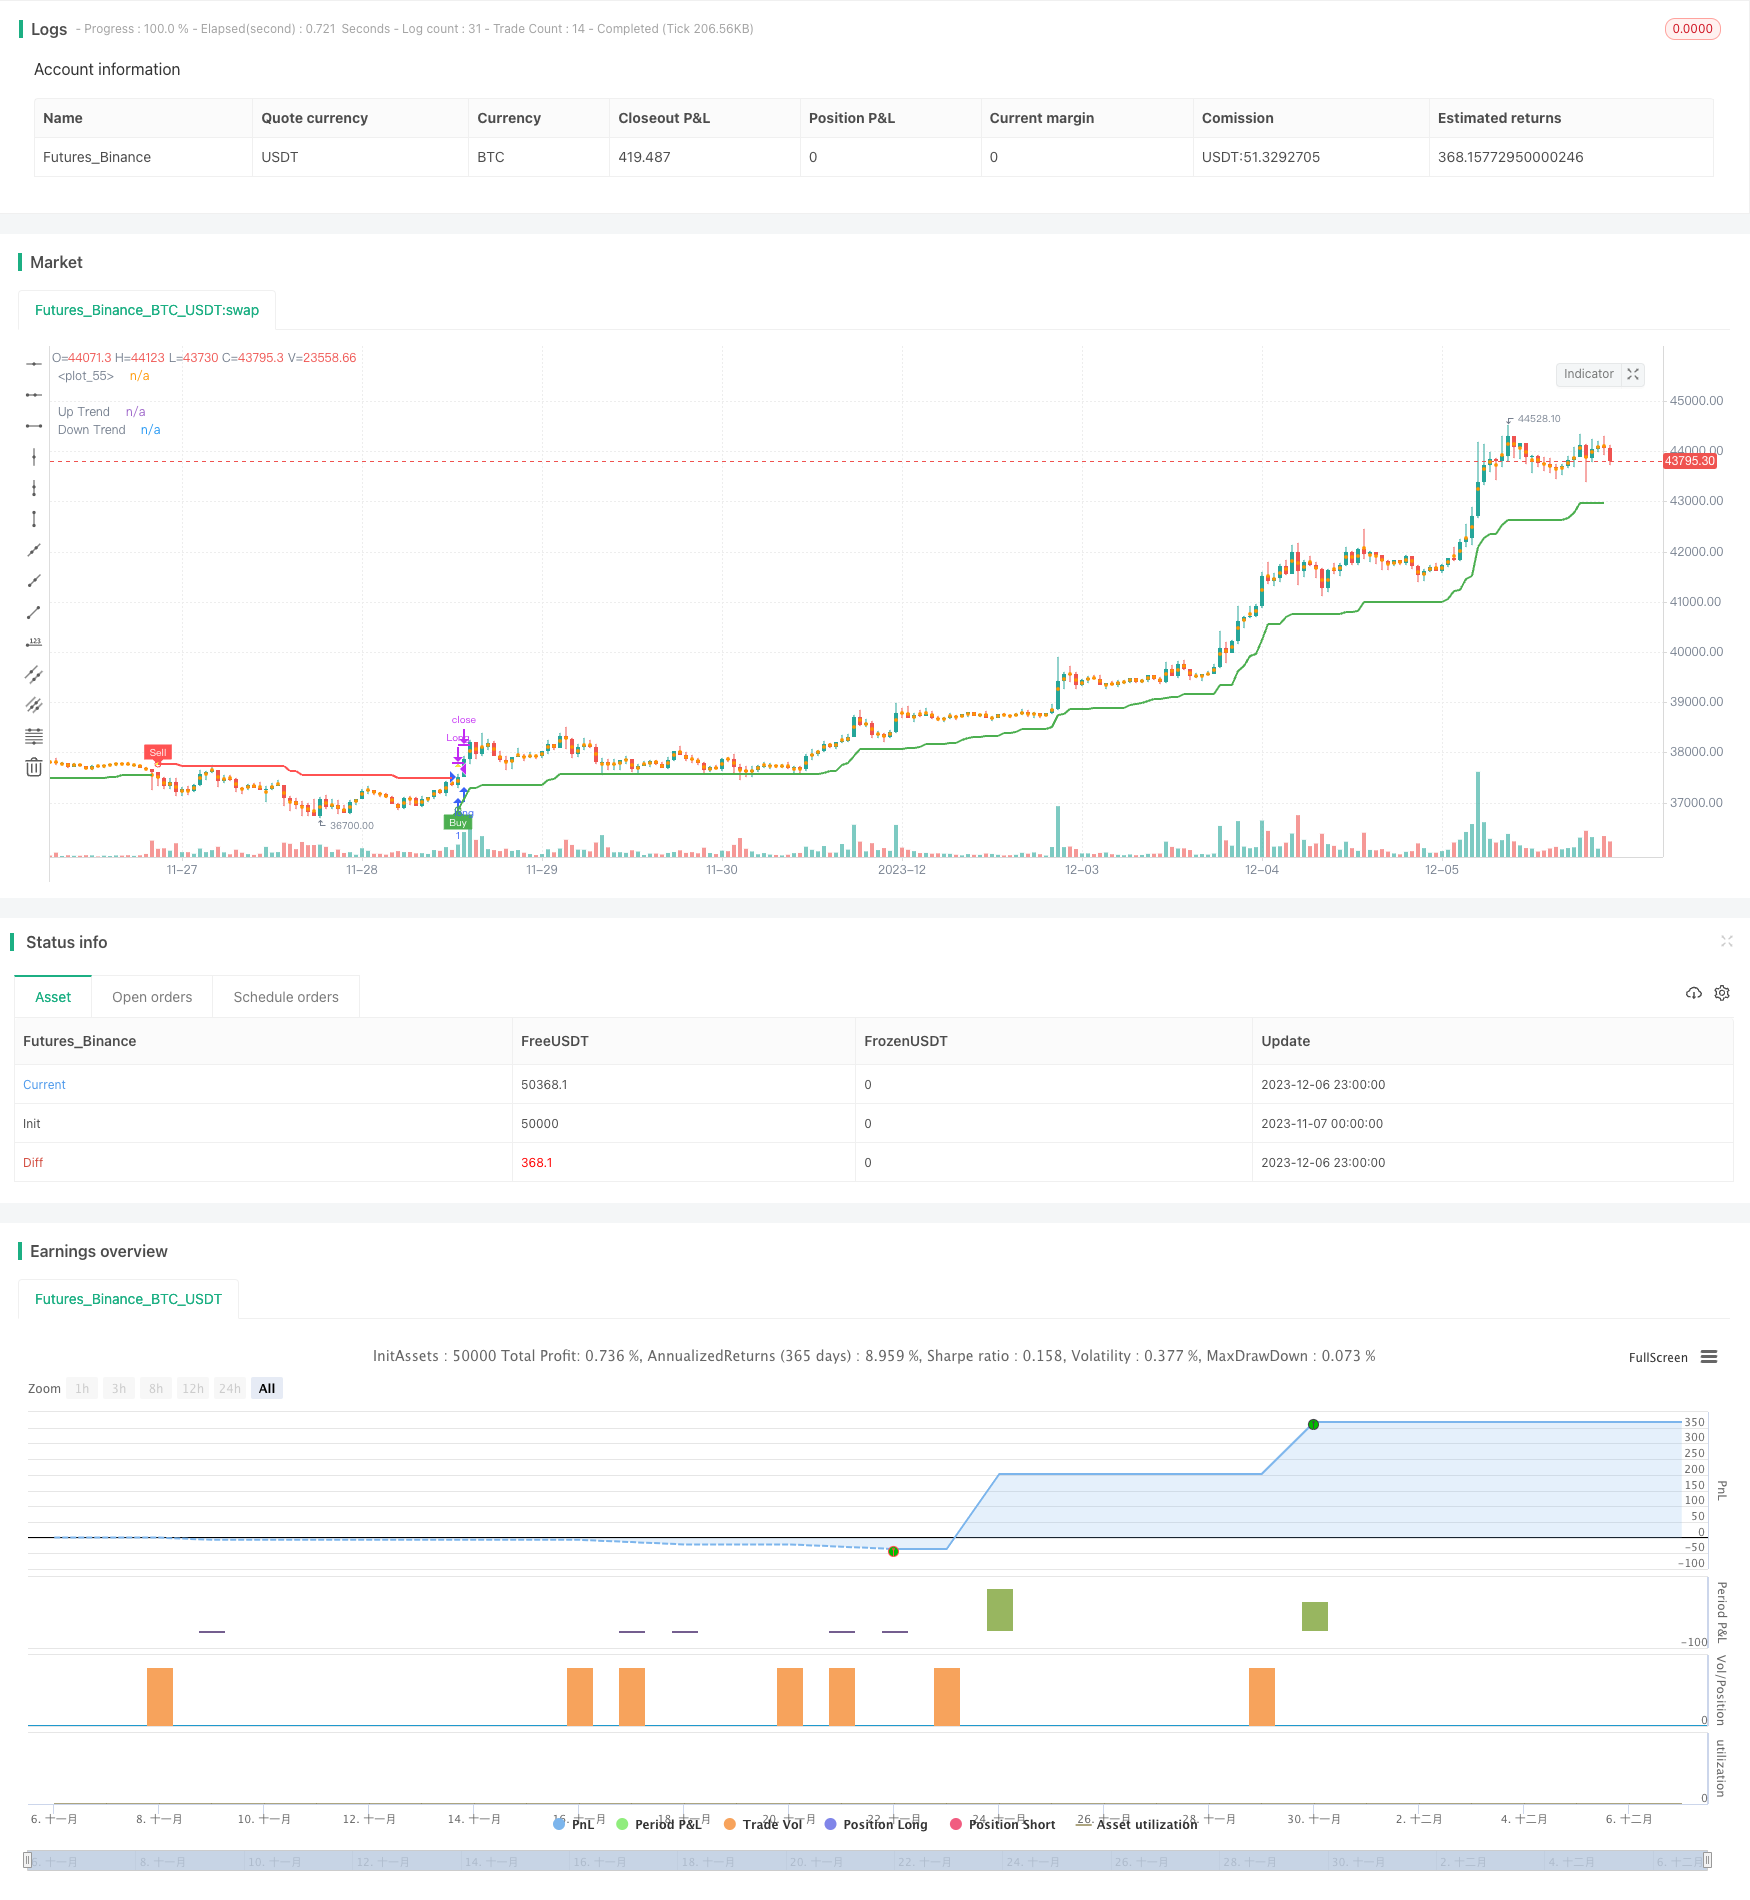
Overview
This strategy combines the SuperTrend indicator and the DEMA indicator to implement a trend following trading strategy. It generates buy signals when the price breaks through the upper band and sell signals when the price breaks through the lower band. The DEMA indicator is used to filter out false signals. This strategy works well for trending markets and can effectively follow trends and filter out consolidations.
Strategy Logic
The core of this strategy relies on the SuperTrend indicator to determine the trend direction of prices. The SuperTrend indicator incorporates the ATR indicator and can effectively identify price trends. When prices rise, an upper band will form, and when prices fall, a lower band will form. A breakout from the lower band signals a trend reversal and generates a buy signal. A breakout from the upper band signals a trend reversal and generates a sell signal.
To filter out false signals, this strategy also incorporates the DEMA indicator. Buy signals are only generated when prices break through the upper band and are above the DEMA line. Sell signals are only generated when prices break through the lower band and are below the DEMA line. This effectively filters out false signals in ranging markets.
Specifically, the trading signal logic is as follows:
- A breakout from the lower band signals a trend reversal and generates a buy signal.
- A breakout from the upper band signals a trend reversal and generates a sell signal.
- A actual buy signal is only generated when the buy signal appears and the price is above the DEMA line.
- A actual sell signal is only generated when the sell signal appears and the price is below the DEMA line.
Through this logic design, the strategy can follow trends in trending markets and avoid frequently opening positions in ranging markets.
Advantages of the Strategy
- Combines the advantages of SuperTrend and DEMA indicators to achieve trend following and signal filtering.
- Easy to optimize SuperTrend parameters for different products and timeframes.
- Simple to optimize DEMA parameters without repeated testing.
- Suitable for trending markets, can follow trends effectively.
- False signals in ranging markets are filtered out by the DEMA indicator.
- Simple logic and easy to understand and modify.
Risks of the Strategy
- Cannot handle extreme price fluctuations well.
- May incur losses when trends reverse.
- Inappropriate DEMA parameter settings may miss best entry/exit points.
- Inappropriate SuperTrend parameters like ATR period may generate false signals.
Risk Management:
- Optimize DEMA and SuperTrend parameters.
- Use stop loss orders to limit losses.
- Add confirmation mechanisms at key points to avoid false signals.
Enhancement Areas
The strategy can be enhanced from the following aspects:
SuperTrend parameter optimization. Test different ATR period combinations to find optimum parameters.
DEMA parameter optimization. Test different values to determine optimum settings.
Add stop loss mechanism. Set stop loss based on ATR values to prevent oversized stops.
Add signal filters. Increase confirmation from other indicators at key points to prevent false signals. For example, add volume confirmation at trend reversal points.
Improve position sizing. Dynamically adjust sizes based on market volatility and risks.
Conclusion
This strategy combines the strengths of SuperTrend and DEMA indicators to implement a quantitative trading strategy based on trend following and signal filtering. There is ample room for optimization through parameter tuning, stop losses, and signal filters to further improve stability and profitability. The strategy logic is simple and easy to implement with controllable risks. It is suitable for live trading.
Parameters
| Name | Default | What it controls |
|---|---|---|
| v_input_1 | 10 | ATR Period |
| v_input_2_hl2 | 0 | Source: hl2 | high | low | open | close | hlc3 | hlcc4 | ohlc4 |
| v_input_float_1 | 3 | ATR Multiplier |
| v_input_3 | true | Change ATR Calculation Method ? |
| v_input_4 | true | Show Buy/Sell Signals ? |
| v_input_5 | true | Highlighter On/Off ? |
Source Pine Script
/*backtest
start: 2023-11-07 00:00:00
end: 2023-12-07 00:00:00
period: 1h
basePeriod: 15m
exchanges: [{"eid":"Futures_Binance","currency":"BTC_USDT"}]
*/

//@version=5
strategy('Krish\'s Supertrend Strategy', overlay=true)

// Supertrend Settings
Periods = input(title='ATR Period', defval=10)
src = input(hl2, title='Source')
Multiplier = input.float(title='ATR Multiplier', step=0.1, defval=3.0)
changeATR = input(title='Change ATR Calculation Method ?', defval=true)
showsignals = input(title='Show Buy/Sell Signals ?', defval=true)
highlighting = input(title='Highlighter On/Off ?', defval=true)

atr2 = ta.sma(ta.tr, Periods)
atr = changeATR ? ta.atr(Periods) : atr2

up = src - Multiplier * atr
up1 = nz(up[1], up)
up := close[1] > up1 ? math.max(up, up1) : up

dn = src + Multiplier * atr
dn1 = nz(dn[1], dn)
dn := close[1] < dn1 ? math.min(dn, dn1) : dn

trend = 1
trend := nz(trend[1], trend)
trend := trend == -1 and close > dn1 ? 1 : trend == 1 and close < up1 ? -1 : trend

upPlot = plot(trend == 1 ? up : na, title='Up Trend', style=plot.style_linebr, linewidth=2, color=color.new(color.green, 0))
buySignal = trend == 1 and trend[1] == -1

plotshape(buySignal ? up : na, title='UpTrend Begins', location=location.absolute, style=shape.circle, size=size.tiny, color=color.new(color.green, 0))
plotshape(buySignal and showsignals ? up : na, title='Buy', text='Buy', location=location.absolute, style=shape.labelup, size=size.tiny, color=color.new(color.green, 0), textcolor=color.new(color.white, 0))

dnPlot = plot(trend == 1 ? na : dn, title='Down Trend', style=plot.style_linebr, linewidth=2, color=color.new(color.red, 0))
sellSignal = trend == -1 and trend[1] == 1

plotshape(sellSignal ? dn : na, title='DownTrend Begins', location=location.absolute, style=shape.circle, size=size.tiny, color=color.new(color.red, 0))
plotshape(sellSignal and showsignals ? dn : na, title='Sell', text='Sell', location=location.absolute, style=shape.labeldown, size=size.tiny, color=color.new(color.red, 0), textcolor=color.new(color.white, 0))

// DEMA Settings
dema_length = 200
dema = ta.ema(close, dema_length)

// Long and Short Conditions
longCondition = buySignal and close > dema
shortCondition = sellSignal and close < dema

// Strategy Entry and Exit
strategy.entry('Long', strategy.long, when=longCondition)
strategy.entry('Short', strategy.short, when=shortCondition)

strategy.close('Long', when=ta.change(trend) or close < dema)
strategy.close('Short', when=ta.change(trend) or close > dema)

// Plotting
mPlot = plot(ohlc4, title='', style=plot.style_circles, linewidth=0)
longFillColor = highlighting ? trend == 1 ? color.green : color.white : color.white
shortFillColor = highlighting ? trend == -1 ? color.red : color.white : color.white

fill(mPlot, upPlot, title='UpTrend Highlighter', color=longFillColor, transp=90)
fill(mPlot, dnPlot, title='DownTrend Highlighter', color=shortFillColor, transp=90)

// Alerts (using plotshape for alerts in strategies)
plotshape(buySignal, title='SuperTrend Buy', color=color.new(color.green, 0), style=shape.triangleup, size=size.small)
plotshape(sellSignal, title='SuperTrend Sell', color=color.new(color.red, 0), style=shape.triangledown, size=size.small)
changeCond = trend != trend[1]
plotshape(changeCond, title='SuperTrend Direction Change', color=color.new(color.yellow, 0), style=shape.triangleup, size=size.small)
Published by ChaoZhang on the FMZ strategy square · last modified 2023-12-08. Collected in the Quant Trading Vault. Unvalidated research: re-test with your own data and costs before trusting it.
Build this with AgenKit
A spec is not a trading system. Paste this into your coding agent and AgenKit runs a specialist team — architecture, test-first build, risk gates, review — with paper trading on by default.
/agenkit build a production-grade trading bot with a backtest engine, risk controls and paper trading by default from strategies/SuperTrend-and-DEMA-Based-Trend-Following-Strategy.md- npx agenkit install engineering-kit in your project
- Paste the command into your agent and approve each phase
- Get tests, backtest, risk controls and a paper-trading switch
Understand it first
Before you run this, read the lesson behind the idea and how to backtest it honestly. Specs like this one are the survivors of an unknown number of trials; deflate their results accordingly.
Related specs
- Multi Indicator Dynamic Trend Following Strategy Based on EMA and SMAPine Script · Trend following · 1d
- Supertrend Advance StrategyPine Script · Trend following · 5m
- Supertrend and Moving Average Crossover StrategyPine Script · Trend following · 2h
- Trend Following Strategy Based on PMax IndicatorPine Script · Trend following · 5m
- Trend Tracking and Short term Trading Strategy Based on ADX IndicatorPine Script · Trend following · 1d
- Triple Supertrend Ichimoku Cloud Quantitative Trading StrategyPine Script · Trend following · 1d