Strategy vault / Trend following
SuperTrend based Trend Tracking Strategy
This strategy is constructed based on the Average True Range (ATR) indicator to build a SuperTrend line for judging market trend direction and generating trading signals. It has both trend judgment and trend tracking…
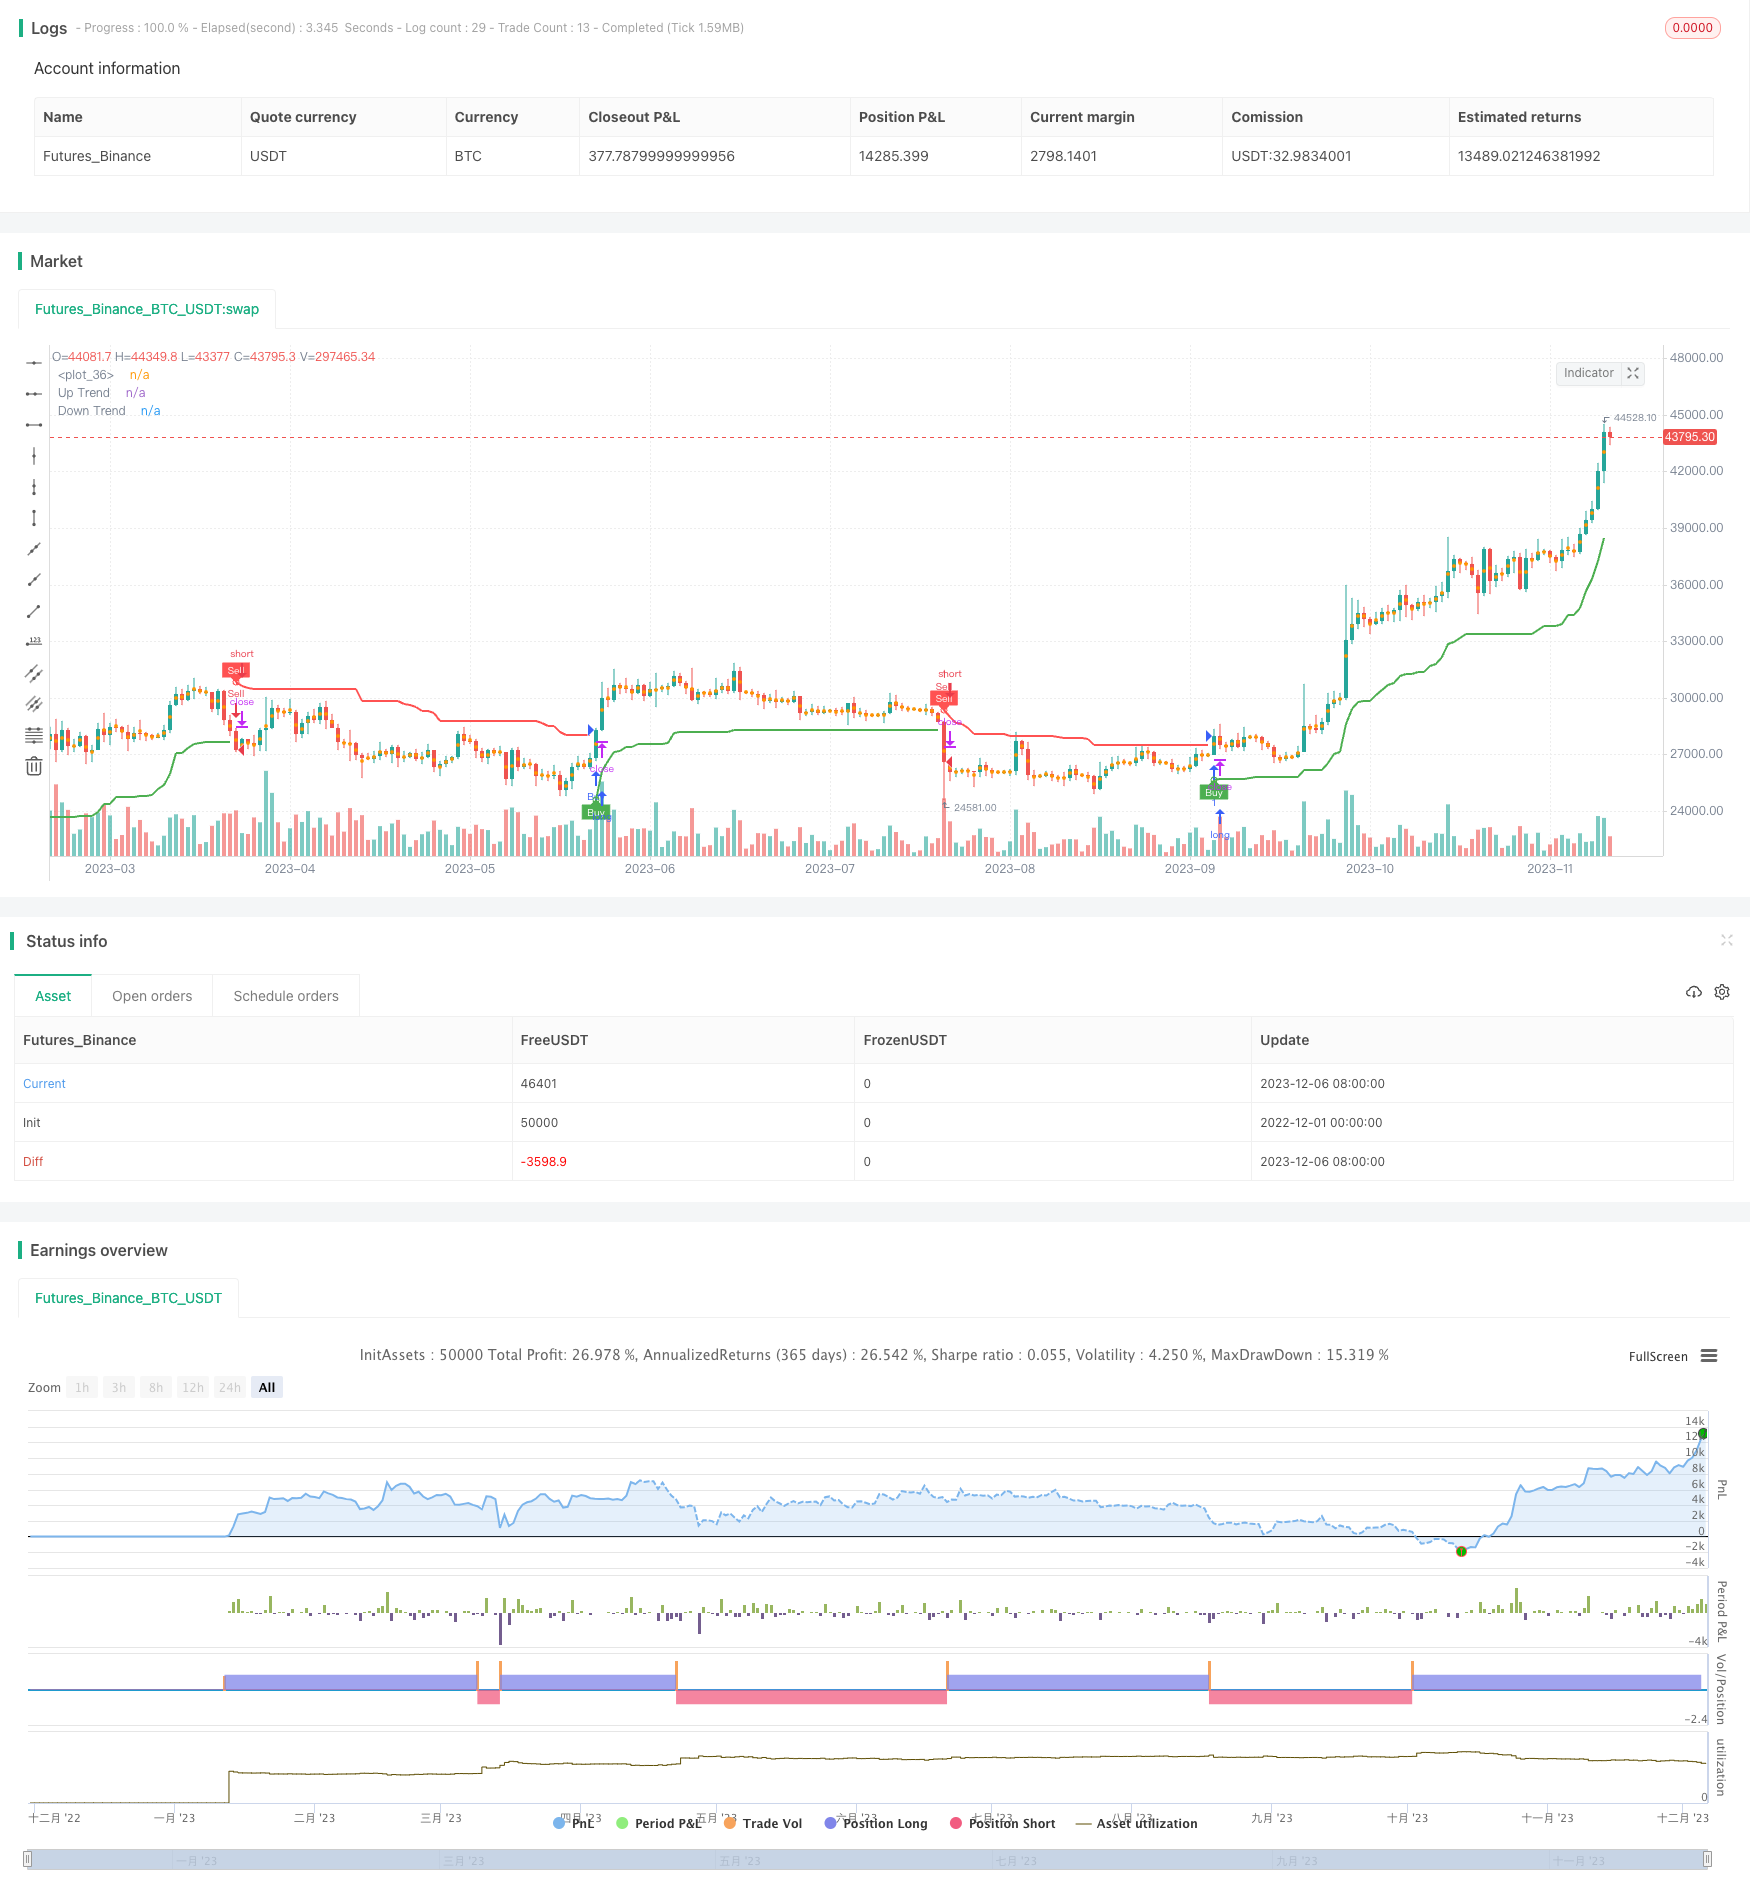
Overview
This strategy is constructed based on the Average True Range (ATR) indicator to build a SuperTrend line for judging market trend direction and generating trading signals. It has both trend judgment and trend tracking capabilities, applicable to indices futures, forex, and cryptocurrencies.
Strategy Logic
The strategy calculates the ATR over a certain period and compares it with price to determine if the price is within an uptrend channel. Specifically, it first computes the ATR, then uses the ATR value multiplied by a factor to plot the upper and lower bands. When the price is higher than the upper band, an uptrend is identified. When the price is below the lower band, a downtrend is identified. In an uptrend, if the price changes from downtrend to uptrend, a buy signal is generated. In a downtrend, if the price changes from uptrend to downtrend, a sell signal is triggered.
The key lies in constructing the trend judgment benchmark - SuperTrend line. The SuperTrend line is based on the dynamically changing ATR, which can effectively filter out market noise and determine the major trend direction. Meanwhile, the SuperTrend line has a certain lagging effect, which helps confirm trend reversal points and avoid generating incorrect trading signals.
Advantages
The biggest advantage of this strategy is the combination of trend identification and tracking abilities:
- The ATR-based SuperTrend line can effectively identify market trends and filter out noise.
- The lagging effect of the SuperTrend line helps reduce incorrect signals.
- It can give both trend judgment and trading signals for easy operation.
- The parameters can be optimized for fitting more diverse markets.
- Visual indicators allow intuitive trend judgments.
Risk Analysis
The main risks of this strategy include:
- Improper ATR parameter setting may cause too sensitive or lagging SuperTrend lines.
- It cannot completely avoid the impact of noise, which may occasionally trigger incorrect signals.
- The accuracy decreases during violent market fluctuations.
- It cannot predict trend reversal points but can only track existing trends.
Possible solutions include optimizing parameters like ATR period and SuperTrend factor, combining with other indicators for verification, and reducing incorrect signal probabilities. Also, stop losses can control single trade loss.
Optimization Directions
Further optimization space exists in areas like:
- Adopting machine learning for automatic parameter optimization.
- Adding indicators like exponential moving averages for verification.
- Setting up stop loss/profit taking strategies for refined money management.
- Combining sentiment indicators and news analytics to predict potential trend reversals.
- Leveraging deep learning to analyze more historical data and improve accuracy.
In-depth optimization promises to further lift stability, adaptiveness and profitability of the strategy.
Conclusion
The strategy demonstrates great stability, reliability and profitability overall. Constructing the SuperTrend line for major trend judgment and trading signals is its biggest highlight. But certain degree of lagging effect and misjudgment risks do exist. Parameter and model optimization promises better strategy performance. In summary, as a typical trend-based strategy, it is worthwhile to verify and utilize it in live trading.
Parameters
| Name | Default | What it controls |
|---|---|---|
| v_input_1 | 10 | ATR Period |
| v_input_2_hl2 | 0 | Source: hl2 | high | low | open | close | hlc3 | hlcc4 | ohlc4 |
| v_input_3 | 3 | ATR Multiplier |
| v_input_4 | true | Change ATR Calculation Method? |
| v_input_5 | true | Show Buy/Sell Signals? |
| v_input_6 | true | Highlighter On/Off? |
Source Pine Script
/*backtest
start: 2022-12-01 00:00:00
end: 2023-12-07 00:00:00
period: 1d
basePeriod: 1h
exchanges: [{"eid":"Futures_Binance","currency":"BTC_USDT"}]
*/

//@version=4
strategy("Supertrend Strategy", overlay = true)

Periods = input(10, title="ATR Period")
src = input(hl2, title="Source")
Multiplier = input(3.0, title="ATR Multiplier", step=0.1)
changeATR = input(true, title="Change ATR Calculation Method?")
showsignals = input(true, title="Show Buy/Sell Signals?")
highlighting = input(true, title="Highlighter On/Off?")

atr2 = sma(tr, Periods)
atr = changeATR ? atr(Periods) : atr2

up = src - (Multiplier * atr)
up1 = nz(up[1], up)
up := close[1] > up1 ? max(up, up1) : up

dn = src + (Multiplier * atr)
dn1 = nz(dn[1], dn)
dn := close[1] < dn1 ? min(dn, dn1) : dn

trend = 1
trend := nz(trend[1], trend)
trend := trend == -1 and close > dn1 ? 1 : trend == 1 and close < up1 ? -1 : trend

upPlot = plot(trend == 1 ? up : na, title="Up Trend", style=plot.style_linebr, linewidth=2, color=color.green)
buySignal = trend == 1 and trend[1] == -1
plotshape(buySignal ? up : na, title="UpTrend Begins", location=location.absolute, style=shape.circle, size=size.tiny, color=color.green, transp=0)
plotshape(buySignal and showsignals ? up : na, title="Buy", text="Buy", location=location.absolute, style=shape.labelup, size=size.tiny, color=color.green, textcolor=color.white, transp=0)

dnPlot = plot(trend == 1 ? na : dn, title="Down Trend", style=plot.style_linebr, linewidth=2, color=color.red)
sellSignal = trend == -1 and trend[1] == 1
plotshape(sellSignal ? dn : na, title="DownTrend Begins", location=location.absolute, style=shape.circle, size=size.tiny, color=color.red, transp=0)
plotshape(sellSignal and showsignals ? dn : na, title="Sell", text="Sell", location=location.absolute, style=shape.labeldown, size=size.tiny, color=color.red, textcolor=color.white, transp=0)

mPlot = plot(ohlc4, title="", style=plot.style_circles, linewidth=0)

longFillColor = highlighting ? (trend == 1 ? color.green : color.white) : color.white
shortFillColor = highlighting ? (trend == -1 ? color.red : color.white) : color.white

fill(mPlot, upPlot, title="UpTrend Highlighter", color=longFillColor)
fill(mPlot, dnPlot, title="DownTrend Highlighter", color=shortFillColor)

strategy.entry("Buy", strategy.long, when=buySignal)
strategy.entry("Sell", strategy.short, when=sellSignal)

alertcondition(buySignal, title="SuperTrend Buy", message="SuperTrend Buy!")
alertcondition(sellSignal, title="SuperTrend Sell", message="SuperTrend Sell!")
changeCond = trend != trend[1]
alertcondition(changeCond, title="SuperTrend Direction Change", message="SuperTrend has changed direction!")
Published by ChaoZhang on the FMZ strategy square · last modified 2023-12-08. Collected in the Quant Trading Vault. Unvalidated research: re-test with your own data and costs before trusting it.
Build this with AgenKit
A spec is not a trading system. Paste this into your coding agent and AgenKit runs a specialist team — architecture, test-first build, risk gates, review — with paper trading on by default.
/agenkit build a production-grade trading bot with a backtest engine, risk controls and paper trading by default from strategies/SuperTrend-based-Trend-Tracking-Strategy.md- npx agenkit install engineering-kit in your project
- Paste the command into your agent and approve each phase
- Get tests, backtest, risk controls and a paper-trading switch
Understand it first
Before you run this, read the lesson behind the idea and how to backtest it honestly. Specs like this one are the survivors of an unknown number of trials; deflate their results accordingly.
Related specs
- Multi Indicator Dynamic Trend Following Strategy Based on EMA and SMAPine Script · Trend following · 1d
- Supertrend Advance StrategyPine Script · Trend following · 5m
- Supertrend and Moving Average Crossover StrategyPine Script · Trend following · 2h
- Trend Following Strategy Based on PMax IndicatorPine Script · Trend following · 5m
- Trend Tracking and Short term Trading Strategy Based on ADX IndicatorPine Script · Trend following · 1d
- Triple Supertrend Ichimoku Cloud Quantitative Trading StrategyPine Script · Trend following · 1d