SuperTrend Breakout Strategy
This strategy generates trading signals when price breaks out of the uptrend/downtrend channel formed by the SuperTrend indicator. The strategy has outstanding trend following ability.
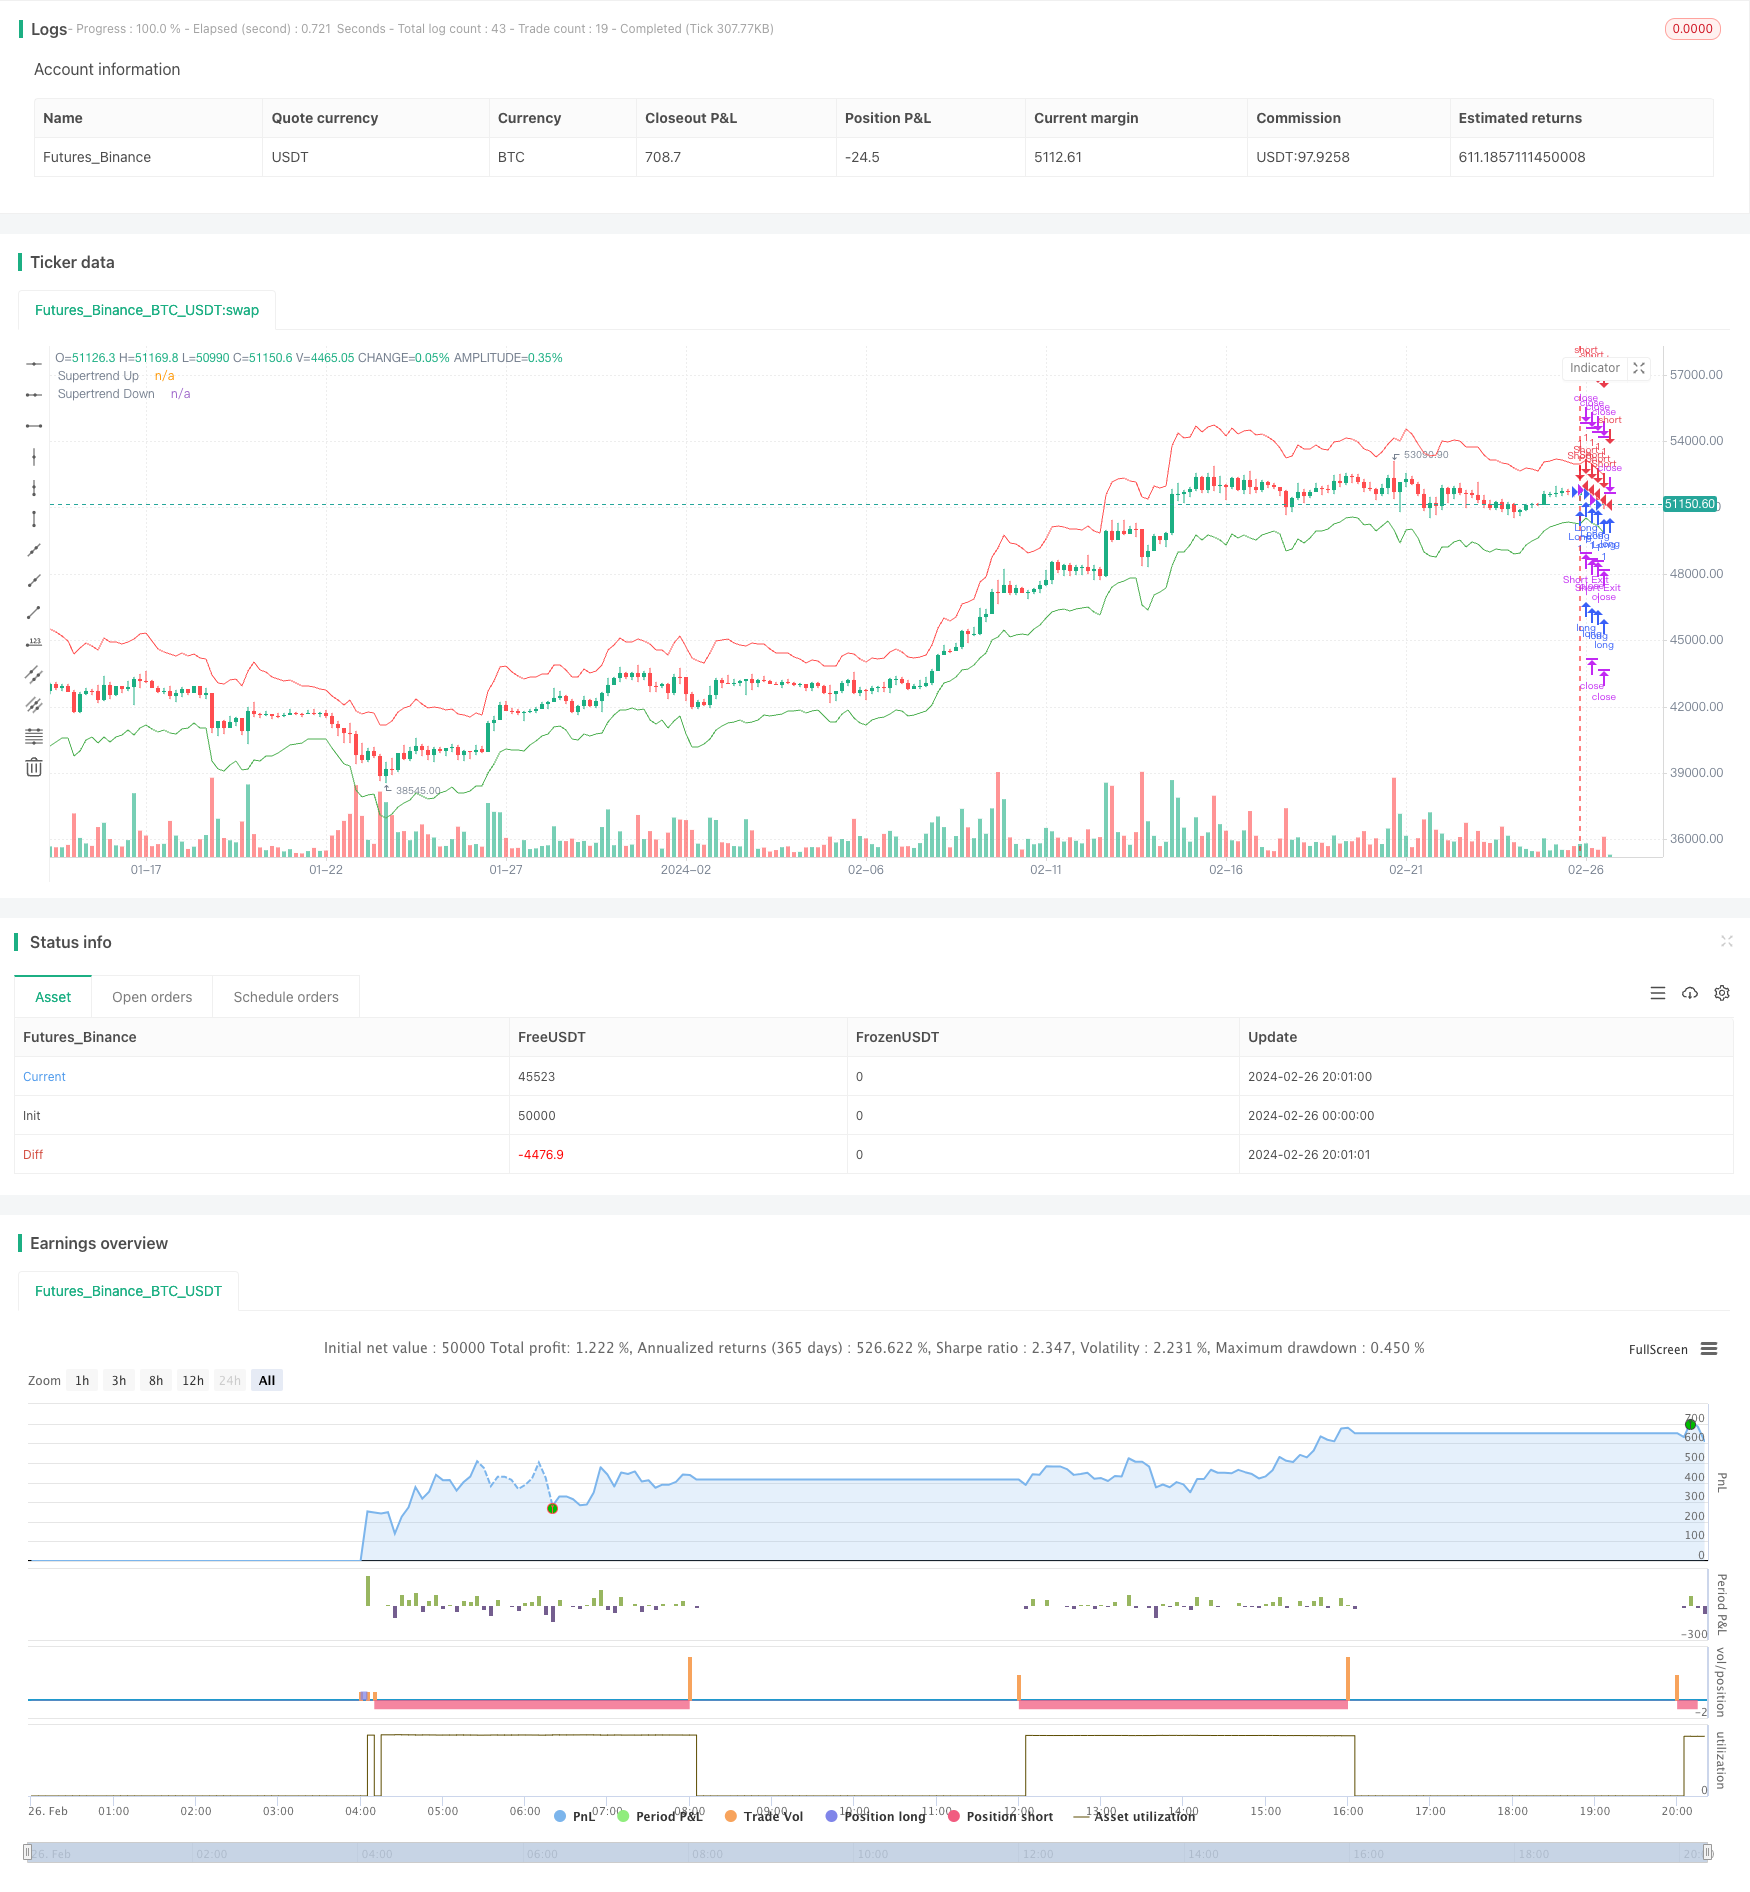
Overview
This strategy generates trading signals when price breaks out of the uptrend/downtrend channel formed by the SuperTrend indicator. The strategy has outstanding trend following ability.
Strategy Logic
The strategy first calculates the ATR indicator as a measure of price volatility, then combines it with the average of highest, lowest and closing prices to compute the upper and lower bands. When price breaks above the lower band during an uptrend, a buy signal is generated. When price breaks below the upper band during a downtrend, a sell signal is triggered. This forms an adaptive uptrend/downtrend channel that tracks price trends.
After entering the market, the strategy sets target profit ticks and stop loss ticks. It closes position for profit when price reaches the profit target, and stops out when drawdown hits the stop loss level.
Advantage Analysis
The biggest advantage of this strategy is its excellent trend following ability. The adaptive channel can capture trend changes quickly. Using ATR also provides some assurance of trading along with momentum. In addition, the profit target and stop loss mechanism gives clear risk/reward control.
Risk Analysis
One major risk is that it may generate excessive whipsaws during range-bound markets, as the price constantly pierces through the bands. In addition, stop loss setting also directly impacts final results.
To reduce such risks, parameters like ATR period or channel multiplier could be optimized to fit the true trend better. Other filters may also be added on entry signals to avoid whipsaws.
Enhancement Opportunities
The strategy can be enhanced in several aspects:
Optimize ATR parameters to better reflect actual volatility dynamics.
Test different multipliers for channel width optimization.
Add other indicators as filters on entries, e.g. MACD for better timing.
Optimize profit target and stop loss levels for maximized risk-adjusted returns.
Consider other objectives like Sharpe ratio or profit factor to evaluate overall quality.
Summary
The strategy leverages the adaptive channel breakout model to achieve great trend following ability. It also has clear risk control mechanisms. With further parameter tuning and logic enhancement, it has the potential to work even better across various market conditions and asset classes.
Parameters
| Name | Default | What it controls |
|---|---|---|
| v_input_int_1 | 10 | ATR Length |
| v_input_float_1 | 3 | Multiplier |
| v_input_int_2 | 100 | Target Points |
| v_input_int_3 | 50 | Stop Loss Points |
Source Pine Script
/*backtest
start: 2024-02-26 00:00:00
end: 2024-02-26 20:20:00
period: 4h
basePeriod: 15m
exchanges: [{"eid":"Futures_Binance","currency":"BTC_USDT"}]
*/

//@version=5
strategy("Supertrend Strategy", overlay=true)

// Input parameters
atr_length = input.int(10, title="ATR Length")
multiplier = input.float(3.0, title="Multiplier")

target_points = input.int(100, title="Target Points")
stop_loss_points = input.int(50, title="Stop Loss Points")

// Calculate ATR and Supertrend
atr = ta.atr(atr_length)
upper_band = hlc3 + (multiplier * atr)
lower_band = hlc3 - (multiplier * atr)
is_uptrend = close > lower_band
is_downtrend = close < upper_band
trend_changed = (is_uptrend[1] and is_downtrend) or (is_downtrend[1] and is_uptrend)

// Strategy logic
long_condition = is_uptrend and trend_changed
short_condition = is_downtrend and trend_changed

// Plot Supertrend
plot(is_uptrend ? lower_band : na, color=color.green, title="Supertrend Up", style=plot.style_linebr)
plot(is_downtrend ? upper_band : na, color=color.red, title="Supertrend Down", style=plot.style_linebr)

// Strategy entry and exit
if long_condition
    strategy.entry("Long", strategy.long)
if short_condition
    strategy.entry("Short", strategy.short)

// Calculate target and stop loss levels
long_target = strategy.position_avg_price + target_points
long_stop_loss = strategy.position_avg_price - stop_loss_points
short_target = strategy.position_avg_price - target_points
short_stop_loss = strategy.position_avg_price + stop_loss_points

// Strategy exit
strategy.exit("Long Exit", "Long", limit=long_target, stop=long_stop_loss)
strategy.exit("Short Exit", "Short", limit=short_target, stop=short_stop_loss)
Published by ChaoZhang on the FMZ strategy square · last modified 2024-02-28. Collected in the Quant Trading Vault. Unvalidated research: re-test with your own data and costs before trusting it.
Build this with AgenKit
A spec is not a trading system. Paste this into your coding agent and AgenKit runs a specialist team — architecture, test-first build, risk gates, review — with paper trading on by default.
/agenkit build a production-grade trading bot with a backtest engine, risk controls and paper trading by default from strategies/SuperTrend-Breakout-Strategy.md- npx agenkit install engineering-kit in your project
- Paste the command into your agent and approve each phase
- Get tests, backtest, risk controls and a paper-trading switch
Understand it first
Before you run this, read the lesson behind the idea and how to backtest it honestly. Specs like this one are the survivors of an unknown number of trials; deflate their results accordingly.
Related specs
- Momentum Breakout Trading Strategy 440964Pine Script · Breakout · 5m
- Quantitative Trading Strategy Based on Ichimoku with Multiple SignalsPine Script · Breakout · 1h
- Cross Timeframe SuperTrend Breakout StrategyPine Script · Breakout · 1h
- Multi Timeframe Trend Confirmed Quantitative Breakout Trading StrategyPine Script · Breakout · 1d
- Bull Flag Breakout StrategyPine Script · Breakout · 1h
- Dual Breakout Volatility Channel StrategyPine Script · Breakout · 1h