Strategy vault / Trend following
SuperTrended Moving Averages
adding 100 periods Exponential Moving Average in calculation of SuperTrend and also 0.5 ATR Multiplier to have a clear view of the ongoing trend and also provides significant Supports and Resistances. Default Moving…
adding 100 periods Exponential Moving Average in calculation of SuperTrend and also 0.5 ATR Multiplier to have a clear view of the ongoing trend and also provides significant Supports and Resistances.
Default Moving Average type set as EMA ( Exponential Moving Average ) but users can choose from 11 different Moving Average types as:
SMA : Simple Moving Average EMA : Exponential Moving Average WMA : Weighted Moving Average DEMA : Double Exponential Moving Average TMA : Triangular Moving Average VAR : Variable Index Dynamic Moving Average a.k.a. VIDYA WWMA : Welles Wilder's Moving Average ZLEMA : Zero Lag Exponential Moving Average TSF : True Strength Force HULL : Hull Moving Average TILL : Tillson T3 Moving Average
Credits going to @CryptoErge for sharing his development to public.
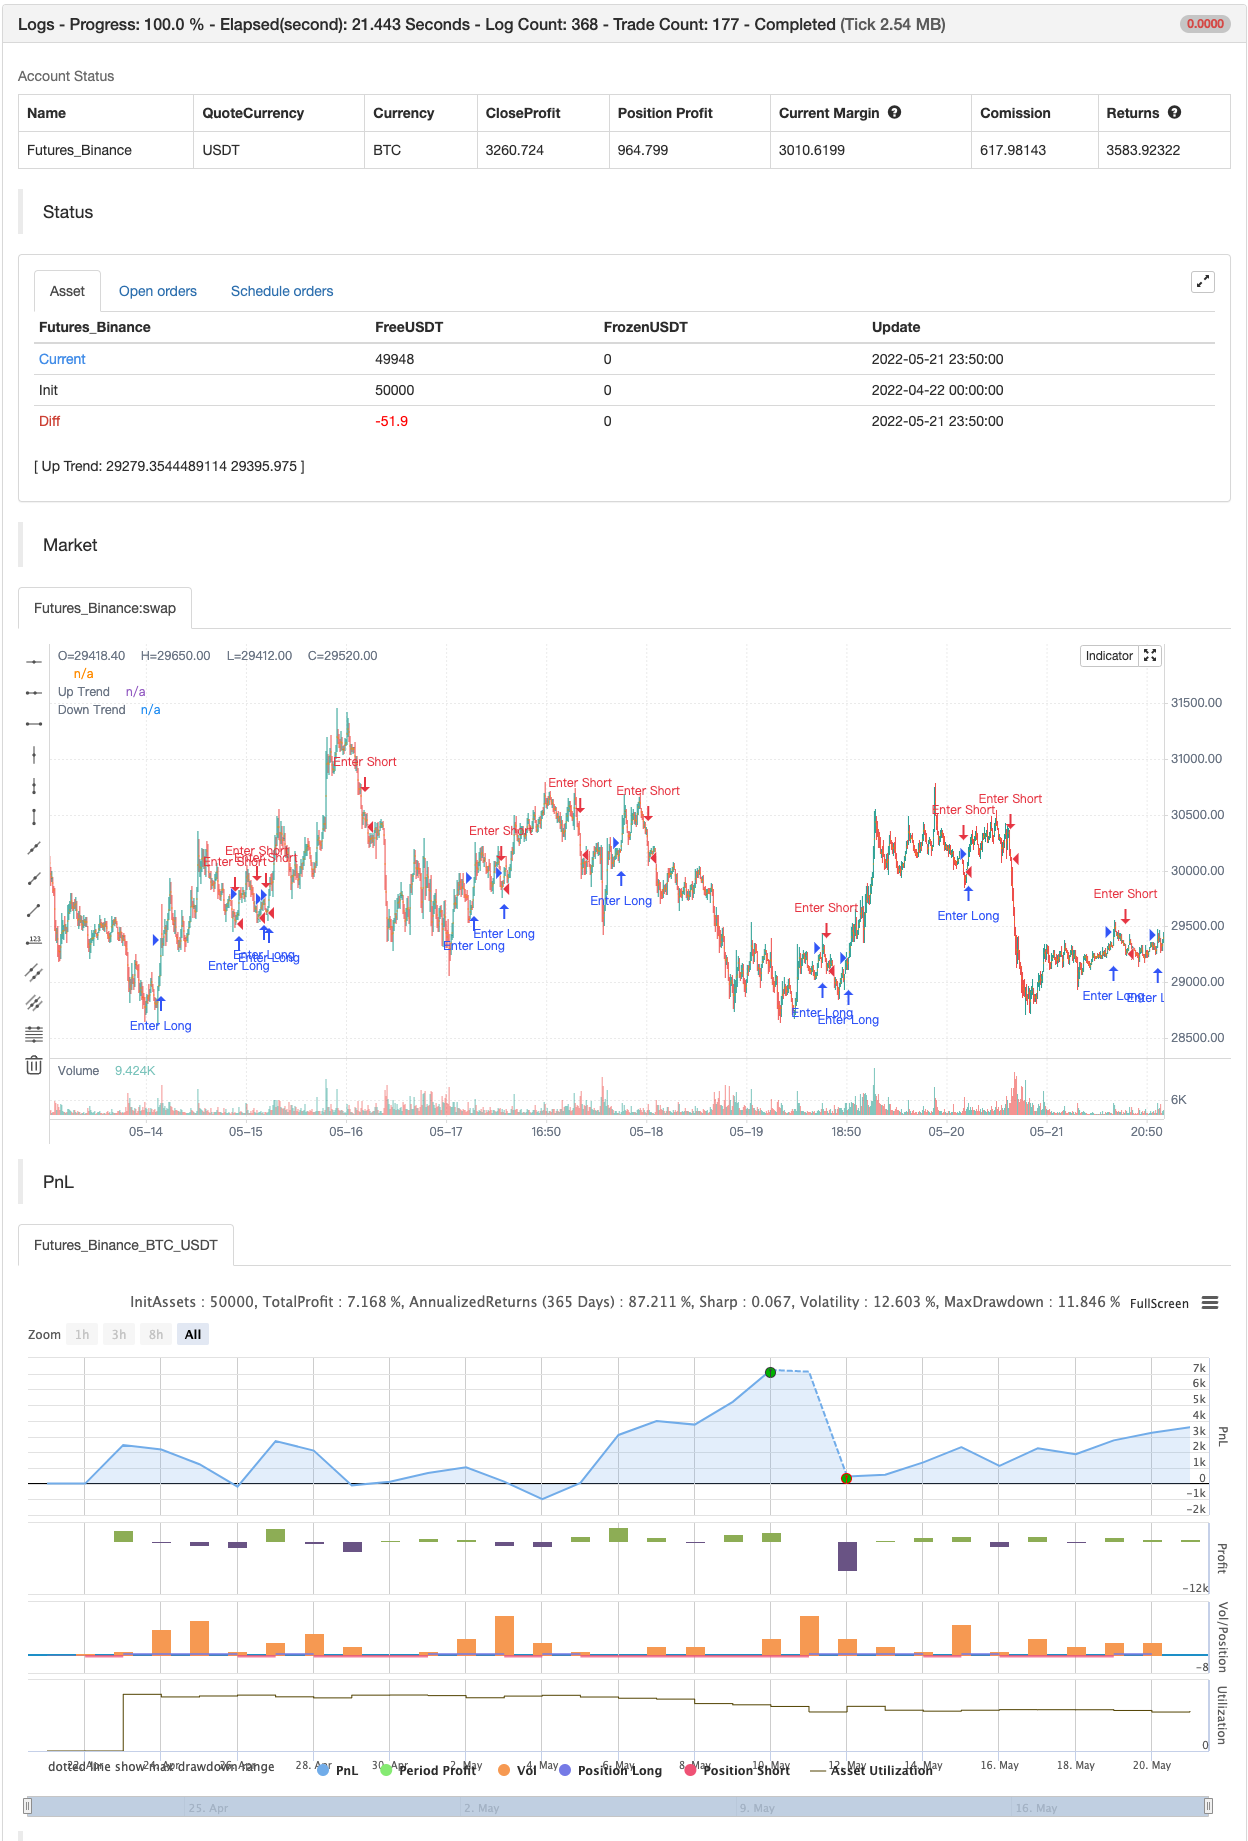
backtest
Parameters
| Name | Default | What it controls |
|---|---|---|
| v_input_1_close | 0 | Source: close | high | low | open | hl2 | hlc3 | hlcc4 | ohlc4 |
| v_input_string_1 | 0 | Moving Average Type: EMA | SMA | WMA | DEMA | TMA | VAR | WWMA | ZLEMA | TSF | HULL | TILL |
| v_input_int_1 | 100 | Moving Average Length |
| v_input_2 | 10 | ATR Period |
| v_input_float_1 | 0.5 | ATR Multiplier |
| v_input_3 | true | Change ATR Calculation Method ? |
| v_input_4 | false | Show Buy/Sell Signals ? |
| v_input_5 | true | Highlighter On/Off ? |
| v_input_float_2 | 0.7 | TILLSON T3c1*T3e6+T3c2*T3e5+T3c3*T3e4+T3c4*T3e3 Volume Factor |
| v_input_color_1 | green | ColorU |
| v_input_color_2 | red | ColorD |
Source Pine Script
/*backtest
start: 2022-04-22 00:00:00
end: 2022-05-21 23:59:00
period: 10m
basePeriod: 1m
exchanges: [{"eid":"Futures_Binance","currency":"BTC_USDT"}]
*/

//@version=5

indicator('SuperTrended Moving Averages', 'ST MA', overlay=true, format=format.price, precision=2, timeframe='', timeframe_gaps=false)
src = input(close, title='Source')
mav = input.string(title='Moving Average Type', defval='EMA', options=['SMA', 'EMA', 'WMA', 'DEMA', 'TMA', 'VAR', 'WWMA', 'ZLEMA', 'TSF', 'HULL', 'TILL'])
length = input.int(100, 'Moving Average Length', minval=1)
Periods = input(title='ATR Period', defval=10)
Multiplier = input.float(title='ATR Multiplier', step=0.1, defval=0.5)
changeATR = input(title='Change ATR Calculation Method ?', defval=true)
showsignals = input(title='Show Buy/Sell Signals ?', defval=false)
highlighting = input(title='Highlighter On/Off ?', defval=true)


T3a1 = input.float(0.7, 'TILLSON T3 Volume Factor', step=0.1)


Var_Func(src, length) =>
    valpha = 2 / (length + 1)
    vud1 = src > src[1] ? src - src[1] : 0
    vdd1 = src < src[1] ? src[1] - src : 0
    vUD = math.sum(vud1, 9)
    vDD = math.sum(vdd1, 9)
    vCMO = nz((vUD - vDD) / (vUD + vDD))
    VAR = 0.0
    VAR := nz(valpha * math.abs(vCMO) * src) + (1 - valpha * math.abs(vCMO)) * nz(VAR[1])
    VAR
VAR = Var_Func(src, length)
DEMA = 2 * ta.ema(src, length) - ta.ema(ta.ema(src, length), length)
Wwma_Func(src, length) =>
    wwalpha = 1 / length
    WWMA = 0.0
    WWMA := wwalpha * src + (1 - wwalpha) * nz(WWMA[1])
    WWMA
WWMA = Wwma_Func(src, length)
Zlema_Func(src, length) =>
    zxLag = length / 2 == math.round(length / 2) ? length / 2 : (length - 1) / 2
    zxEMAData = src + src - src[zxLag]
    ZLEMA = ta.ema(zxEMAData, length)
    ZLEMA
ZLEMA = Zlema_Func(src, length)
Tsf_Func(src, length) =>
    lrc = ta.linreg(src, length, 0)
    lrc1 = ta.linreg(src, length, 1)
    lrs = lrc - lrc1
    TSF = ta.linreg(src, length, 0) + lrs
    TSF
TSF = Tsf_Func(src, length)
HMA = ta.wma(2 * ta.wma(src, length / 2) - ta.wma(src, length), math.round(math.sqrt(length)))
T3e1 = ta.ema(src, length)
T3e2 = ta.ema(T3e1, length)
T3e3 = ta.ema(T3e2, length)
T3e4 = ta.ema(T3e3, length)
T3e5 = ta.ema(T3e4, length)
T3e6 = ta.ema(T3e5, length)
T3c1 = -T3a1 * T3a1 * T3a1
T3c2 = 3 * T3a1 * T3a1 + 3 * T3a1 * T3a1 * T3a1
T3c3 = -6 * T3a1 * T3a1 - 3 * T3a1 - 3 * T3a1 * T3a1 * T3a1
T3c4 = 1 + 3 * T3a1 + T3a1 * T3a1 * T3a1 + 3 * T3a1 * T3a1
T3 = T3c1 * T3e6 + T3c2 * T3e5 + T3c3 * T3e4 + T3c4 * T3e3


getMA(src, length) =>
    ma = 0.0
    if mav == 'SMA'
        ma := ta.sma(src, length)
        ma

    if mav == 'EMA'
        ma := ta.ema(src, length)
        ma

    if mav == 'WMA'
        ma := ta.wma(src, length)
        ma

    if mav == 'DEMA'
        ma := DEMA
        ma

    if mav == 'TMA'
        ma := ta.sma(ta.sma(src, math.ceil(length / 2)), math.floor(length / 2) + 1)
        ma

    if mav == 'VAR'
        ma := VAR
        ma

    if mav == 'WWMA'
        ma := WWMA
        ma

    if mav == 'ZLEMA'
        ma := ZLEMA
        ma

    if mav == 'TSF'
        ma := TSF
        ma

    if mav == 'HULL'
        ma := HMA
        ma

    if mav == 'TILL'
        ma := T3
        ma
    ma

MA = getMA(src, length)


atr2 = ta.sma(ta.tr, Periods)
atr = changeATR ? ta.atr(Periods) : atr2
up = MA - Multiplier * atr
up1 = nz(up[1], up)
up := close[1] > up1 ? math.max(up, up1) : up
dn = MA + Multiplier * atr
dn1 = nz(dn[1], dn)
dn := close[1] < dn1 ? math.min(dn, dn1) : dn
trend = 1
trend := nz(trend[1], trend)
trend := trend == -1 and close > dn1 ? 1 : trend == 1 and close < up1 ? -1 : trend
upPlot = plot(trend == 1 ? up : na, title='Up Trend', color=color.new(color.green, 100), linewidth=0, style=plot.style_linebr)
buySignal = trend == 1 and trend[1] == -1
plotshape(buySignal ? up : na, title='UpTrend Begins', location=location.absolute, style=shape.circle, size=size.tiny, color=color.new(color.green, 100))
plotshape(buySignal and showsignals ? up : na, title='Buy', text='Buy', location=location.absolute, style=shape.labelup, size=size.tiny, color=color.new(color.green, 0), textcolor=color.new(color.white, 0))
dnPlot = plot(trend == 1 ? na : dn, title='Down Trend', style=plot.style_linebr, linewidth=0, color=color.new(color.red, 100))
sellSignal = trend == -1 and trend[1] == 1
plotshape(sellSignal ? dn : na, title='DownTrend Begins', location=location.absolute, style=shape.circle, size=size.tiny, color=color.new(color.red, 100))
plotshape(sellSignal and showsignals ? dn : na, title='Sell', text='Sell', location=location.absolute, style=shape.labeldown, size=size.tiny, color=color.new(color.red, 0), textcolor=color.new(color.white, 0))
mPlot = plot(ohlc4, title='', style=plot.style_circles, linewidth=0)
colorup = input.color(defval = color.new(color.green, 60), title = "ColorU", inline = 'color')
colordown = input.color(defval = color.new(color.red, 60), title = "ColorD", inline = 'color')
longFillColor = highlighting ? trend == 1 ? colorup : color.white : color.new(color.white, 100)
shortFillColor = highlighting ? trend == -1 ? colordown : color.white : color.new(color.white, 100)
fill(mPlot, upPlot, title='UpTrend Highligter', color=longFillColor)
fill(mPlot, dnPlot, title='DownTrend Highligter', color=shortFillColor)
alertcondition(buySignal, title='SuperTrend Buy', message='SuperTrend Buy!')
alertcondition(sellSignal, title='SuperTrend Sell', message='SuperTrend Sell!')
changeCond = trend != trend[1]
alertcondition(changeCond, title='SuperTrend Direction Change', message='SuperTrend has changed direction!')


if buySignal
    strategy.entry("Enter Long", strategy.long)
else if sellSignal
strategy.entry("Enter Short", strategy.short)Published by ChaoZhang on the FMZ strategy square · last modified 2022-05-24. Collected in the Quant Trading Vault. Unvalidated research: re-test with your own data and costs before trusting it.
Build this with AgenKit
A spec is not a trading system. Paste this into your coding agent and AgenKit runs a specialist team — architecture, test-first build, risk gates, review — with paper trading on by default.
/agenkit build a production-grade trading bot with a backtest engine, risk controls and paper trading by default from strategies/SuperTrended-Moving-Averages.md- npx agenkit install engineering-kit in your project
- Paste the command into your agent and approve each phase
- Get tests, backtest, risk controls and a paper-trading switch
Understand it first
Before you run this, read the lesson behind the idea and how to backtest it honestly. Specs like this one are the survivors of an unknown number of trials; deflate their results accordingly.
Related specs
- Multi Indicator Dynamic Trend Following Strategy Based on EMA and SMAPine Script · Trend following · 1d
- Supertrend Advance StrategyPine Script · Trend following · 5m
- Supertrend and Moving Average Crossover StrategyPine Script · Trend following · 2h
- Trend Following Strategy Based on PMax IndicatorPine Script · Trend following · 5m
- Trend Tracking and Short term Trading Strategy Based on ADX IndicatorPine Script · Trend following · 1d
- Triple Supertrend Ichimoku Cloud Quantitative Trading StrategyPine Script · Trend following · 1d