Strategy vault / Trend following
The Wave Trend Trading Strategy Based on LazyBear
This is a trading strategy based on LazyBear's Wave Trend indicator. The strategy identifies market sentiment through computing the wave trend of price fluctuations, and makes long and short decisions accordingly.
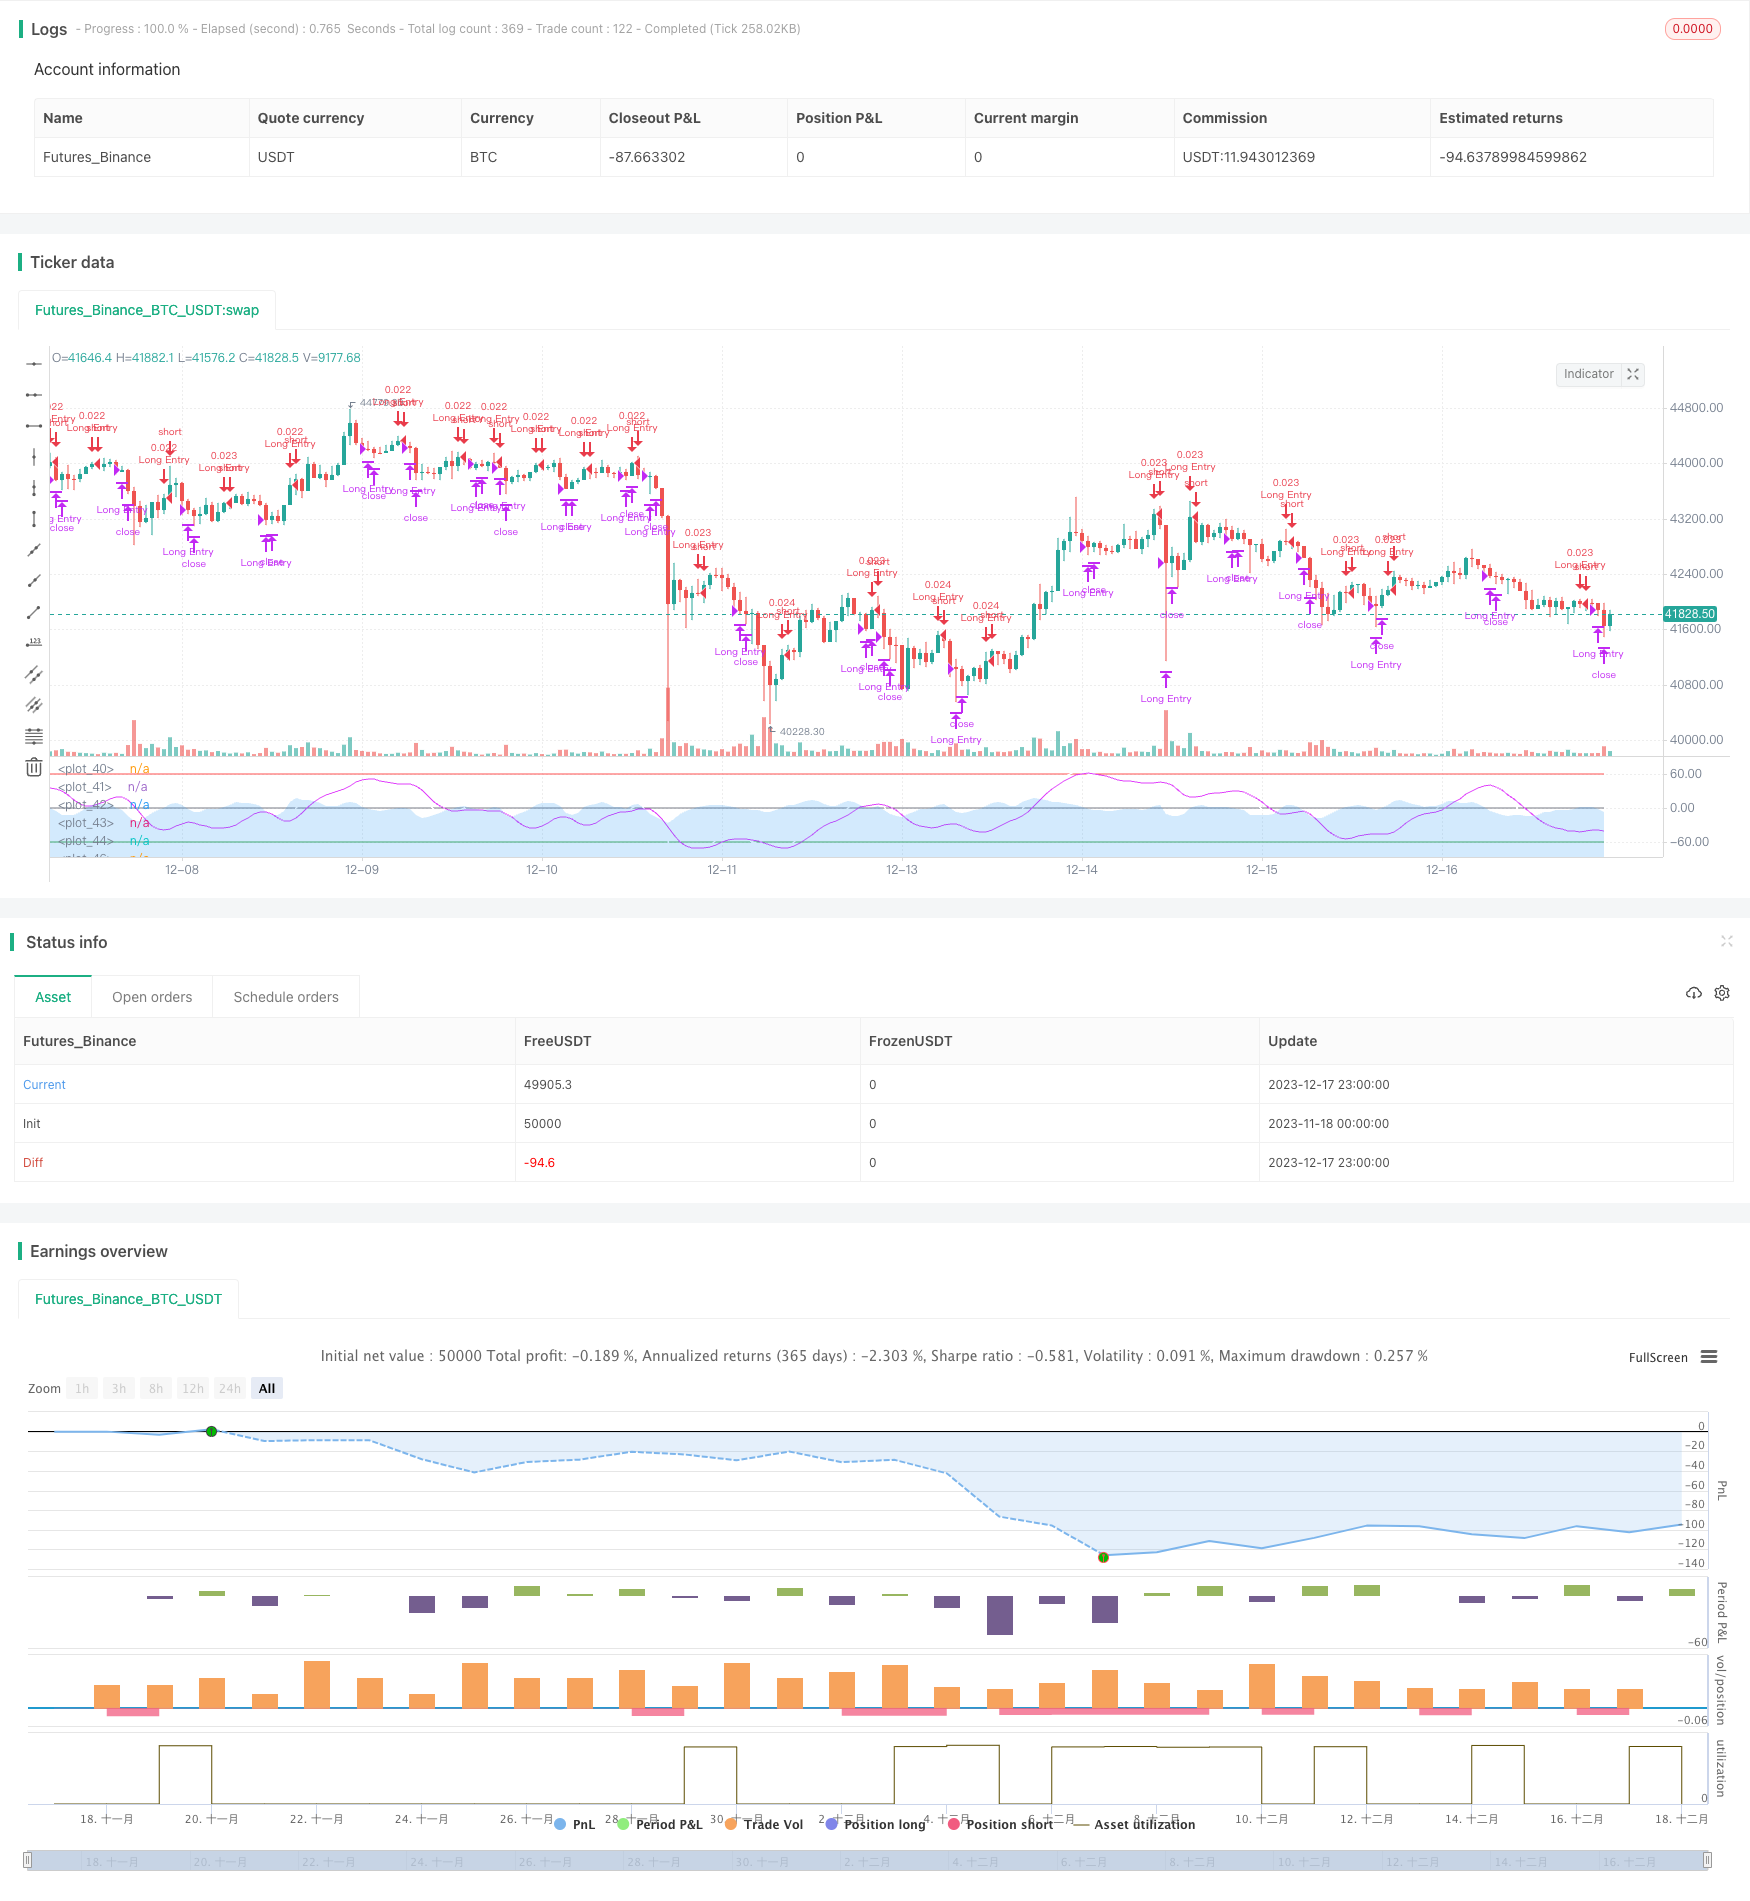
Overview
This is a trading strategy based on LazyBear's Wave Trend indicator. The strategy identifies market sentiment through computing the wave trend of price fluctuations, and makes long and short decisions accordingly.
Strategy Logic
The core of this strategy is LazyBear's Wave Trend indicator. It first calculates the average price (AP), then the exponential moving average of AP (ESA) and the absolute price movement (D). Based on ESA and D the strategy calculates the Volatility Index (CI), which then feeds into an exponential moving average to generate the Wave Trend line (WT). WT is further processed into WT1 and WT2 using simple moving averages. When WT1 crosses over WT2, it triggers the golden cross and goes long. When WT1 crosses below WT2, it triggers the death cross and goes short.
Advantage Analysis
This is a very simple but practical trend following strategy. The main advantages are:
- It identifies price trend and market sentiment clearly based on the Wave Trend indicator
- Simple trading logic of going long/short based on golden/death crosses of WT lines
- Customizable parameters to adjust sensitivity of WT for different cycles
- Flexibility to add further filters such as trading time window
Risk Analysis
There are some risks to this strategy:
- As a trend following strategy, it can generate many false signals during range-bound markets
- The lagging nature of WT may cause missed turns
- Default parameters may not suit all products and cycles
- No stop loss mechanism, holding period can be very long
The main solutions are:
- Optimize parameters to tune sensitivity of WT
- Add other indicators for confirmation to avoid false signals
- Employ stop loss and take profit
- Limit daily trades or positions
Optimization Directions
There is room for further optimization:
- Optimize WT parameters for better sensitivity or stability
- Use different parameter sets based on cycles
- Add indicators like volume, volatility for confirmation
- Add stop loss and take profit
- Enrich trading logic like pyramiding, grid trading
- Explore better features and rules using machine learning
Summary
In summary, this is a very simple and practical wave trend following strategy. By modeling the wave trend of price fluctuations, it identifies overbought and oversold market conditions to generate trade signals using WT's golden crosses and death crosses. The strategy is easy to implement but may require further optimization for sensitivity and stability. As a trend following strategy, it also needs additional filters and logic to avoid false signals. Overall this serves as a useful strategy template with lots of room for improvements.
Parameters
| Name | Default | What it controls |
|---|---|---|
| v_input_1 | true | From Month |
| v_input_2 | true | From Day |
| v_input_3 | 2021 | From Year |
| v_input_4 | true | Thru Month |
| v_input_5 | true | Thru Day |
| v_input_6 | 2112 | Thru Year |
| v_input_7 | true | Show Date Range |
| v_input_8 | 10 | Channel Length |
| v_input_9 | 21 | Average Length |
| v_input_10 | 60 | Over Bought Level 1 |
| v_input_11 | 53 | Over Bought Level 2 |
| v_input_12 | -60 | Over Sold Level 1 |
| v_input_13 | -53 | Over Sold Level 2 |
Source Pine Script
/*backtest
start: 2023-11-18 00:00:00
end: 2023-12-18 00:00:00
period: 1h
basePeriod: 15m
exchanges: [{"eid":"Futures_Binance","currency":"BTC_USDT"}]
*/

//
// @author LazyBear
//
// If you use this code in its original/modified form, do drop me a note.
//
//@version=4

// === INPUT BACKTEST RANGE ===
fromMonth = input(defval = 1,    title = "From Month",      type = input.integer, minval = 1, maxval = 12)
fromDay   = input(defval = 1,    title = "From Day",        type = input.integer, minval = 1, maxval = 31)
fromYear  = input(defval = 2021, title = "From Year",       type = input.integer, minval = 1970)
thruMonth = input(defval = 1,    title = "Thru Month",      type = input.integer, minval = 1, maxval = 12)
thruDay   = input(defval = 1,    title = "Thru Day",        type = input.integer, minval = 1, maxval = 31)
thruYear  = input(defval = 2112, title = "Thru Year",       type = input.integer, minval = 1970)

// === INPUT SHOW PLOT ===
showDate  = input(defval = true, title = "Show Date Range", type = input.bool)

// === FUNCTION EXAMPLE ===
start     = timestamp(fromYear, fromMonth, fromDay, 00, 00)        // backtest start window
finish    = timestamp(thruYear, thruMonth, thruDay, 23, 59)        // backtest finish window
window()  => true       // create function "within window of time"

n1 = input(10, "Channel Length")
n2 = input(21, "Average Length")
obLevel1 = input(60, "Over Bought Level 1")
obLevel2 = input(53, "Over Bought Level 2")
osLevel1 = input(-60, "Over Sold Level 1")
osLevel2 = input(-53, "Over Sold Level 2")

ap = hlc3
esa = ema(ap, n1)
d = ema(abs(ap - esa), n1)
ci = (ap - esa) / (0.015 * d)
tci = ema(ci, n2)

wt1 = tci
wt2 = sma(wt1,4)

plot(0, color=color.gray)
plot(obLevel1, color=color.red)
plot(osLevel1, color=color.green)
plot(obLevel2, color=color.red, style=3)
plot(osLevel2, color=color.green, style=3)

plot(wt1, color=color.white)
plot(wt2, color=color.fuchsia)
plot(wt1-wt2, color=color.new(color.blue, 80), style=plot.style_area)

//Strategy
strategy(title="T!M - Wave Trend Strategy", overlay = false, precision = 8, max_bars_back = 200, pyramiding = 0, initial_capital = 1000, currency = currency.NONE, default_qty_type = strategy.cash, default_qty_value = 1000, commission_type = "percent", commission_value = 0.1, calc_on_every_tick=false, process_orders_on_close=true)

longCondition  = crossover(wt1, wt2)
shortCondition = crossunder(wt1, wt2)

strategy.entry(id="Long Entry", comment="buy", long=true, when=longCondition and window())
strategy.close("Long Entry", comment="sell", when=shortCondition and window())

//strategy.entry(id="Short Entry", long=false, when=shortCondition)Published by ChaoZhang on the FMZ strategy square · last modified 2023-12-19. Collected in the Quant Trading Vault. Unvalidated research: re-test with your own data and costs before trusting it.
Build this with AgenKit
A spec is not a trading system. Paste this into your coding agent and AgenKit runs a specialist team — architecture, test-first build, risk gates, review — with paper trading on by default.
/agenkit build a production-grade trading bot with a backtest engine, risk controls and paper trading by default from strategies/The-Wave-Trend-Trading-Strategy-Based-on-LazyBear.md- npx agenkit install engineering-kit in your project
- Paste the command into your agent and approve each phase
- Get tests, backtest, risk controls and a paper-trading switch
Understand it first
Before you run this, read the lesson behind the idea and how to backtest it honestly. Specs like this one are the survivors of an unknown number of trials; deflate their results accordingly.
Related specs
- ADX MA and EMA Long Only Trend Tracking StrategyPine Script · Trend following · 1d
- ATR and Moving Average Crossover Hybrid StrategyPine Script · Trend following · 1h
- Bollinger Band Moving Average Crossover StrategyPine Script · Trend following · 1h
- Bollinger Bands and EMA Trend Following StrategyPine Script · Trend following · 1h
- Bollinger Bands and RSI Trend Following StrategyPine Script · Trend following · 1h
- Candlestick Pattern Trend Filter StrategyPine Script · Trend following · 1d