Strategy vault / Trend following
Three EMA Stochastic RSI Crossover Golden Cross Strategy
The Three EMA Stochastic RSI Crossover Golden Cross strategy is a trend following strategy. It combines the Three EMA indicator and the Stochastic Relative Strength Index to determine entry signals based on the…
Overview
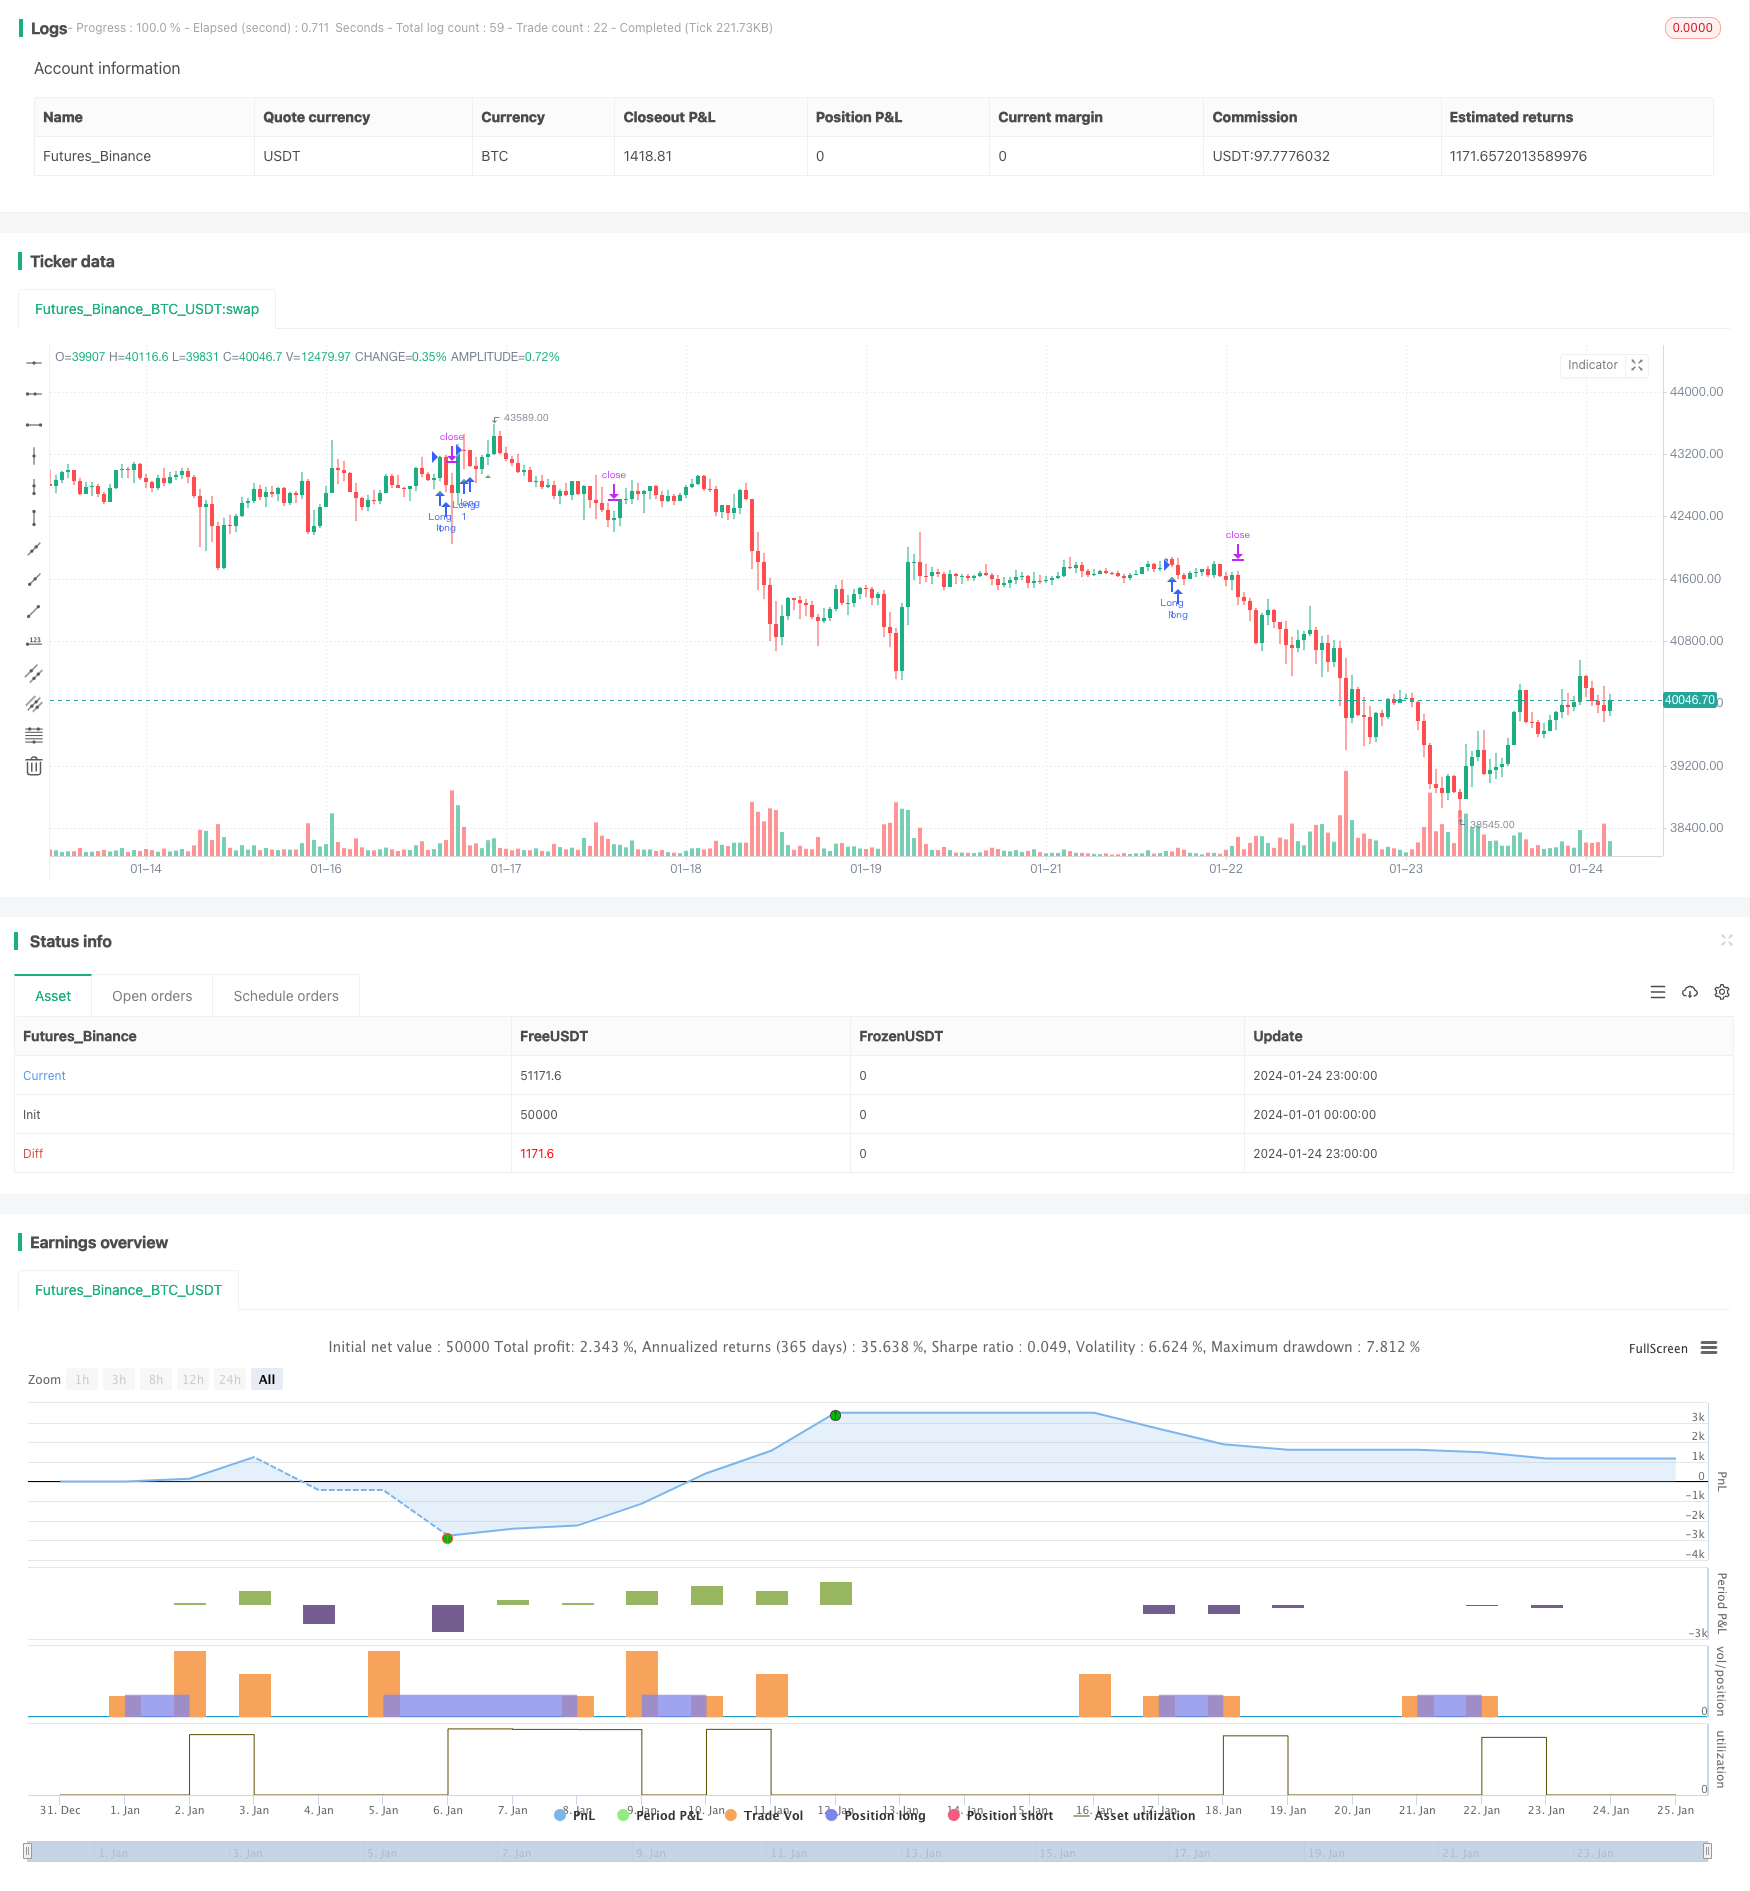
The Three EMA Stochastic RSI Crossover Golden Cross strategy is a trend following strategy. It combines the Three EMA indicator and the Stochastic Relative Strength Index to determine entry signals based on the crossover of the two indicators.
Strategy Logic
The signal determination of this strategy is based on the following logic:
Three EMA to determine the trend: 8-day EMA on top, 14-day EMA in the middle and 50-day EMA at the bottom form an uptrend; the reverse forms a downtrend.
Stochastic RSI to determine crossover: when the K line crosses above the D line from below, a golden cross signal is generated, indicating a strong uptrend.
Only go long; short is not considered for now.
When the Three EMA shows an uptrend and the Stochastic RSI generates a golden cross, go long. Set stop loss and take profit based on this to lock in profits.
Advantage Analysis
The main advantages of this strategy with dual indicator determination are:
Three EMA filters out short term noise and locks in medium-long term trends.
Stochastic RSI golden cross confirms strong uptrend.
ATR smart stop loss and take profit locks in profits.
Simple and clear strategy logic, easy to understand and implement.
Risk Analysis
The main risks of this strategy are:
Vulnerable to consolidation. Frequent open/close orders bring trading risk when Three EMA generates multiple crosses in sideways markets. This can be solved by optimizing EMA parameters or adding other filters.
No shorting opportunities. Only longs miss bottom rebound chances. Consider adding MACD to find shorts in downtrends.
Optimization Directions
The main optimization directions include:
Optimize EMA parameters to improve trend determination.
Add MACD etc to determine downtrends and increase short chances.
Add volatility indicators like ATR to improve stops and limits.
Incorporate volume to avoid false breakouts.
Utilize machine learning etc for parameter optimization.
Conclusion
In summary, the Three EMA Stochastic RSI Crossover strategy effectively filters out consolidation and locks in trends by combining dual indicator determination, making it a simple and practical trend following strategy. Further improvements on parameters, filters, technologies will lead to better strategy performance.
Parameters
| Name | Default | What it controls |
|---|---|---|
| v_input_1 | true | FromMonth |
| v_input_2 | true | FromDay |
| v_input_3 | 2020 | FromYear |
| v_input_4 | true | ToMonth |
| v_input_5 | true | ToDay |
| v_input_6 | 9999 | ToYear |
| v_input_7 | 3 | smoothK |
| v_input_8 | 3 | smoothD |
| v_input_9 | 14 | lengthRSI |
| v_input_10 | 14 | lengthStoch |
| v_input_11_close | 0 | RSI Source: close | high | low | open | hl2 | hlc3 | hlcc4 | ohlc4 |
| v_input_12 | 14 | ATR Length |
| v_input_13 | 8 | EMA 1 |
| v_input_14 | 14 | EMA 2 |
| v_input_15 | 50 | EMA 3 |
| v_input_16 | 2 | Profitfactor |
| v_input_17 | 3 | Stopfactor |
Source Pine Script
/*backtest
start: 2024-01-01 00:00:00
end: 2024-01-25 00:00:00
period: 1h
basePeriod: 15m
exchanges: [{"eid":"Futures_Binance","currency":"BTC_USDT"}]
*/

//@version=4

strategy(title="Stoch RSI Crossover Strat + EMA", shorttitle="Stoch RSI Cross + EMA Strat", overlay = true)

// Time Range
FromMonth=input(defval=1,title="FromMonth",minval=1,maxval=12)
FromDay=input(defval=1,title="FromDay",minval=1,maxval=31)
FromYear=input(defval=2020,title="FromYear",minval=2017)
ToMonth=input(defval=1,title="ToMonth",minval=1,maxval=12)
ToDay=input(defval=1,title="ToDay",minval=1,maxval=31)
ToYear=input(defval=9999,title="ToYear",minval=2017)
start=timestamp(FromYear,FromMonth,FromDay,00,00)
finish=timestamp(ToYear,ToMonth,ToDay,23,59)
window()=>true

// See if this bar's time happened on/after start date
afterStartDate = time >= start and time<=finish?true:false

//STOCH RSI
smoothK = input(3, minval=1)
smoothD = input(3, minval=1)
lengthRSI = input(14, minval=1)
lengthStoch = input(14, minval=1)
src = input(close, title="RSI Source")

rsi1 = rsi(src, lengthRSI)
k = sma(stoch(rsi1, rsi1, rsi1, lengthStoch), smoothK)
d = sma(k, smoothD)

//ATR
lengthATR = input(title="ATR Length", defval=14, minval=1)
atr = atr(lengthATR)

//MULTI EMA
emasrc = close,
len1 = input(8, minval=1, title="EMA 1")
len2 = input(14, minval=1, title="EMA 2")
len3 = input(50, minval=1, title="EMA 3")

ema1 = ema(emasrc, len1)
ema2 = ema(emasrc, len2)
ema3 = ema(emasrc, len3)

col1 = color.lime
col2 = color.blue
col3 = color.orange

//EMA Plots
//plot(ema1, title="EMA 1", linewidth=1, color=col1)
//plot(ema2, title="EMA 2", linewidth=1, color=col2)
//plot(ema3, title="EMA 3", linewidth=1, color=col3)

crossup = k[0] > d[0] and k[1] <= d[1]
emapos = ema1 > ema2 and ema2 > ema3 and close > ema1
barbuy = crossup and emapos

//plotshape(crossup, style=shape.triangleup, location=location.belowbar, color=color.white)
plotshape(barbuy, style=shape.triangleup, location=location.belowbar, color=color.green)

longloss = sma(open, 1)
//plot(longloss, color=color.red)

//Buy and Sell Factors
profitfactor = input(title="Profitfactor", type=input.float, step=0.1, defval=2)
stopfactor = input(title="Stopfactor", type=input.float, step=0.1, defval=3)
bought = strategy.position_size[1] < strategy.position_size
longcondition = barbuy

if (longcondition) and (afterStartDate) and strategy.opentrades < 1
    strategy.entry("Long", strategy.long)

if (afterStartDate) and strategy.opentrades > 0
    barsbought = barssince(bought)
    profit_level = strategy.position_avg_price + (atr*profitfactor)
    stop_level = strategy.position_avg_price - (atr*stopfactor)
    strategy.exit("Take Profit/ Stop Loss", "Long", stop=stop_level[barsbought], limit=profit_level[barsbought])
Published by ChaoZhang on the FMZ strategy square · last modified 2024-01-26. Collected in the Quant Trading Vault. Unvalidated research: re-test with your own data and costs before trusting it.
Build this with AgenKit
A spec is not a trading system. Paste this into your coding agent and AgenKit runs a specialist team — architecture, test-first build, risk gates, review — with paper trading on by default.
/agenkit build a production-grade trading bot with a backtest engine, risk controls and paper trading by default from strategies/Three-EMA-Stochastic-RSI-Crossover-Golden-Cross-Strategy.md- npx agenkit install engineering-kit in your project
- Paste the command into your agent and approve each phase
- Get tests, backtest, risk controls and a paper-trading switch
Understand it first
Before you run this, read the lesson behind the idea and how to backtest it honestly. Specs like this one are the survivors of an unknown number of trials; deflate their results accordingly.
Related specs
- Mini Pullback Supertrend StrategyPine Script · Trend following · 1h
- Three Exponential Moving Averages and Stochastic Relative Strength Index Trading StrategyPine Script · Trend following · 1h
- Price Divergence Based Trend Trading StrategyPine Script · Trend following · 2h
- SuperTrend Trading Strategy with Multiple FiltersPine Script · Trend following · 1h
- Bollinger Bands and RSI Trend Following StrategyPine Script · Trend following · 1h
- Dual ATR Channel Trend Following StrategyPine Script · Trend following · 15m