TMA Overlay
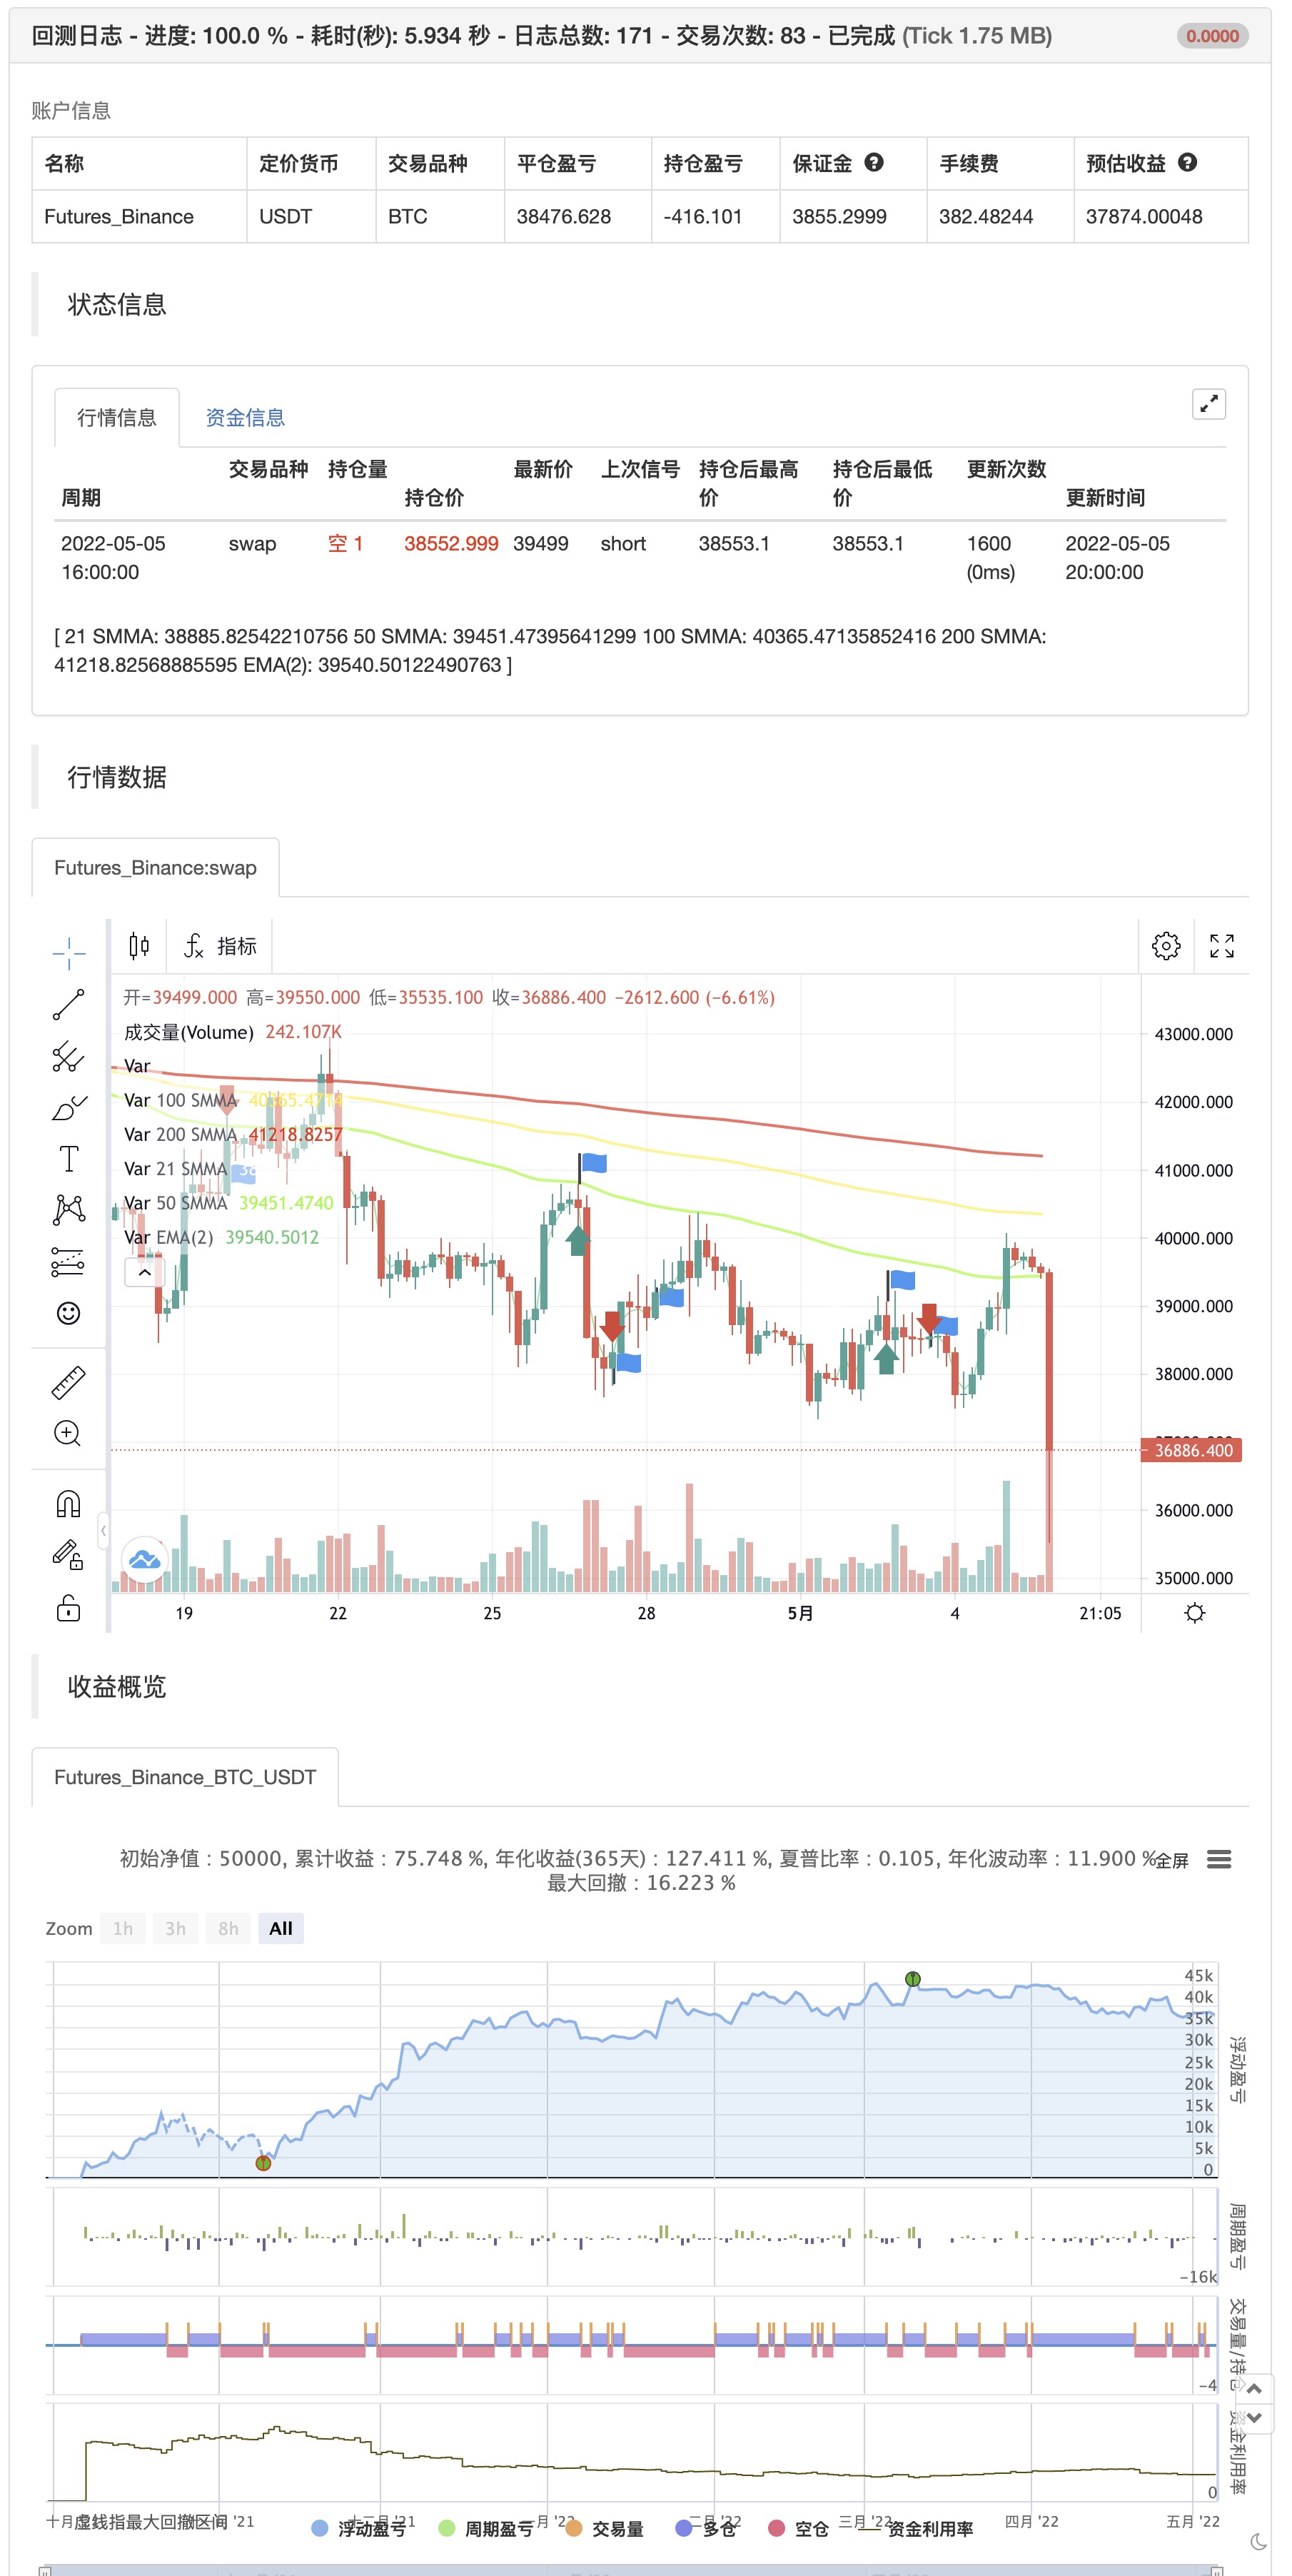
This indicator help identify momentum by offering a visual representation of engulfing candlestick patters overlayed with smoothed moving averages backtest
This indicator help identify momentum by offering a visual representation of engulfing candlestick patters overlayed with smoothed moving averages
backtest
Parameters
| Name | Default | What it controls |
|---|---|---|
| v_input_1 | true | (?Smoothed MA Inputs)Show 100 Line |
| v_input_2 | true | Show Trend Fill |
| v_input_3 | true | (?3 Line Strike)Show Bearish 3 Line Strike |
| v_input_4 | true | Show Bullish 3 Line Strike |
Source Pine Script
/*backtest
start: 2021-10-01 00:00:00
end: 2022-05-05 23:59:00
period: 4h
basePeriod: 15m
exchanges: [{"eid":"Futures_Binance","currency":"BTC_USDT"}]
*/

//@version=4
study(title="TMA Overlay", shorttitle="TMA Overlay", overlay=true)

// ### Four Smoothed Moving Averages

len1 = 21
//input(21, minval=1, title="Length 1", group = "Smoothed MA Inputs")
src1 = close
//input(close, title="Source 1", group = "Smoothed MA Inputs")
smma1 = 0.0
sma_1 = sma(src1, len1)
smma1 := na(smma1[1]) ? sma_1 : (smma1[1] * (len1 - 1) + src1) / len1
plot(smma1, color=color.white, linewidth=2, title="21 SMMA")

len2 = 50
//input(50, minval=1, title="Length 2", group = "Smoothed MA Inputs")
src2 = close
//input(close, title="Source 2", group = "Smoothed MA Inputs")
smma2 = 0.0
sma_2 = sma(src2, len2)
smma2 := na(smma2[1]) ? sma_2 : (smma2[1] * (len2 - 1) + src2) / len2
plot(smma2, color=color.new(#6aff00,0), linewidth=2, title="50 SMMA")

h100 = input(title="Show 100 Line", type=input.bool, defval=true, group = "Smoothed MA Inputs")
len3 = 100
//input(100, minval=1, title="Length 3", group = "Smoothed MA Inputs")
src3 = close
//input(close, title="Source 3", group = "Smoothed MA Inputs")
smma3 = 0.0
sma_3 = sma(src3, len3)
smma3 := na(smma3[1]) ? sma_3 : (smma3[1] * (len3 - 1) + src3) / len3
sma3plot = plot(h100 ? smma3 : na, color=color.new(color.yellow,0), linewidth=2, title="100 SMMA")

len4 = 200
//input(200, minval=1, title="Length 4", group = "Smoothed MA Inputs")
src4 = close
//input(close, title="Source 4", group = "Smoothed MA Inputs")
smma4 = 0.0
sma_4 = sma(src4, len4)
smma4 := na(smma4[1]) ? sma_4 : (smma4[1] * (len4 - 1) + src4) / len4
sma4plot = plot(smma4, color=color.new(#ff0500,0), linewidth=2, title="200 SMMA")

// Trend Fill

trendFill = input(title="Show Trend Fill", type=input.bool, defval=true, group = "Smoothed MA Inputs")
ema2 = ema(close, 2)
ema2plot = plot(ema2, color=#2ecc71, transp=100, style=plot.style_line, linewidth=1, title="EMA(2)", editable = false)

//fill(ema2plot, sma4plot, color=ema2 > smma4 and trendFill ? color.green : ema2 < smma4 and trendFill ? color.red : na, transp=85, title = "Trend Fill")

// End ###

// ### 3 Line Strike

bearS = input(title="Show Bearish 3 Line Strike", type=input.bool, defval=true, group = "3 Line Strike")
bullS = input(title="Show Bullish 3 Line Strike", type=input.bool, defval=true, group = "3 Line Strike")

bearSig = close[3] > open[3] and close[2] > open[2] and close[1] > open[1] and close < open[1]
bullSig = close[3] < open[3] and close[2] < open[2] and close[1] < open[1] and close > open[1]

if bullSig
    strategy.entry("entry short", strategy.short)
else if bearSig
    strategy.entry("entry long", strategy.long)


plotshape(bullS ? bullSig : na, style=shape.triangleup, color=color.green, location=location.belowbar, size = size.small,  text="3s-Bull", title="3 Line Strike Up")
plotshape(bearS ? bearSig : na, style=shape.triangledown, color=color.red, location=location.abovebar, size = size.small,  text="3s-Bear", title="3 Line Strike Down")


// End ###
Published by ChaoZhang on the FMZ strategy square · last modified 2022-05-07. Collected in the Quant Trading Vault. Unvalidated research: re-test with your own data and costs before trusting it.
Build this with AgenKit
A spec is not a trading system. Paste this into your coding agent and AgenKit runs a specialist team — architecture, test-first build, risk gates, review — with paper trading on by default.
/agenkit build a production-grade trading bot with a backtest engine, risk controls and paper trading by default from strategies/TMA-Overlay.md- npx agenkit install engineering-kit in your project
- Paste the command into your agent and approve each phase
- Get tests, backtest, risk controls and a paper-trading switch
Understand it first
Before you run this, read the lesson behind the idea and how to backtest it honestly. Specs like this one are the survivors of an unknown number of trials; deflate their results accordingly.
Related specs
- ADX Momentum Trend StrategyPine Script · Momentum · 10m
- Bollinger Bands Momentum Trend Following Quantitative StrategyPine Script · Momentum · 1d
- KST EMA Momentum Trend Following StrategyPine Script · Momentum · 1d
- MACD Momentum Indicator Backtest StrategyPine Script · Momentum · 1h
- MACD of Relative Strength StrategyPine Script · Momentum · 1d
- Momentum Strategy Based on DEMA and EMA Crossover with ATR Volatility FilterPine Script · Momentum · 1h