Strategy vault / Machine learning
Trading Strategy Based on Bollinger Bands and MACD
This strategy combines Bollinger Bands and MACD indicator to identify oversold opportunities and trend reversals for quantitative trading. The strategy name is "Bollinger MACD Reversal Strategy".
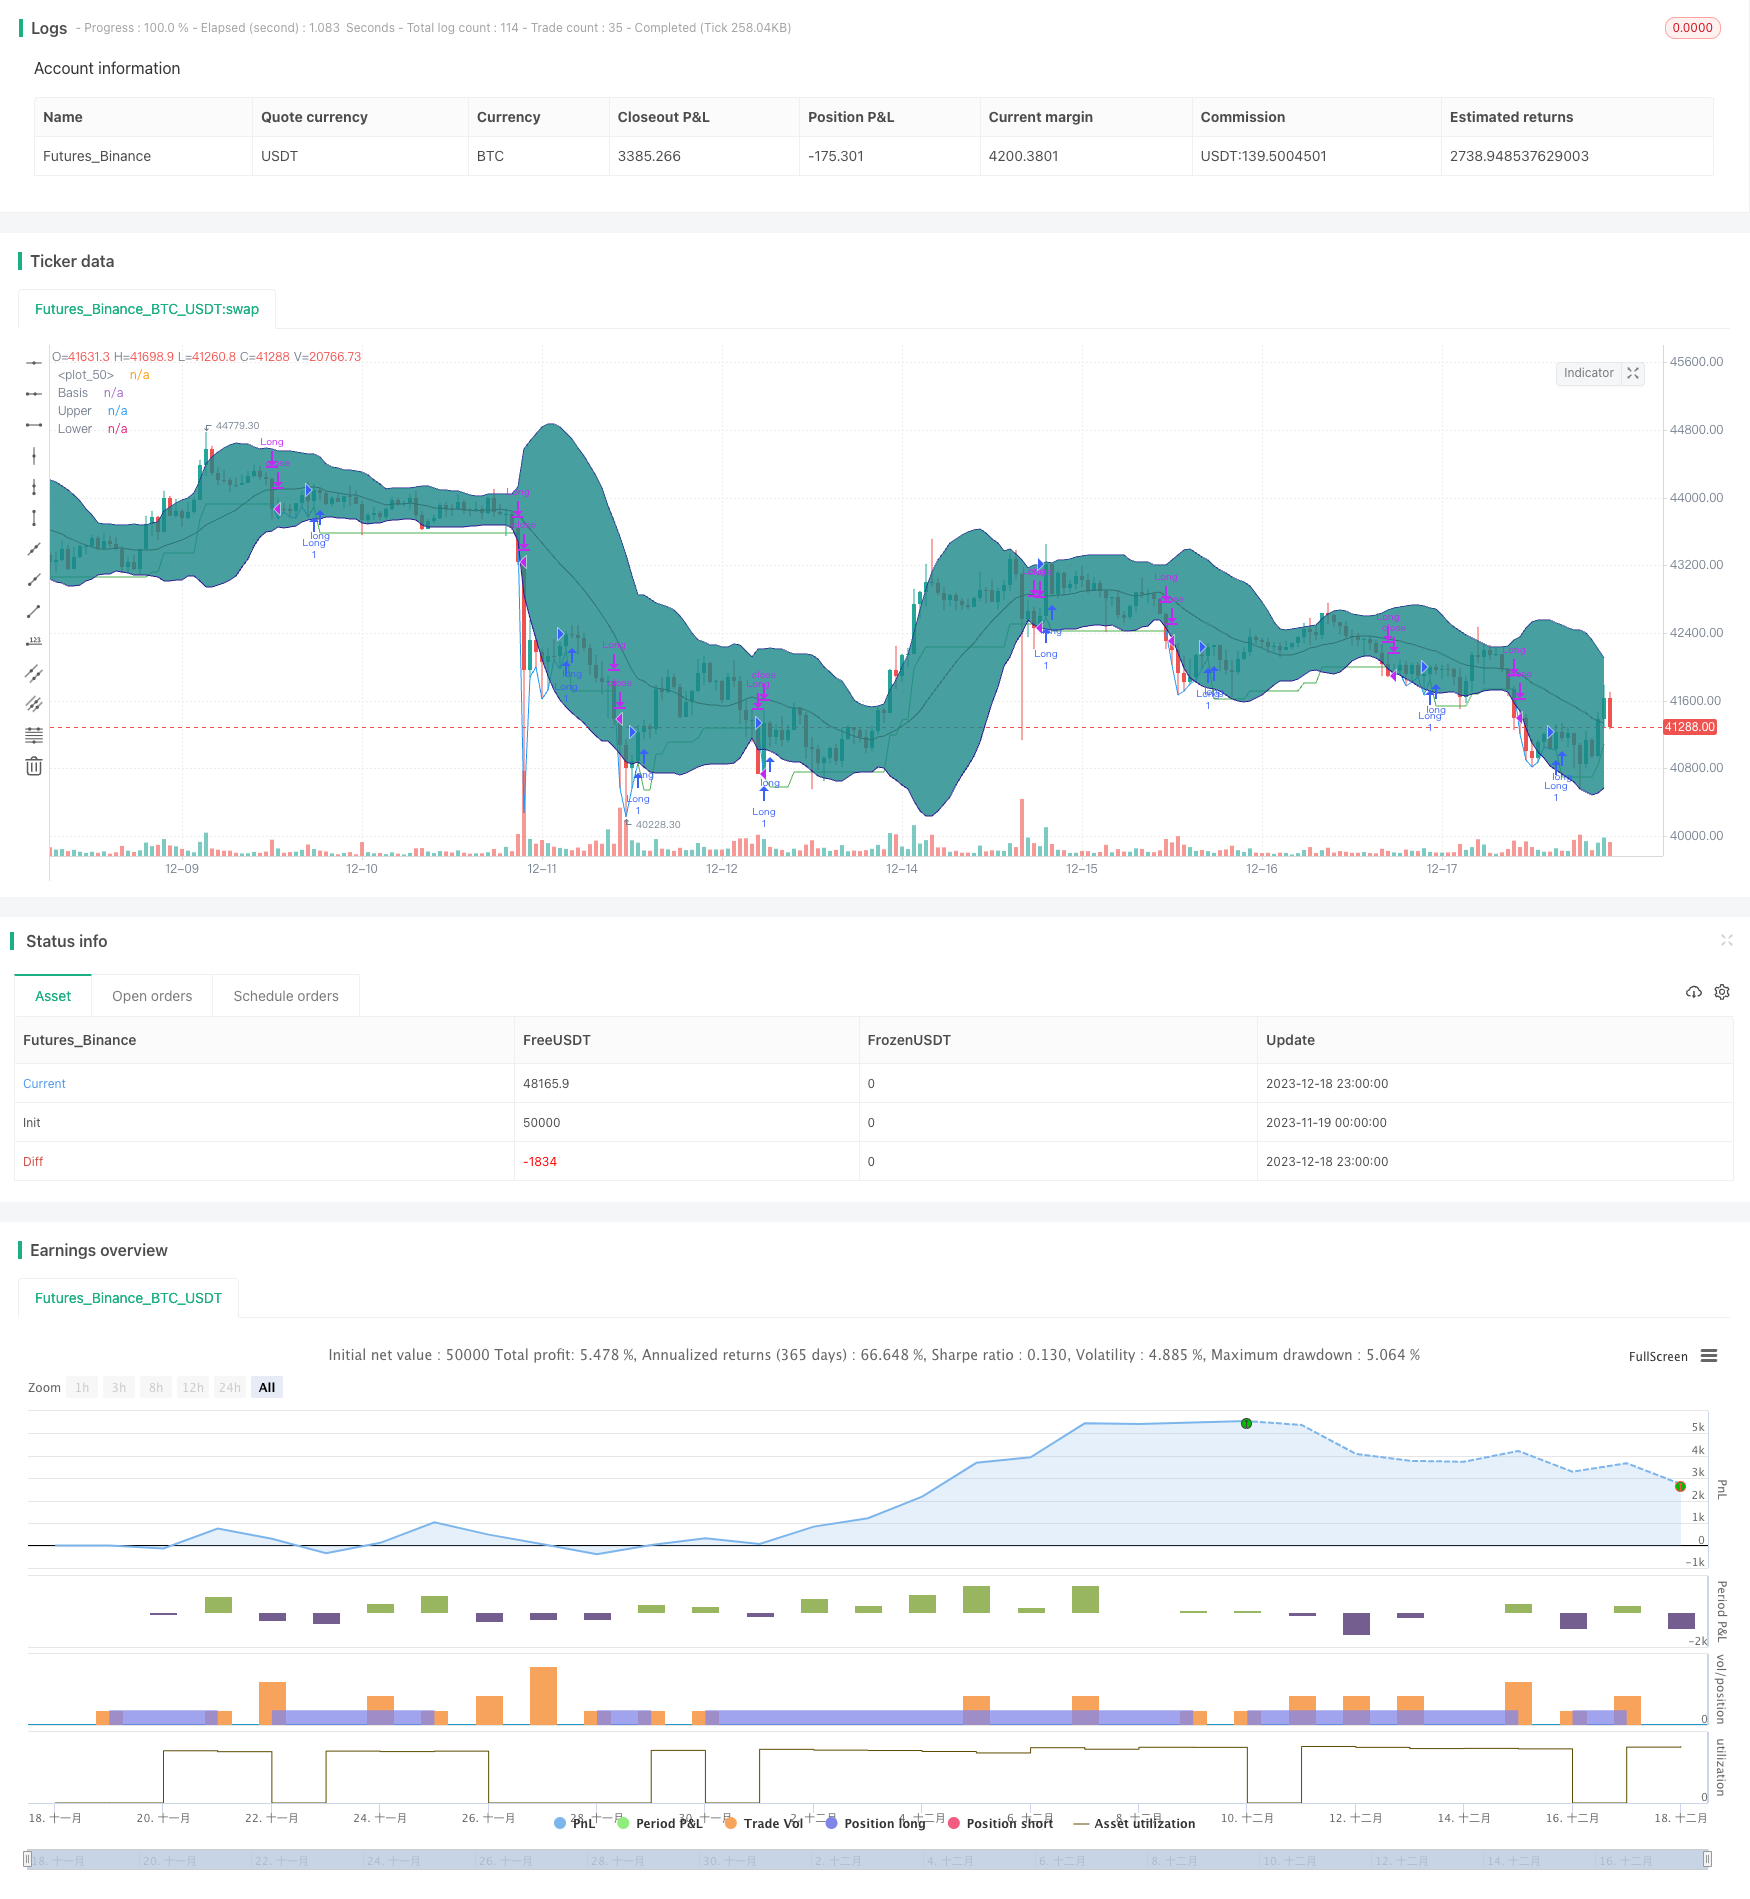
Overview
This strategy combines Bollinger Bands and MACD indicator to identify oversold opportunities and trend reversals for quantitative trading. The strategy name is "Bollinger MACD Reversal Strategy".
Strategy Logic
The strategy first calculates 20-day Bollinger Bands, including middle band, upper band and lower band. When price touches the lower band, it considers the market oversold. At this point, combine with MACD indicator to judge whether the trend is reversing. If MACD histogram crosses above signal line positively, it determines the end of this round of decline, which corresponds to the buy signal.
Specifically, touching the Bollinger lower band and MACD histogram crossing signal line positively triggers the buy signal simultaneously. When close price rises above the stop loss level, it triggers the take profit signal.
Advantage Analysis
The strategy integrates Bollinger Bands to judge oversold zone and MACD to determine trend reversal signals, realizing relatively lower entry price. It also includes take profit methods to lock in profits and avoid losses.
In particular, the advantages are:
- Combining Bollinger Bands oversold zone and MACD indicator to achieve better entry points
- Using MACD indicator to determine trend reversal points, reducing false breakout probabilities
- Adopting stop loss/take profit methods to effectively control risks
Risk Analysis
There are still some risks mainly in the following aspects:
- Probability of Bollinger Bands breakout exists, which may cause failure in oversold zone judgement
- MACD histogram crossover could also be false one with judgement error probability
- Stop loss position setting may be improper, either too loose or strict, leading to insufficient defence or premature stop loss
To hedge against the above risks, we can take the following measures:
- Combine with other indicators to verify validity of Bollinger Bands breakout signals
- Add momentum indicators etc. as filters to avoid MACD false crossover
- Optimize and test different stop loss parameters
Optimization Directions
There is still room for further optimization, mainly including:
- Optimize Bollinger Bands parameters to find better oversold judgement schemes
- Add momentum indicators filters to improve MACD judgement validity
- Test stop loss methods like ATR to find better parameters
- Add trend judgement module to avoid counter trend trading
- Combine machine learning methods to train judgement models and improve overall strategy performance
Conclusion
The strategy integrates Bollinger Bands oversold zone judgement and MACD trend reversal indicator to achieve relatively better entry points. It also sets up stop loss/take profit methods to control risks. This is a worthwhile low buy high sell strategy to reference and optimize. Combined with more indicator filters and machine learning methods, there is still space to further improve its performance.
Parameters
| Name | Default | What it controls |
|---|---|---|
| v_input_1 | timestamp(01 Nov 2010 13:30 +0000) | Backtest Start Time |
| v_input_2 | false | Exit when Risk:Reward met |
| v_input_3 | 3 | Risk:[Reward] (i.e. 3) for exit |
| v_input_4 | 2 | ATR multiplier for stop loss |
Source Pine Script
/*backtest
start: 2023-11-19 00:00:00
end: 2023-12-19 00:00:00
period: 1h
basePeriod: 15m
exchanges: [{"eid":"Futures_Binance","currency":"BTC_USDT"}]
*/

// This source code is subject to the terms of the Mozilla Public License 2.0 at https://mozilla.org/MPL/2.0/
// © DojiEmoji

//@version=4
strategy("[KL] BOLL + MACD Strategy v2 (published)",overlay=true)

// BOLL bands {
BOLL_length = 20
BOLL_src = close
BOLL_mult = 2.0
BOLL_basis = sma(BOLL_src, BOLL_length)
BOLL_dev = BOLL_mult * stdev(BOLL_src, BOLL_length)
BOLL_upper = BOLL_basis + BOLL_dev
BOLL_lower = BOLL_basis - BOLL_dev
BOLL_offset = 0
plot(BOLL_basis, "Basis", color=#872323, offset = BOLL_offset)
BOLL_p1 = plot(BOLL_upper, "Upper", color=color.navy, offset = BOLL_offset, transp=50)
BOLL_p2 = plot(BOLL_lower, "Lower", color=color.navy, offset = BOLL_offset, transp=50)
fill(BOLL_p1, BOLL_p2, title = "Background", color=#198787, transp=85)
// }
// MACD signals {
MACD_fastLen = 12
MACD_slowLen = 26
MACD_Len = 9
MACD = ema(close, MACD_fastLen) - ema(close, MACD_slowLen)
aMACD = ema(MACD, MACD_Len)
MACD_delta = MACD - aMACD
// }
backtest_timeframe_start = input(defval = timestamp("01 Nov 2010 13:30 +0000"), title = "Backtest Start Time", type = input.time)
//backtest_timeframe_end = input(defval = timestamp("05 Mar 2021 19:30 +0000"), title = "Backtest End Time", type = input.time)
TARGET_PROFIT_MODE = input(false,title="Exit when Risk:Reward met")
REWARD_RATIO = input(3,title="Risk:[Reward] (i.e. 3) for exit")
// Trailing stop loss {
var entry_price = float(0)
ATR_multi_len = 26
ATR_multi = input(2, "ATR multiplier for stop loss")
ATR_buffer = atr(ATR_multi_len) * ATR_multi
risk_reward_buffer = (atr(ATR_multi_len) * ATR_multi) * REWARD_RATIO
take_profit_long = low > entry_price + risk_reward_buffer
take_profit_short = low < entry_price - risk_reward_buffer
var bar_count = 0 //number of bars since entry
var trailing_SL_buffer = float(0)
var stop_loss_price = float(0)
stop_loss_price := max(stop_loss_price, close - trailing_SL_buffer)
// plot TSL line
trail_profit_line_color = color.green
if strategy.position_size == 0
    trail_profit_line_color := color.blue
    stop_loss_price := low
plot(stop_loss_price,color=trail_profit_line_color)
// }

var touched_lower_bb = false

if true// and time <= backtest_timeframe_end
    if low <= BOLL_lower
        touched_lower_bb := true
    else if strategy.position_size > 0
        touched_lower_bb := false//reset state
    expected_rebound = MACD > MACD[1] and abs(MACD - aMACD) < abs(MACD[1] - aMACD[1])
    buy_condition = touched_lower_bb and MACD > aMACD or expected_rebound

    //ENTRY:
    if strategy.position_size == 0 and buy_condition
        entry_price := close
        trailing_SL_buffer := ATR_buffer
        stop_loss_price := close - ATR_buffer
        strategy.entry("Long",strategy.long, comment="buy")
        bar_count := 0
    else if strategy.position_size > 0
        bar_count := bar_count + 1

    //EXIT:
    // Case (A) hits trailing stop
    if strategy.position_size > 0 and close <= stop_loss_price
        if close > entry_price
            strategy.close("Long", comment="take profit [trailing]")
            stop_loss_price := 0
        else if close <= entry_price and bar_count
            strategy.close("Long", comment="stop loss")
            stop_loss_price := 0
        bar_count := 0
    // Case (B) take targeted profit relative to risk
    if strategy.position_size > 0 and TARGET_PROFIT_MODE
        if take_profit_long
            strategy.close("Long", comment="take profits [risk:reward]")
            stop_loss_price := 0
bar_count := 0Published by ChaoZhang on the FMZ strategy square · last modified 2023-12-20. Collected in the Quant Trading Vault. Unvalidated research: re-test with your own data and costs before trusting it.
Build this with AgenKit
A spec is not a trading system. Paste this into your coding agent and AgenKit runs a specialist team — architecture, test-first build, risk gates, review — with paper trading on by default.
/agenkit build a production-grade trading bot with a backtest engine, risk controls and paper trading by default from strategies/Trading-Strategy-Based-on-Bollinger-Bands-and-MACD.md- npx agenkit install engineering-kit in your project
- Paste the command into your agent and approve each phase
- Get tests, backtest, risk controls and a paper-trading switch
Understand it first
Before you run this, read the lesson behind the idea and how to backtest it honestly. Specs like this one are the survivors of an unknown number of trials; deflate their results accordingly.
Related specs
- ADX EFI 50 Moving Average Channel Pullback StrategyPine Script · Machine learning · 1h
- Dual Moving Average Matching Strategy Based on Bollinger BandsPine Script · Machine learning · 1h
- EMA and RSI Quantitative Trading StrategyPine Script · Machine learning · 1h
- Multi Indicator Dynamic Adaptive Quantitative Trading StrategyPine Script · Machine learning · 1h
- Triple Moving Average Combined with MACD Quantitative StrategyPine Script · Machine learning · 1d
- High Low Cryptocurrency Strategy Based on Multiple IndicatorsPine Script · Machine learning · 45m