Strategy vault / Mean reversion
TradingVMA Variable Moving Average Trading Strategy
The TradingVMA strategy is a quantitative trading strategy based on variable moving average lines. It utilizes changing moving averages to capture market trends and generate trading signals accordingly.
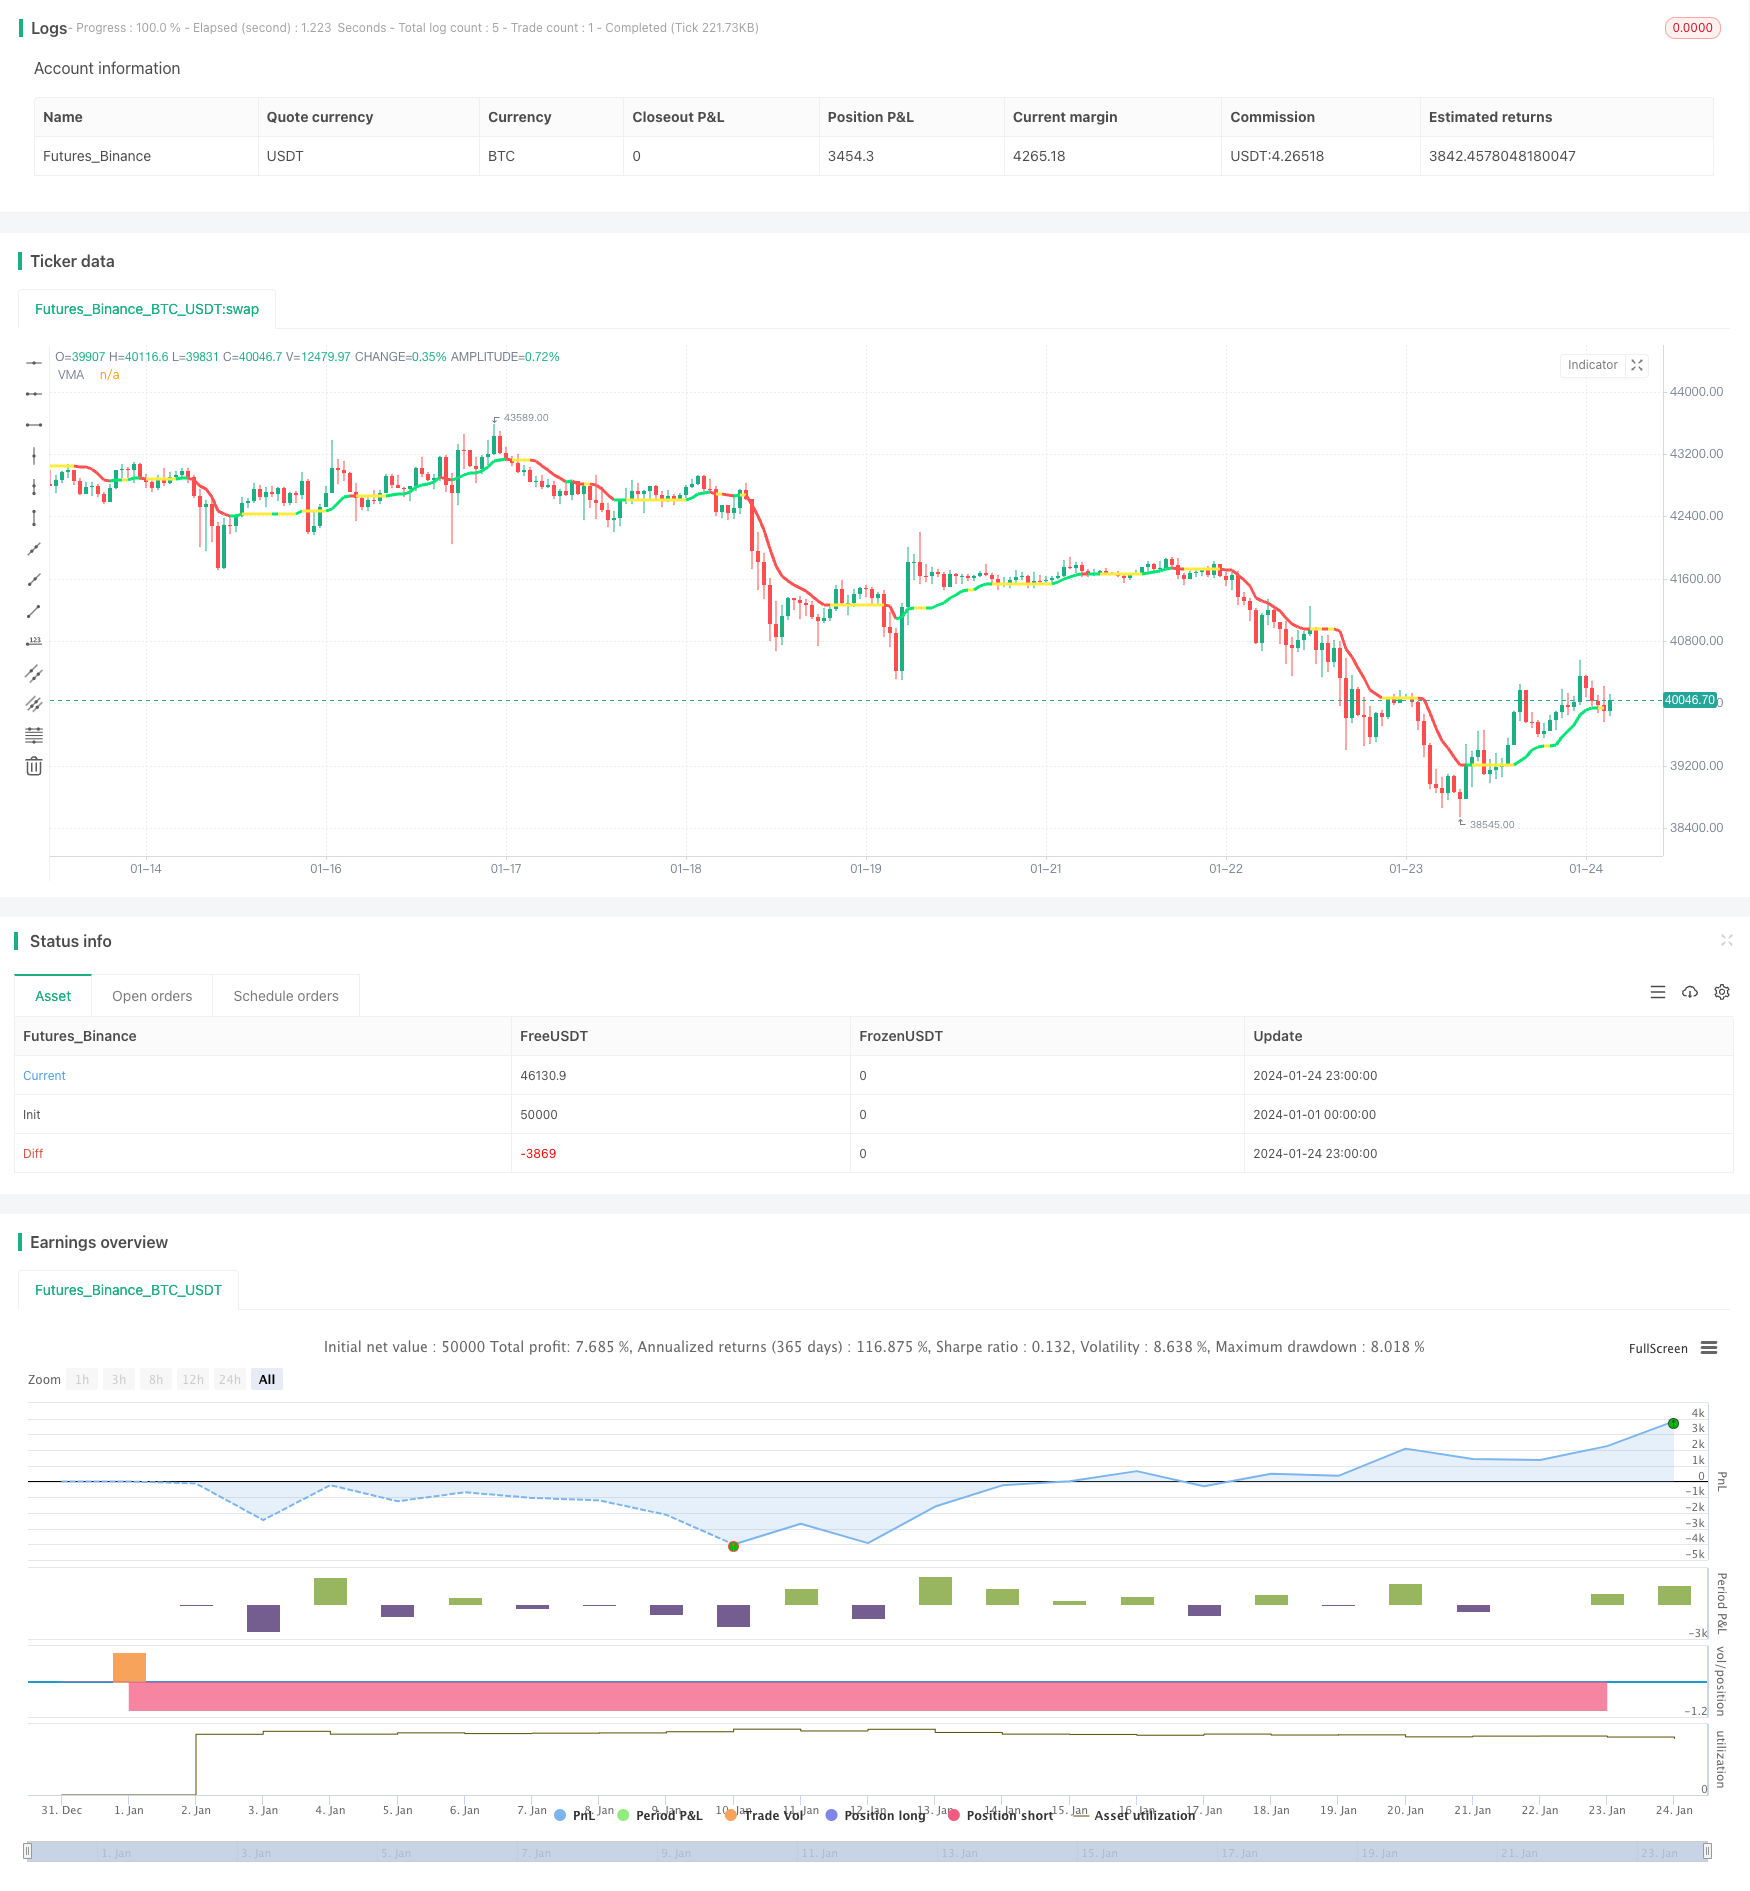
Overview
The TradingVMA strategy is a quantitative trading strategy based on variable moving average lines. It utilizes changing moving averages to capture market trends and generate trading signals accordingly.
Strategy Logic
The core of the TradingVMA strategy is the calculation of variable length moving averages (Variable Moving Average, VMA). The moving average is a widely known technical indicator that computes the average price over a certain period. The VMA used in the TradingVMA strategy has varying period lengths.
Specifically, the strategy first computes a series of intermediate quantities, such as Price Directional Movement Indicator (PDM, MDIM), smoothed data (PDMs, MDMs). These data are eventually used to obtain the indicator strength (iS). This indicator reflects the intensity of price fluctuations.
Then, the TradingVMA strategy dynamically adjusts the moving average period based on the indicator strength. When market volatility increases, the moving average period becomes shorter, and vice versa. This allows faster response to market changes.
Finally, the strategy compares the current price with the VMA to generate trading signals. It goes long when price is above VMA and goes short when price is below VMA.
Advantage Analysis
The TradingVMA strategy has the following main advantages:
Variable Period Filters Noise More Steady – The variable moving average period adapts to market changes for filtering out noise and more stable trend signals.
Faster Response to Price Changes Improves Responsiveness – The variable moving average can respond swiftly to price changes and capture trend reversal points.
Reduces Trading Frequency Less Overtrading - Compared to fixed-period indicators, TradingVMA can reduce unnecessary trades.
Customizable Parameters Flexibility - The strategy allows users to select parameters based on their preferences to suit different market environments.
Risk Analysis
The TradingVMA strategy also has the following primary risks:
Missing Rapid Reversals – When trends reverse rapidly, the continuously adjusting moving average may lag in responding.
Lagging Bias – All moving average strategies have some degree of lagging bias, either long or short.
Wrong Signals –TradingVMA may generate incorrect long/short signals in range-bound sideways markets.
Difficult Parameter Optimization – Finding the optimal parameter combination can be challenging.
These risks can be controlled via methods like stop losses, adjusting parameter combinations, etc.
Optimization Directions
The TradingVMA strategy can also be enhanced in the following aspects:
Combine Other Indicators – Using with other trend, counter-trend indicators can improve signal quality.
Parameter Optimization – Discover optimum parameters via backtesting and optimization.
Adaptive Trading Rules – Employ different entry rules, stop losses per market regime.
Systemization – Algorithmize and systemize the strategy for easier optimization.
Conclusion
TradingVMA is an adaptive quantitative strategy. It captures market trends using a specially designed VMA indicator, with the edge of being responsive and filtering out noise. The strategy can be upgraded in multiple ways for better performance. But some inherent issues like lagging bias may persist. Overall, TradingVMA is a promising trend-following strategy.
Parameters
| Name | Default | What it controls |
|---|---|---|
| v_input_1 | 5 | VMA Length |
| v_input_2 | true | Show Trend Direction Colors |
| v_input_3 | false | Use take profit? |
| v_input_4 | 100 | Take profit pips |
| v_input_5 | false | Use stop loss? |
| v_input_6 | 100 | Stop loss pips |
| v_input_7 | true | From Day |
| v_input_8 | true | From Month |
| v_input_9 | 2000 | From Year |
| v_input_10 | 31 | To Day |
| v_input_11 | 12 | To Month |
| v_input_12 | 2019 | To Year |
Source Pine Script
/*backtest
start: 2024-01-01 00:00:00
end: 2024-01-24 23:59:59
period: 1h
basePeriod: 15m
exchanges: [{"eid":"Futures_Binance","currency":"BTC_USDT"}]
*/

// This source code is subject to the terms of the Mozilla Public License 2.0 at https://mozilla.org/MPL/2.0/
// © laptevmaxim92

//@version=4
strategy("Variable Moving Average Strategy", overlay=true)

src=close
l =input(5, title="VMA Length")
std=input(true, title="Show Trend Direction Colors")

utp = input(false, "Use take profit?")
pr = input(100, "Take profit pips")
usl = input(false, "Use stop loss?")
sl = input(100, "Stop loss pips")
fromday = input(01, defval=01, minval=01, maxval=31, title="From Day")
frommonth = input(01, defval=01, minval= 01, maxval=12, title="From Month")
fromyear = input(2000, minval=1900, maxval=2100, title="From Year")
today = input(31, defval=01, minval=01, maxval=31, title="To Day")
tomonth = input(12, defval=12, minval=01, maxval=12, title="To Month")
toyear = input(2019, minval=1900, maxval=2100, title="To Year")

use_date = (time > timestamp(fromyear, frommonth, fromday, 00, 00) and time < timestamp(toyear, tomonth, today, 00, 00))

k = 1.0/l
pdm = 0.0
pdm := max((src - src[1]), 0)
mdm = 0.0
mdm := max((src[1] - src), 0)
pdmS = 0.0
pdmS := ((1 - k)*nz(pdmS[1]) + k*pdm)
mdmS = 0.0
mdmS := ((1 - k)*nz(mdmS[1]) + k*mdm)
s = pdmS + mdmS
pdi = pdmS/s
mdi = mdmS/s
pdiS = 0.0
pdiS := ((1 - k)*nz(pdiS[1]) + k*pdi)
mdiS = 0.0
mdiS := ((1 - k)*nz(mdiS[1]) + k*mdi)
d = abs(pdiS - mdiS)
s1 = pdiS + mdiS
iS = 0.0
iS := ((1 - k)*nz(iS[1]) + k*d/s1)
hhv = highest(iS, l)
llv = lowest(iS, l)
d1 = hhv - llv
vI = (iS - llv)/d1
vma = 0.0
vma := (1 - k*vI)*nz(vma[1]) + k*vI*src
vmaC=(vma > vma[1]) ? color.lime : (vma<vma[1]) ? color.red : (vma==vma[1]) ? color.yellow : na
plot(vma, color=std?vmaC:color.white, linewidth=3, title="VMA")

longCondition = vma > vma[1]
if (longCondition)
    strategy.entry("BUY", strategy.long and use_date)

shortCondition = vma < vma[1]
if (shortCondition)
    strategy.entry("SELL", strategy.short and use_date)

if (utp and not usl)
    strategy.exit("TP", "BUY", profit = pr)
    strategy.exit("TP", "SELL", profit = pr)

if (usl and not utp)
    strategy.exit("SL", "BUY", loss = sl)
    strategy.exit("SL", "SELL", loss = sl)

if (usl and utp)
    strategy.exit("TP/SL", "BUY", loss = sl, profit = pr)
strategy.exit("TP/SL", "SELL", loss = sl, profit = pr)Published by ChaoZhang on the FMZ strategy square · last modified 2024-02-21. Collected in the Quant Trading Vault. Unvalidated research: re-test with your own data and costs before trusting it.
Build this with AgenKit
A spec is not a trading system. Paste this into your coding agent and AgenKit runs a specialist team — architecture, test-first build, risk gates, review — with paper trading on by default.
/agenkit build a production-grade trading bot with a backtest engine, risk controls and paper trading by default from strategies/TradingVMA-Variable-Moving-Average-Trading-Strategy.md- npx agenkit install engineering-kit in your project
- Paste the command into your agent and approve each phase
- Get tests, backtest, risk controls and a paper-trading switch
Understand it first
Before you run this, read the lesson behind the idea and how to backtest it honestly. Specs like this one are the survivors of an unknown number of trials; deflate their results accordingly.
Related specs
- Advanced Momentum EMA Trend Following with RSI Overbought Oversold Trading StrategyPine Script · Mean reversion · 1d
- Momentum Indicator RSI Reversal Trading StrategyPine Script · Mean reversion · 1d
- Moving Average Envelopes Trading StrategyPine Script · Mean reversion · 1h
- Multi Indicator Reversal Point Capture Trading StrategyPine Script · Mean reversion · 1d
- Reversal Trading Strategy with Bollinger Bands RSI ADX and ATRPine Script · Mean reversion · 1h
- Trend Reversal Momentum Indicators Crossover Tracking StrategyPine Script · Mean reversion · 1h