Trend Following Momentum Breakout Strategy
The strategy is named "Trend Following Momentum Breakout Strategy". It uses the Super Trend indicator to determine the current trend direction and combines it with the direction of candlestick bodies for trend…
Overview
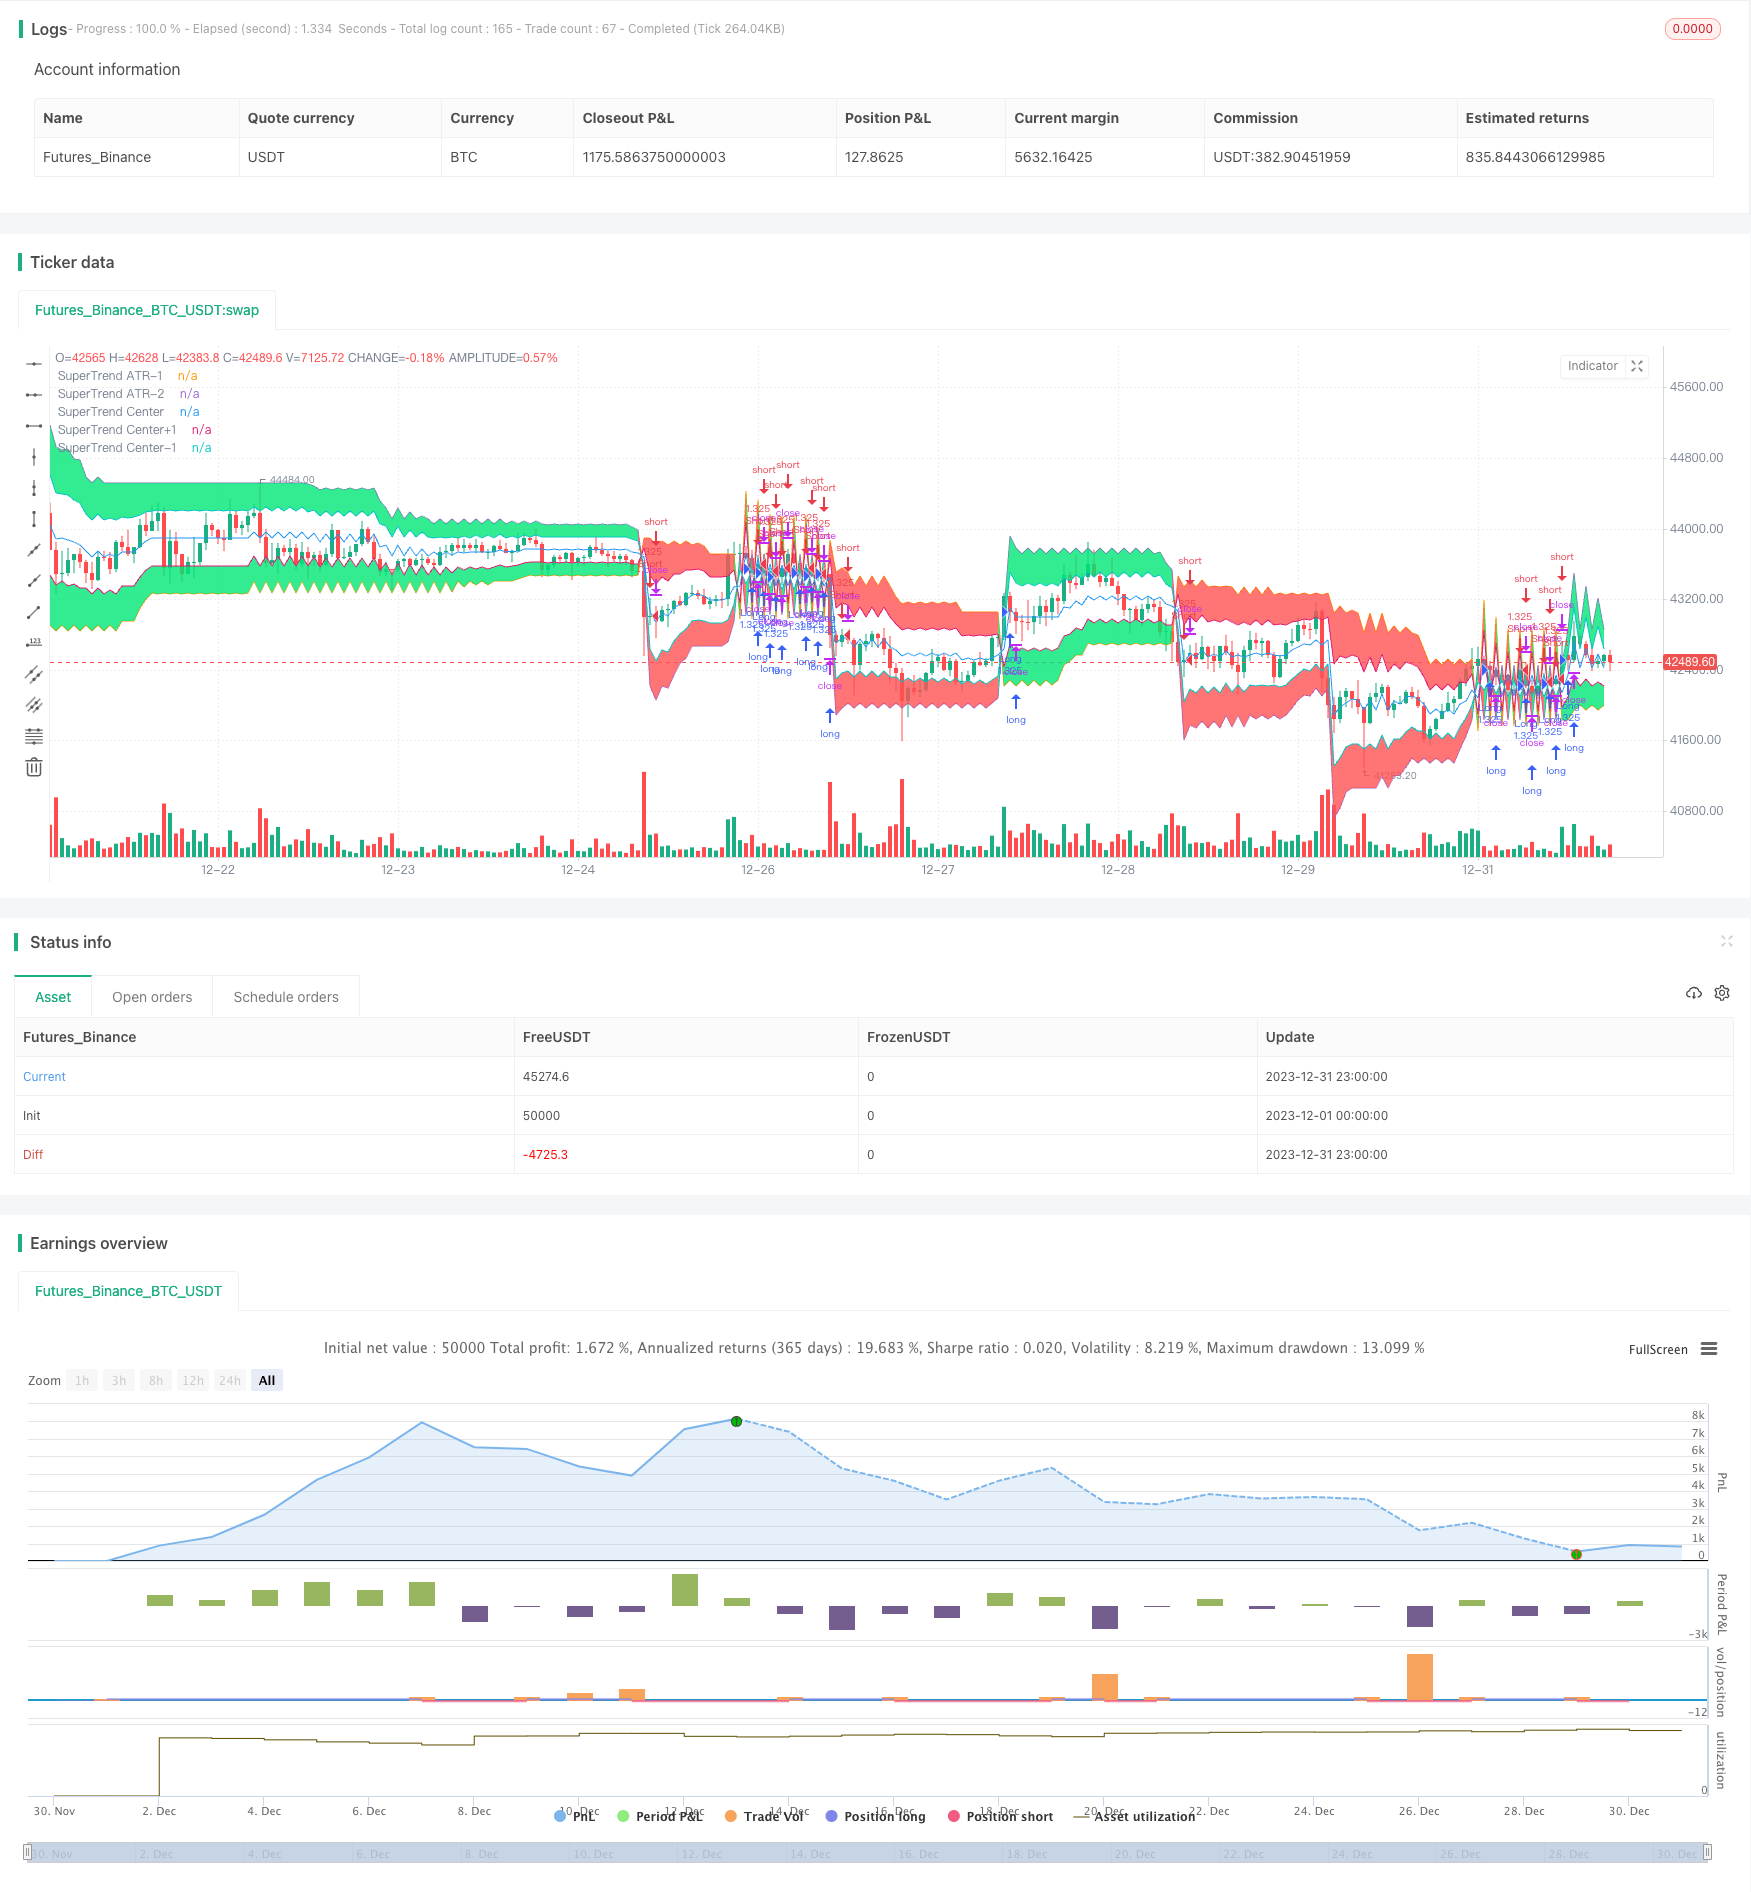
The strategy is named "Trend Following Momentum Breakout Strategy". It uses the Super Trend indicator to determine the current trend direction and combines it with the direction of candlestick bodies for trend following trading to achieve momentum breakouts.
Strategy Logic
The core of this strategy relies on the Super Trend indicator to judge the current trend direction. The Super Trend indicator calculates the upper and lower bands based on the Average True Range (ATR). When prices break through the upper band, it is a bullish signal, and when prices break through the lower band, it is a bearish signal.
When the Super Trend indicator determines an uptrend, if the candlestick is a red body (close below open), go long. When the Super Trend indicator determines a downtrend, if the candlestick is a green body (close above open), go short. This achieves trend following momentum breakout trading.
Advantage Analysis
This strategy combines trend judgment and momentum characteristics to effectively filter out false breakouts and enhance the validity of trading signals. In addition, trading along the trend avoids counter trend operations and greatly improves the probability of profit.
The main advantages are summarized as follows:
- Filter false breakouts by combining trend judgment and momentum characteristics
- Follow the direction of candlestick bodies to avoid counter trend trading
- Higher profitability
Risk Analysis
The main risks of this strategy are:
- The issue of how to set the parameters of the Super Trend indicator. Improper parameter settings may cause misjudgment and generate wrong signals.
- Only following the direction of the candlestick body cannot determine the strength of the body, and there may be loss risks.
- The fixed risk-reward ratio cannot be dynamically adjusted and single loss cannot be controlled.
The counter measures are:
- Optimize the parameters of the Super Trend indicator to make the judgment more accurate.
- Judge the strength of the candlestick body by combining indicators like trading volume and money flow.
- Add dynamic stop loss to control single loss.
Optimization Directions
This strategy can be optimized in the following aspects:
- Combine more technical indicators for signal filtering, such as Bollinger Bands and KDJ, to enhance strategy performance.
- Add machine learning algorithms to dynamically optimize parameters and make the Super Trend indicator more stable.
- Add stop loss mechanisms to stop loss before losses expand.
- Use products with bidirectional trading capabilities, such as futures to make full use of both long and short opportunities.
Summary
In general, this strategy is very suitable for medium and short term positions. By combining trend judgment and breakout momentum, it can effectively filter out noise and improve win rate. At the same time, there is still room for parameter optimization to obtain better strategy performance.
Parameters
| Name | Default | What it controls |
|---|---|---|
| v_input_1 | true | Long |
| v_input_2 | true | Short |
| v_input_3 | 100 | Lot, % |
| v_input_4 | 25 | cloud, % of ATR |
| v_input_5 | 3 | Super Trend |
| v_input_6 | 7 | ATR |
| v_input_7 | true | need center of ATR? |
| v_input_8 | false | need border? |
| v_input_9 | 1900 | From Year |
| v_input_10 | 2100 | To Year |
| v_input_11 | true | From Month |
| v_input_12 | 12 | To Month |
| v_input_13 | true | From day |
| v_input_14 | 31 | To day |
Source Pine Script
/*backtest
start: 2023-12-01 00:00:00
end: 2023-12-31 23:59:59
period: 1h
basePeriod: 15m
exchanges: [{"eid":"Futures_Binance","currency":"BTC_USDT"}]
*/

//Noro
//2018

//@version=2
strategy("Noro's SuperTrend Strategy v1.0", shorttitle = "ST str 1.0", overlay = true, default_qty_type = strategy.percent_of_equity, default_qty_value = 100, pyramiding = 0)

//Settings
needlong = input(true, defval = true, title = "Long")
needshort = input(true, defval = true, title = "Short")
capital = input(100, defval = 100, minval = 1, maxval = 10000, title = "Lot, %")
cloud = input(25, defval = 25, minval = 5, maxval = 50, title = "cloud, % of ATR")
Factor = input(title = "Super Trend", defval = 3, minval = 1, maxval = 100)
ATR = input(title = "ATR", defval = 7, minval = 1,maxval = 100)
centr = input(true, defval = true, title = "need center of ATR?")
border = input(false, defval = false, title = "need border?")
fromyear = input(1900, defval = 1900, minval = 1900, maxval = 2100, title = "From Year")
toyear = input(2100, defval = 2100, minval = 1900, maxval = 2100, title = "To Year")
frommonth = input(01, defval = 01, minval = 01, maxval = 12, title = "From Month")
tomonth = input(12, defval = 12, minval = 01, maxval = 12, title = "To Month")
fromday = input(01, defval = 01, minval = 01, maxval = 31, title = "From day")
today = input(31, defval = 31, minval = 01, maxval = 31, title = "To day")

//Super Trend ATR 1
src = close
Up=hl2-(Factor*atr(ATR))
Dn=hl2+(Factor*atr(ATR))
TUp=close[1]>TUp[1]? max(Up,TUp[1]) : Up
TDown=close[1]<TDown[1]? min(Dn,TDown[1]) : Dn
Trend = close > TDown[1] ? 1: close< TUp[1]? -1: nz(Trend[1],1)
Tsl1 = Trend==1? TUp: TDown
Tsl2 = Trend==1? TDown: TUp
limit = (Tsl1 - Tsl2) / 100 * cloud
upcloud = Tsl1 - limit
dncloud = Tsl2 + limit

//Cloud
linecolor = Trend == 1 ? green : red
centercolor = centr == true ? blue : na
cloudcolor = Trend == 1 ? green : red
cline = (Tsl1 + Tsl2) / 2
P1 = plot(Tsl1, color = border == false ? na : linecolor , style = line , linewidth = 1,title = "SuperTrend ATR-1")
P2 = plot(Tsl2, color = border == false ? na : linecolor , style = line , linewidth = 1,title = "SuperTrend ATR-2")
P3 = plot(cline, color = centercolor , style = line , linewidth = 1,title = "SuperTrend Center")
P4 = plot(upcloud, color = border == false ? na : linecolor , style = line , linewidth = 1,title = "SuperTrend Center+1")
P5 = plot(dncloud, color = border == false ? na : linecolor , style = line , linewidth = 1,title = "SuperTrend Center-1")
fill(P1, P4, color = linecolor == red ? red : lime, transp = 50)
fill(P2, P5, color = linecolor == red ? red : lime, transp = 50)

//Signals
up = Trend == 1 and close < open //and low < cline
dn = Trend == -1 and close > open //and high > cline

//Trading
size = strategy.position_size
lot = 0.0
lot := size == 0 ? strategy.equity / close * capital / 100 : lot[1]
if up
    strategy.entry("Long", strategy.long, needlong ? lot : 0)

if dn
    strategy.entry("Short", strategy.short, needshort ? lot : 0)
Published by ChaoZhang on the FMZ strategy square · last modified 2024-01-05. Collected in the Quant Trading Vault. Unvalidated research: re-test with your own data and costs before trusting it.
Build this with AgenKit
A spec is not a trading system. Paste this into your coding agent and AgenKit runs a specialist team — architecture, test-first build, risk gates, review — with paper trading on by default.
/agenkit build a production-grade trading bot with a backtest engine, risk controls and paper trading by default from strategies/Trend-Following-Momentum-Breakout-Strategy.md- npx agenkit install engineering-kit in your project
- Paste the command into your agent and approve each phase
- Get tests, backtest, risk controls and a paper-trading switch
Understand it first
Before you run this, read the lesson behind the idea and how to backtest it honestly. Specs like this one are the survivors of an unknown number of trials; deflate their results accordingly.
Related specs
- Momentum Breakout Trading Strategy 440964Pine Script · Breakout · 5m
- Dual MA Indicator Oscillating Price Tracking StrategyPine Script · Breakout · 2h
- Cross Timeframe SuperTrend Breakout StrategyPine Script · Breakout · 1h
- Multi Moving Average Supertrend with Bollinger Breakout Trading StrategyPine Script · Breakout · 1d
- Triple Pattern Oscillation Trading StrategyPine Script · Breakout · 1h
- BB Breakout StrategyPine Script · Breakout · 1d