Strategy vault / Trend following
Trend Retracement Dynamic Entry Strategy with Adjustable Risk Management
The Trend Retracement Dynamic Entry Strategy with Adjustable Risk Management is designed for swing traders who want to enter long positions on pullbacks after a short-term trend shift, while also allowing immediate…
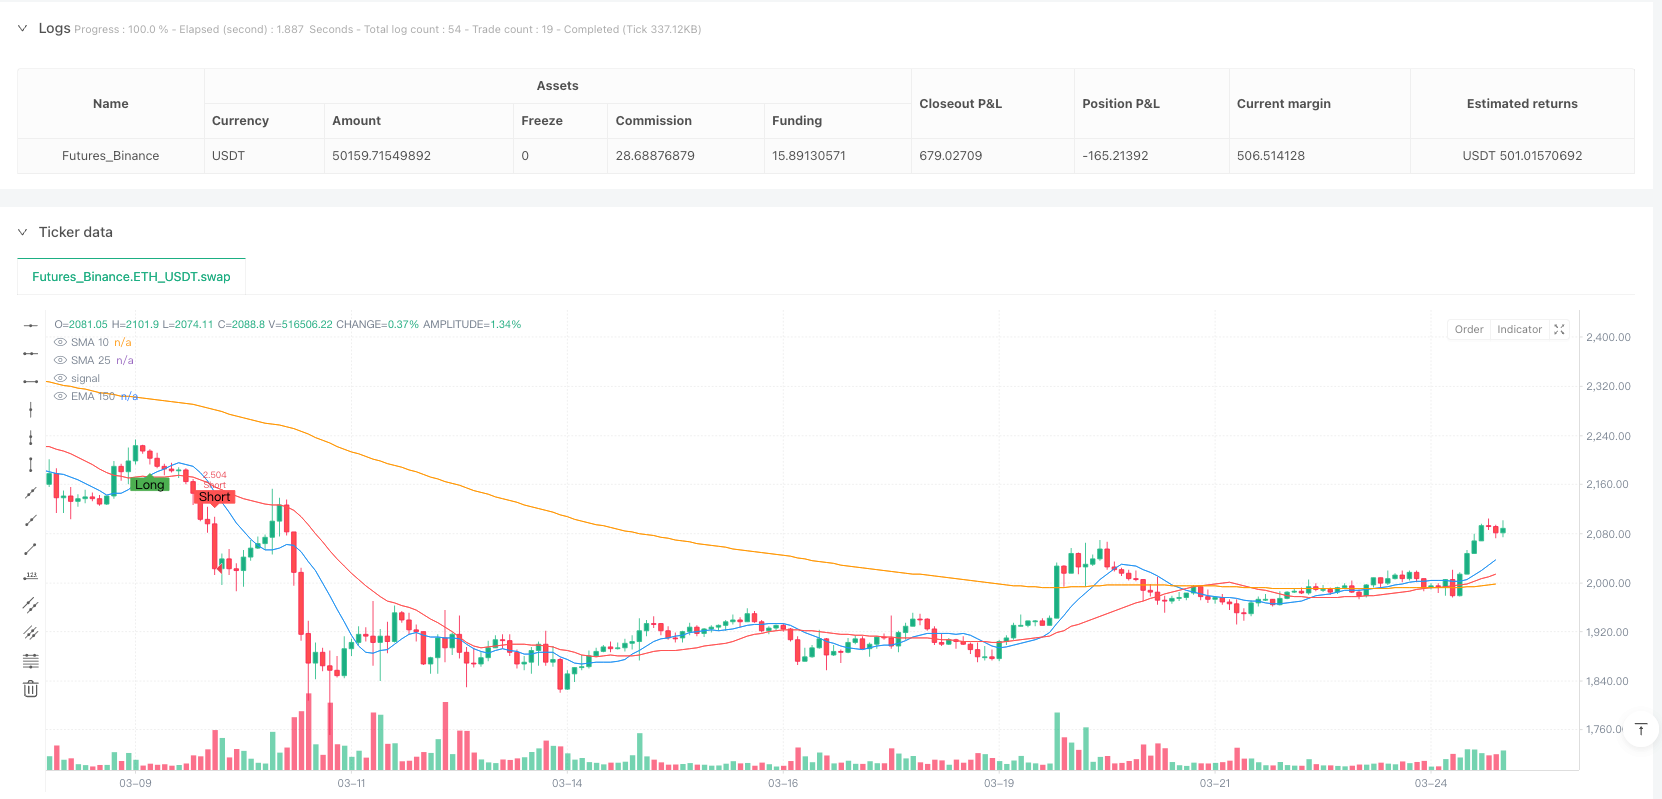
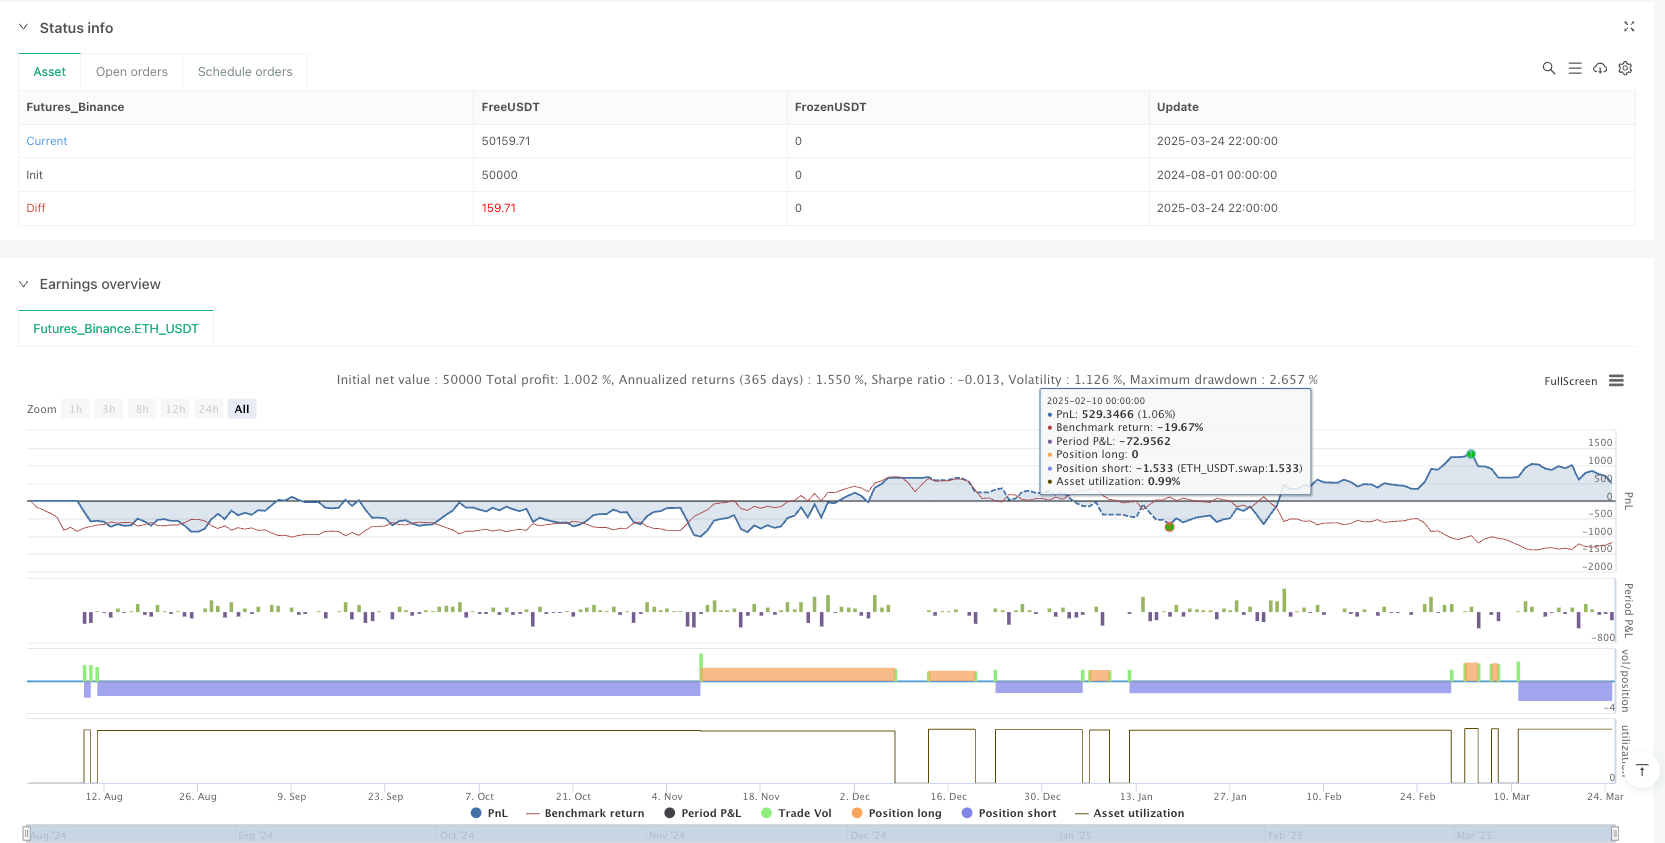
Overview
The Trend Retracement Dynamic Entry Strategy with Adjustable Risk Management is designed for swing traders who want to enter long positions on pullbacks after a short-term trend shift, while also allowing immediate short entries when market conditions favor downside movement. This strategy combines SMA crossovers for trend confirmation, fixed-percentage retracement entry points, and adjustable risk management parameters for optimal trade execution.
The core of the strategy uses crossovers between 10-period and 25-period Simple Moving Averages (SMA) to confirm trend direction, combined with a 150-period Exponential Moving Average (EMA) as an additional filter for short trades. Long trades are not entered immediately after the SMA crossover but instead wait for price to pull back to a specified percentage, which optimizes entry price and improves the risk-reward ratio.
Strategy Principles
The operational principles of this strategy can be divided into several key components:
Trend Confirmation Mechanism:
- When the 10-period SMA crosses above the 25-period SMA, the system identifies a bullish trend shift
- When the 10-period SMA crosses below the 25-period SMA, the system identifies a bearish trend shift
- Short trades are only executed when price is below the 150-period EMA, ensuring alignment with the broader trend
Long Pullback Entry Mechanism:
- Instead of entering immediately on the SMA crossover signal, the strategy waits for a price pullback before entering a long position
- The entry point is defined as a fixed percentage retracement (default 1%) from the recent high
- The system dynamically calculates and plots a support level to visualize the pullback entry zone
- A long entry is triggered when price bounces upward and crosses above the retracement level
Short Entry Rules:
- If the 10-period SMA crosses below the 25-period SMA and price is below the 150-period EMA, a short position is entered immediately
Risk Management & Exit Strategy:
- Take Profit (TP) - Adjustable profit target in points (default: 1000 points)
- Stop Loss (SL) - Adjustable stop loss level in points (default: 250 points)
- Break-Even (BE) - When price moves in favor by a set number of points, the stop loss is moved to break-even
- Extra Exit Condition for Longs: If the 10-period SMA crosses below the 25-period SMA while price is below the 150-period EMA, the strategy force-exits the long position to avoid losses from trend reversals
The strategy uses persistent variables to track pullback signals and ensure entries at the correct time. When no position is open, the system resets all flags and levels in preparation for the next trading signal.
Strategy Advantages
After in-depth code analysis, this strategy demonstrates the following significant advantages:
Optimized Entry Timing:
- By waiting for pullbacks instead of entering immediately on crossover signals, the strategy achieves better entry prices
- This approach reduces initial risk and improves potential risk-reward ratio
- The retracement percentage is adjustable, adapting to different market environments and trader risk preferences
Comprehensive Risk Management:
- Precise stop loss and take profit parameters ensure that each trade has clear risk boundaries
- The break-even mechanism protects profitable trades and reduces overall drawdown
- All risk parameters are adjustable, adapting to different market volatilities
Trend Alignment Filtering:
- Using EMA150 as an additional filter ensures short-term trades align with the longer-term trend
- Extra exit rules when trend reverses protect capital from major losses
Visual Feedback:
- The system plots retracement levels and signals on the chart, providing clear visual guidance
- Trade execution and exit points are clearly marked, facilitating backtesting and strategy improvement
High Adaptability:
- The strategy is applicable to various asset classes, including stocks, forex, and indices
- Strong parameter adjustability makes it suitable for different market environments and trading styles
Strategy Risks
Despite its many advantages, the strategy has the following risks that should be noted:
Fast Market Risks:
- In highly volatile markets, prices may gap through planned entry points or stop levels
- Extreme market events may lead to increased slippage, affecting actual execution prices
- Solution: Adjust retracement percentage and risk parameters during high volatility periods, or consider temporarily suspending trading
Oscillating Market Performance:
- The strategy relies on trend confirmation and may generate false signals in sideways, range-bound markets
- Frequent SMA crossovers may lead to consecutive losing trades
- Solution: Add additional trend strength filters, such as the ADX indicator, or pause trading during oscillating markets
Limitations of Fixed Point Risk Management:
- Using fixed points for stop loss and take profit may not adapt well to different market volatilities
- During expanding volatility, this could lead to premature stops or take profit targets that are too distant
- Solution: Consider dynamic stop loss and take profit levels based on ATR (Average True Range)
Over-reliance on Technical Indicators:
- The strategy relies entirely on technical indicators, ignoring fundamental factors and market sentiment
- SMAs and EMAs are lagging indicators that may not respond timely to market turning points
- Solution: Incorporate other leading indicators or market sentiment indicators, such as RSI or money flow indicators
Parameter Optimization Risk:
- Excessive parameter optimization may lead to curve-fitting that performs poorly in future market conditions
- Solution: Use sufficiently long historical data for backtesting and validate strategy robustness under different market conditions
Strategy Optimization Directions
Based on code analysis, here are several key directions for optimizing this strategy:
Dynamic Risk Management:
- Convert fixed-point stop loss and take profit to ATR-based dynamic levels
- This allows risk management to adapt to current market volatility, setting smaller stops during low volatility periods and larger stops during high volatility periods
- Implementation method: Use calculations like
stopDistance = input.float(2.0) * ta.atr(14)
Trend Strength Filtering:
- Add ADX (Average Directional Index) or similar indicators to measure trend strength
- Only execute trades when the trend is strong enough (e.g., ADX > 25) to avoid false signals in oscillating markets
- This would significantly reduce false signals and improve win rate
Multi-timeframe Analysis:
- Integrate trend information from higher timeframes to ensure trades align with larger trends
- For example, only trade when both daily and 4-hour charts show the same trend direction
- This approach can increase trade success rate and reduce the risk of counter-trend trading
Intelligent Retracement Identification:
- Replace the simple fixed percentage with more sophisticated retracement identification methods
- Consider using Fibonacci retracement levels or key support/resistance levels
- This would provide more meaningful entry points that better align with market structure
Volume Confirmation:
- Add volume analysis as part of the confirmation signal
- Look for higher quality entry points in low-volume pullbacks and high-volume breakouts
- Volume confirmation can significantly improve signal quality and reduce noise trades
Adaptive Parameters:
- Develop a mechanism to dynamically adjust strategy parameters based on recent market performance
- For example, automatically increase retracement percentage when volatility increases
- This adaptive capability would help the strategy maintain robustness across different market environments
Summary
The Trend Retracement Dynamic Entry Strategy with Adjustable Risk Management is a carefully designed trading system that combines trend identification, optimized entries, and comprehensive risk management. By waiting for price pullbacks before entering, the strategy achieves better entry prices and risk-reward ratios than simple SMA crossover systems.
The core strength of this strategy lies in its flexibility and adjustability, allowing traders to tune parameters according to personal risk preferences and market conditions. At the same time, the integrated risk management features, including stop loss, take profit, and break-even points, provide comprehensive capital protection.
However, the strategy also has some limitations, including performance in oscillating markets and the constraints of fixed-point risk management. By implementing the suggested optimizations, such as dynamic risk management, trend strength filtering, and volume confirmation, the robustness and overall performance of the strategy can be significantly improved.
For swing traders, this is an ideal base strategy that can be further customized according to individual trading styles and goals. With proper parameter settings and continuous monitoring and adjustment, this strategy has the potential to provide stable trading results across various market environments.
Source Pine Script
/*backtest
start: 2024-08-01 00:00:00
end: 2025-03-25 00:00:00
period: 2h
basePeriod: 2h
exchanges: [{"eid":"Futures_Binance","currency":"ETH_USDT"}]
*/

//@version=6
strategy("BTCUSD with adjustable sl,tp",
     overlay=true,
     initial_capital=10000,
     default_qty_type=strategy.percent_of_equity,
     default_qty_value=10,
     calc_on_every_tick=true)

// ─────────────────────────────────────────────────────────────────────────────
//  ▌ USER INPUTS
// ─────────────────────────────────────────────────────────────────────────────
longSignalStyle  = input.string("Label Up", title="Long Signal Style", options=["Label Up", "Arrow Up", "Cross"])
shortSignalStyle = input.string("Label Down", title="Short Signal Style", options=["Label Down", "Arrow Down", "Cross"])

// Adjustable exit parameters (in points)
tpDistance    = input.int(1000, "Take Profit Distance (points)", minval=1)
slDistance    = input.int(250, "Stop Loss Distance (points)",   minval=1)
beTrigger     = input.int(500, "Break-Even Trigger Distance (points)", minval=1)

// Adjustable retracement percentage for long pullback entry (e.g. 0.01 = 1%)
retracementPct = input.float(0.01, "Retracement Percentage (e.g. 0.01 for 1%)", step=0.001)

// ─────────────────────────────────────────────────────────────────────────────
//  ▌ INDICATORS: SMA & EMA
// ─────────────────────────────────────────────────────────────────────────────
sma10  = ta.sma(close, 10)
sma25  = ta.sma(close, 25)
ema150 = ta.ema(close, 150)

plot(sma10,  color=color.blue,   title="SMA 10")
plot(sma25,  color=color.red,    title="SMA 25")
plot(ema150, color=color.orange, title="EMA 150")

// ─────────────────────────────────────────────────────────────────────────────
//  ▌ ENTRY CONDITIONS
// ─────────────────────────────────────────────────────────────────────────────
longCondition  = ta.crossover(sma10, sma25)
shortCondition = ta.crossunder(sma10, sma25)
shortValid     = close < ema150  // Only take shorts if price is below EMA150

// Plot immediate entry signals (for visual reference)
plotshape(longCondition and (strategy.position_size == 0), title="Long Signal",
     style=(longSignalStyle == "Label Up" ? shape.labelup : (longSignalStyle == "Arrow Up" ? shape.triangleup : shape.cross)),
     location=location.belowbar, color=color.green, text="Long", size=size.small)
plotshape(shortCondition and shortValid and (strategy.position_size == 0), title="Short Signal",
     style=(shortSignalStyle == "Label Down" ? shape.labeldown : (shortSignalStyle == "Arrow Down" ? shape.triangledown : shape.cross)),
     location=location.abovebar, color=color.red, text="Short", size=size.small)

// ─────────────────────────────────────────────────────────────────────────────
//  ▌ LONG PULLBACK ENTRY USING FIXED PERCENTAGE RETRACEMENT
// ─────────────────────────────────────────────────────────────────────────────
// We use persistent variables to track the pullback signal.
var bool longSignalActive = false
var float pullHigh = na        // highest high since long signal activation
var float retraceLevel = na    // level = pullHigh * (1 - retracementPct)

// Only consider new entries when no position is open.
if strategy.position_size == 0
    // When a long crossover occurs, activate the signal and initialize pullHigh.
    if longCondition
        longSignalActive := true
        pullHigh := high

    // If signal active, update pullHigh and compute retracement level.
    if longSignalActive
        pullHigh := math.max(pullHigh, high)
        retraceLevel := pullHigh * (1 - retracementPct)

        // When price bounces upward and crosses above the retracement level, enter long
        if ta.crossover(close, retraceLevel)
            strategy.entry("Long", strategy.long)
            longSignalActive := false

    // Short entries: enter immediately if conditions are met
    if shortCondition and shortValid
        strategy.entry("Short", strategy.short)

// ─────────────────────────────────────────────────────────────────────────────
//  ▌ EXIT CONDITIONS WITH ADJUSTABLE TP, SL & BE
// ─────────────────────────────────────────────────────────────────────────────
var bool beLong  = false
var bool beShort = false

// LONG EXIT LOGIC
if strategy.position_size > 0 and strategy.position_avg_price > 0
    longEntry = strategy.position_avg_price

    // Additional exit: if SMA(10) crosses below SMA(25) while price < EMA150, exit long
    if ta.crossunder(sma10, sma25) and close < ema150
        label.new(bar_index, low, "SMA Exit", style=label.style_label_down, color=color.red, textcolor=color.white)
        strategy.close("Long", comment="SMA Cross Exit")

    // Break-even trigger if price moves in favor by beTrigger points
    if close >= longEntry + beTrigger
        beLong := true

    effectiveLongStop = beLong ? longEntry : (longEntry - slDistance)
    if close <= effectiveLongStop
        label.new(bar_index, low, (beLong ? "BE Hit" : "SL Hit"), style=label.style_label_down, color=color.red, textcolor=color.white)
        strategy.close("Long", comment=(beLong ? "BE Hit" : "SL Hit"))

    if close >= longEntry + tpDistance
        label.new(bar_index, high, "TP Hit", style=label.style_label_up, color=color.green, textcolor=color.white)
        strategy.close("Long", comment="TP Hit")

// SHORT EXIT LOGIC
if strategy.position_size < 0 and strategy.position_avg_price > 0
    shortEntry = strategy.position_avg_price

    // Basic stop logic
    if close >= shortEntry + slDistance
        label.new(bar_index, high, (beShort ? "BE Hit" : "SL Hit"), style=label.style_label_up, color=color.red, textcolor=color.white)
        strategy.close("Short", comment=(beShort ? "BE Hit" : "SL Hit"))

    // Take profit logic
    if close <= shortEntry - tpDistance
        label.new(bar_index, low, "TP Hit", style=label.style_label_down, color=color.green, textcolor=color.white)
        strategy.close("Short", comment="TP Hit")

    // Break-even trigger
    if close <= shortEntry - beTrigger
        beShort := true

    effectiveShortStop = beShort ? shortEntry : (shortEntry + slDistance)
    if close >= effectiveShortStop
        label.new(bar_index, high, (beShort ? "BE Hit" : "SL Hit"), style=label.style_label_up, color=color.red, textcolor=color.white)
        strategy.close("Short", comment=(beShort ? "BE Hit" : "SL Hit"))

// Reset BE flags when no position is open
if strategy.position_size == 0
    beLong  := false
    beShort := false
    // Reset the pullback signal
    if not longSignalActive
        pullHigh := na
        retraceLevel := na
Published by ianzeng123 on the FMZ strategy square · last modified 2025-03-26. Collected in the Quant Trading Vault. Unvalidated research: re-test with your own data and costs before trusting it.
Build this with AgenKit
A spec is not a trading system. Paste this into your coding agent and AgenKit runs a specialist team — architecture, test-first build, risk gates, review — with paper trading on by default.
/agenkit build a production-grade trading bot with a backtest engine, risk controls and paper trading by default from strategies/Trend-Retracement-Dynamic-Entry-Strategy-with-Adjustable-Risk-Management.md- npx agenkit install engineering-kit in your project
- Paste the command into your agent and approve each phase
- Get tests, backtest, risk controls and a paper-trading switch
Understand it first
Before you run this, read the lesson behind the idea and how to backtest it honestly. Specs like this one are the survivors of an unknown number of trials; deflate their results accordingly.
Related specs
- ADX MA and EMA Long Only Trend Tracking StrategyPine Script · Trend following · 1d
- ATR and Moving Average Crossover Hybrid StrategyPine Script · Trend following · 1h
- Bollinger Band Moving Average Crossover StrategyPine Script · Trend following · 1h
- Bollinger Bands and EMA Trend Following StrategyPine Script · Trend following · 1h
- Bollinger Bands and RSI Trend Following StrategyPine Script · Trend following · 1h
- Candlestick Pattern Trend Filter StrategyPine Script · Trend following · 1d